Special Report: The economy in March
Below is this month’s report for MB subscribers summarising the major statistical releases pertaining to the Australian economy in March, broken-down by topic.
Housing
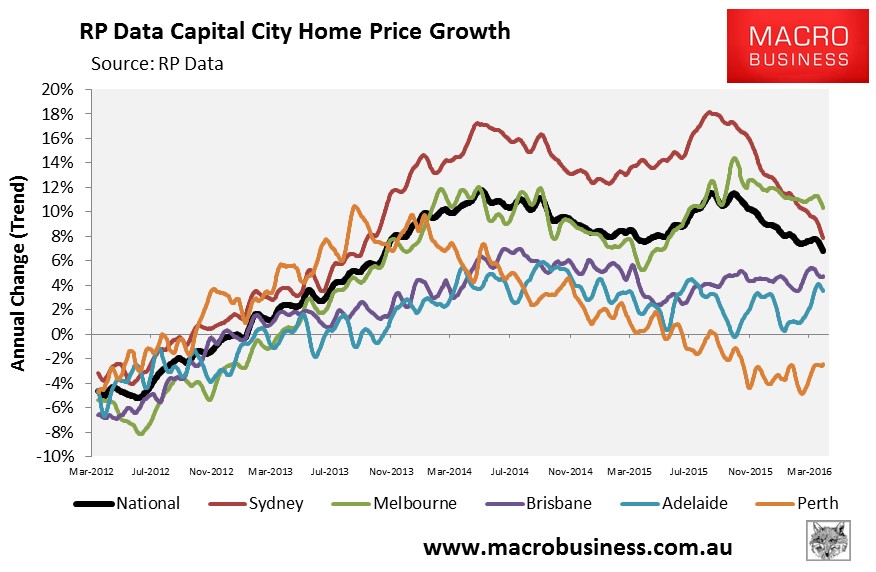
On Friday, Core Logic-RP Data released its home values results for March, which registered 0.2% growth at the 8-city level – the third consecutive monthly increase in values. Quarterly price growth also came in at 1.6%.
However, the below chart shows that annual price growth continued to slow to 6.4%, led by a sharp slowdown in Sydney where dwelling values have been unchanged for six months.
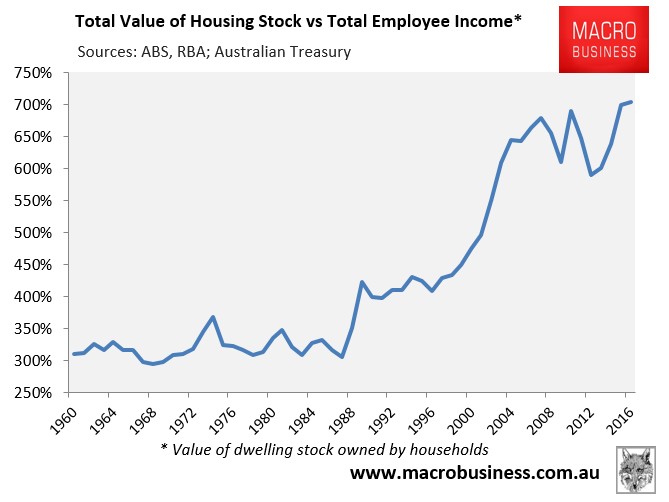
According to ABS data released in March, Australian housing values hit a record high 704% of total employee income in the December quarter:
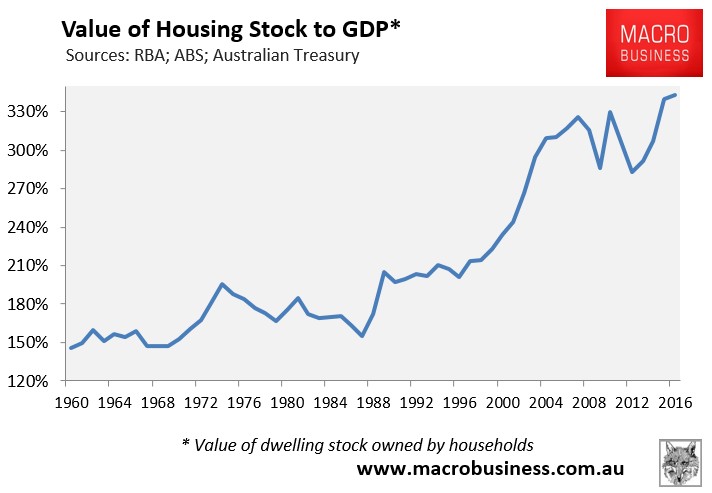
And a record high 343% of GDP:
Meanwhile, rental growth remains in the gutter, with RP Data’s latest rental report revealing that rents again registered zero growth in the year to February 2016 – the slowest growth on record:
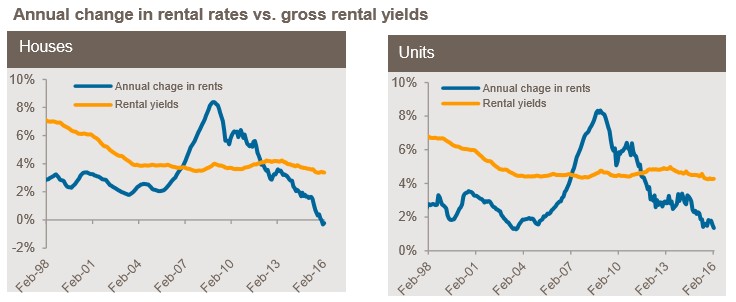
According to RP Data, further declines in rental growth are likely:
Capital city rents are recording their weakest annual change on record and with value rises outpacing rental growth, rental yields are also sitting at record low levels currently…
The causes of the slowdown in rental growth is falling wages, excess rental supply in certain areas and lower rates of population growth and population mobility impacting on demand for rental accommodation. With construction activity set to peak over the next 24 months, but many new properties still to settle, there is a real possibility that rental rates will fall over the coming months.
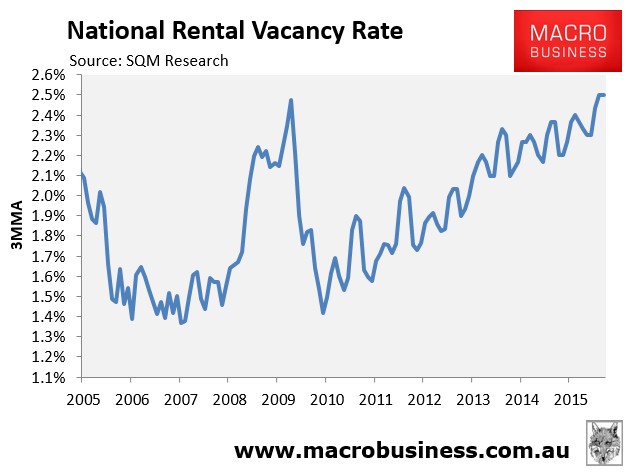
Support for RP Data’s view came from the rental vacancy data released by SQM Research, which again registered a trend national vacancy rate of 2.5% in February, which is comparable to the GFC high:
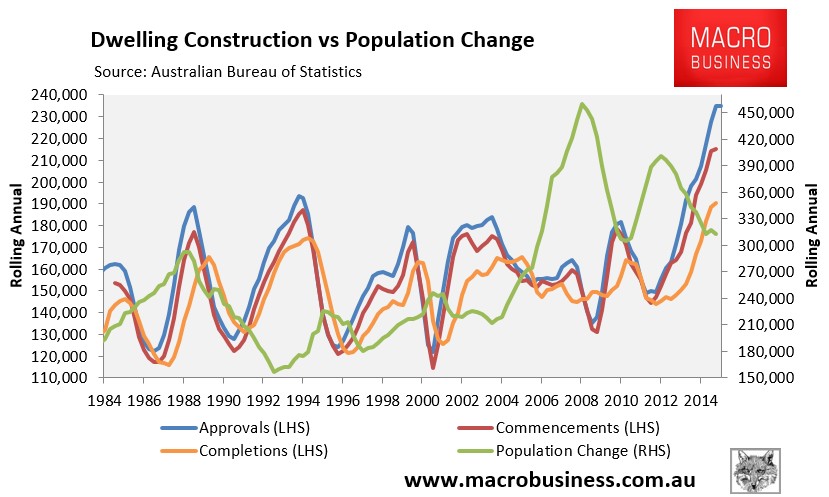
Moreover, population data for the September quarter, released last month by the ABS, showed that growth continued to fall, clocking in at 1.3%, which was the slowest pace in a decade. Combined with the surge in dwelling construction, the data is pointing to a potential dwelling glut in some jurisdictions – namely Brisbane, Perth and Melbourne – with Sydney’s much vaunted “housing shortage” also being eradicated (see here for the detail):
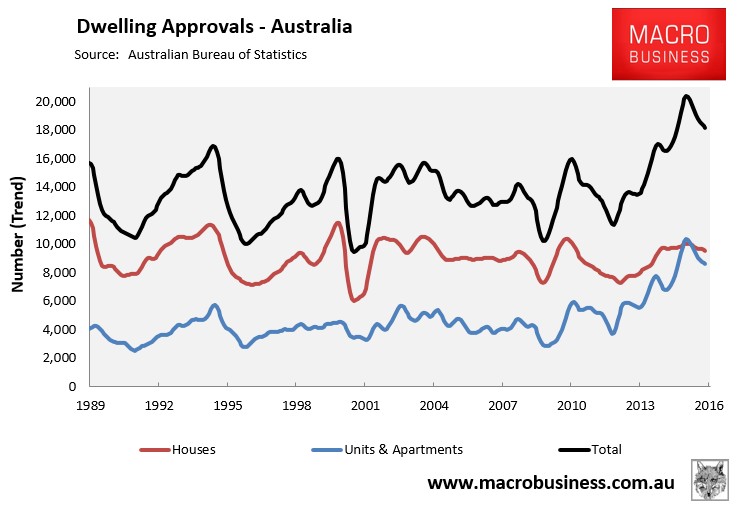
That said, the dwelling construction outlook continues to sour, with dwelling approvals for February declining again in trend terms such that they are now 12.9% below the March 2015 peak:
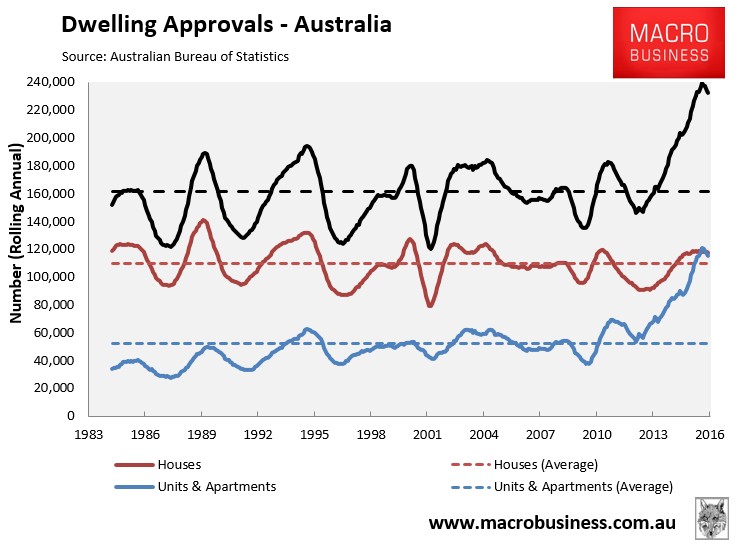
Dwelling approvals are also declining in rolling annual terms:
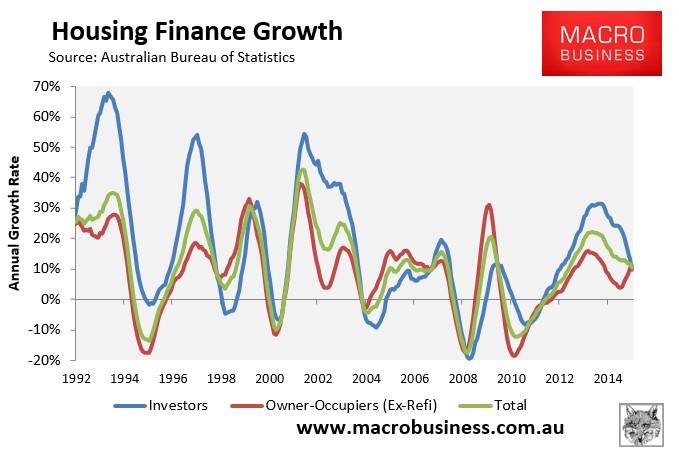
Turning to mortgage demand, housing finance came in weak in January, with the value of owner-occupied finance commitments (excluding refinancings) plummeting by a seasonally adjusted 5.4% in January and investor commitments also falling by 1.6%.
The trend also remains weak with the annual growth rate of total finance commitments (ex-refinancings) continuing to fall, albeit with some offset between sharply falling investor demand and rising owner-occupied demand:
The RBA’s housing credit growth data for February also revealed weakness, with quarterly growth continuing to fall sharply:
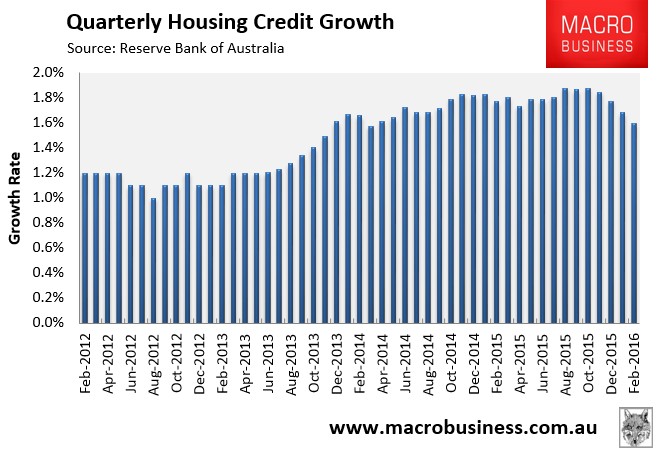
Other things equal, the falling growth in mortgage demand suggests that price momentum should continue to weaken.
It’s a housing bubble economy:
The month started with the release of the national accounts data for the December quarter, which registered stronger than expected growth in real GDP of 0.6% over the quarter and 3.0% growth over the year, smashing analyst’s expectations.
Seasonally adjusted GDP growth for the quarter was driven by household final consumption expenditure, which contributed 0.4 percentage points, and Public gross fixed capital formation, which contributed 0.2 percentage points to GDP growth.
Reflecting Australia’s houses and holes economy, the main contributors to GDP growth over the year were Financial and insurance services (+0.4 percentage points), Mining (+0.4 percentage points), Construction (+0.3 percentage points), and Rental Hiring and Real Estate Services (+0.3 percentage points), although Health (+0.3 percentage points) also contributed to growth.
While the headline result was good, the detail wasn’t.
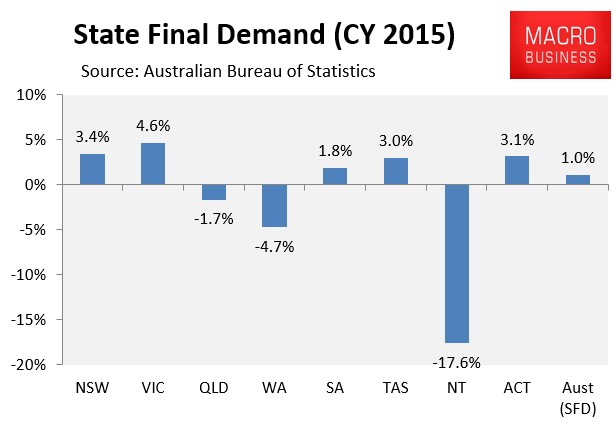
Final demand, which excludes export volumes, was weak in 2015 and concentrated in the housing bubble epicentres of VIC and NSW:
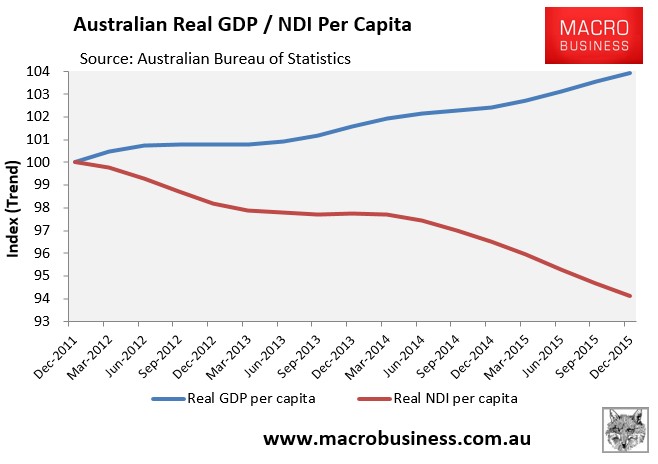
National Disposable income per capita – the key measure for living standards – also fell by 0.4% over the quarter, by 2.3% over the year, and by 5.9% since December 2011 on account of the falling terms-of-trade:
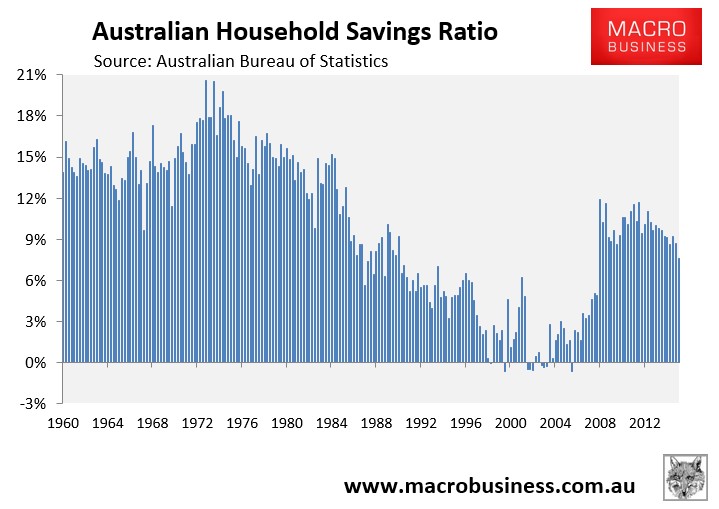
Real GDP per hour worked also fell by 0.6% in the December quarter and was down by 0.4% over the year, suggesting deteriorating labour productivity, whereas the household savings rate fell to its lowest level since the GFC hit in September 2008:
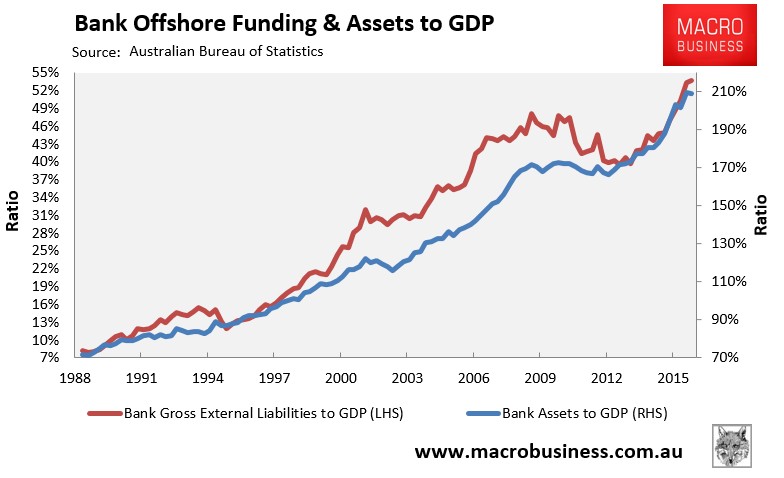
In the meantime, offshore borrowings by Australia’s banks – used primarily to pump mortgages – hit an all-time high 54% of GDP:
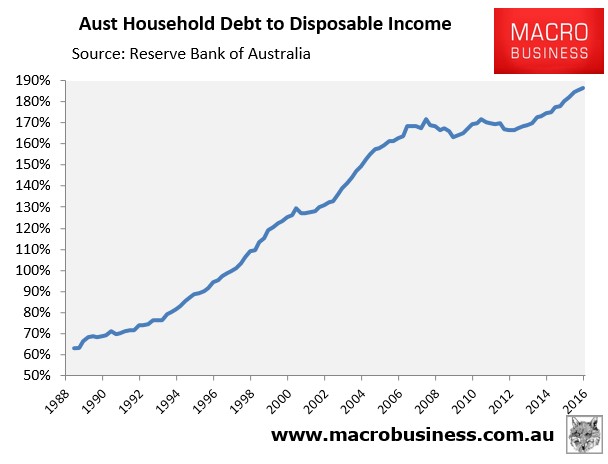
Whereas household debt hit a record 186% against household disposable income:
Thus, the economy is being driven by the housing bubble (debt) induced binge in consumption and dwelling construction, which is clearly unsustainable. Meanwhile, national disposable income continues to shrink, domestic demand is poor, and labour productivity has stalled.
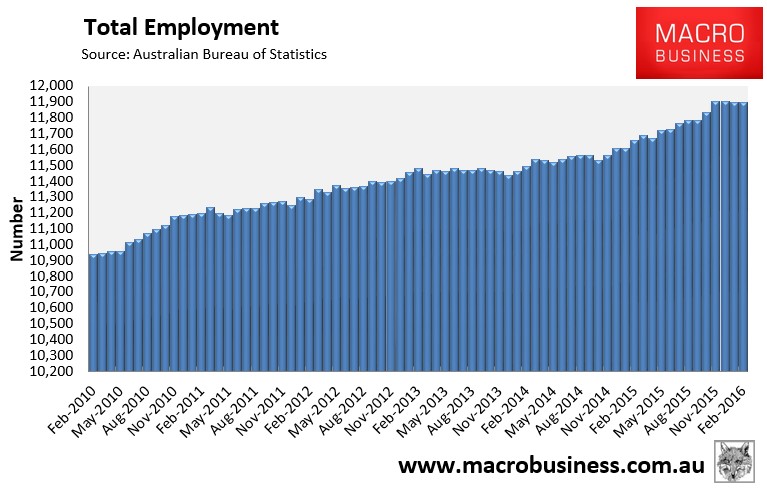
The labour force data released in March was equally unbalanced. While the headline unemployment rate fell to 5.8% following a big fall in the participation rate (see here for the detail), total employment has plateaued:
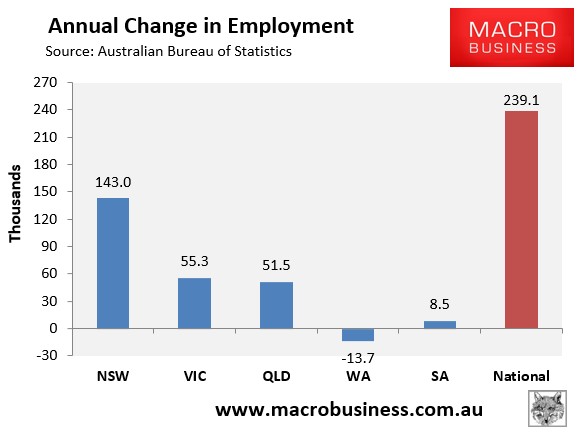
And 60% of the jobs growth in the year to February 2016 was driven by the housing bubble epicentre of Sydney, with Melbourne playing a supporting role:
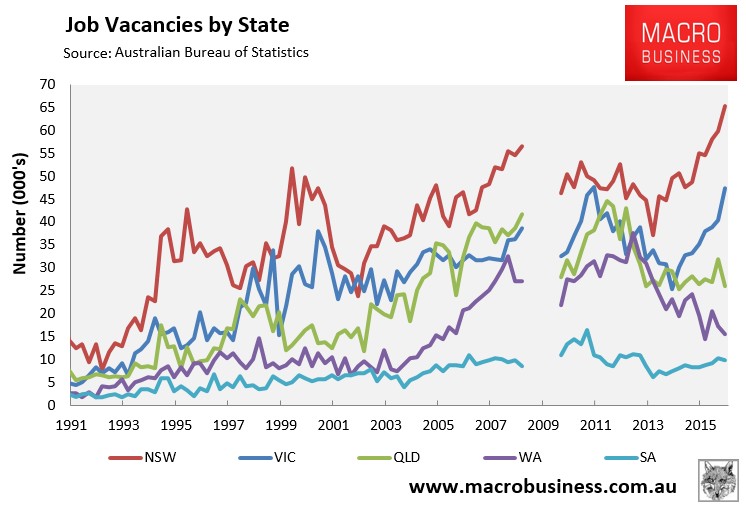
The ABS job vacancies report also showed that employment is tracking the housing bubble, with all of the gains coming from NSW (Sydney) and VIC (Melbourne), with the other jurisdictions languishing:
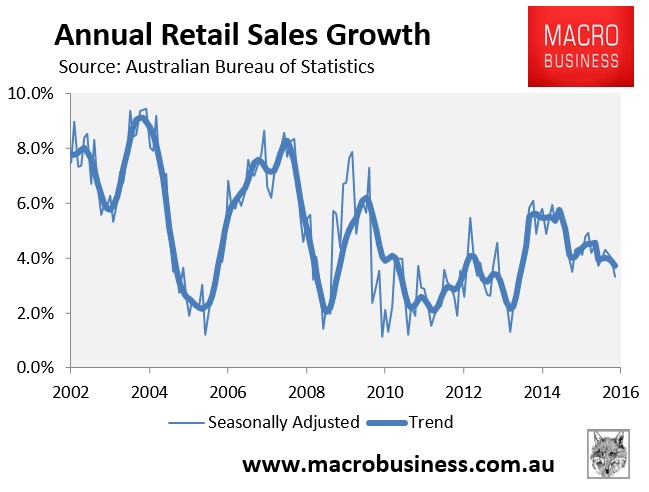
In other economic news, retail sales data for February came in flat with annual growth slowing to its weakest pace since September 2013:
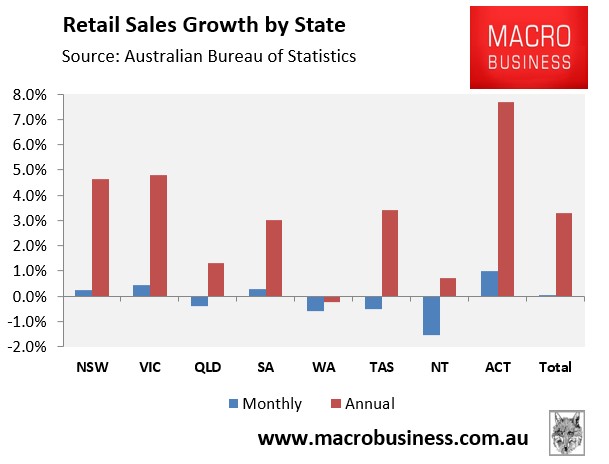
Again, it was the housing bubble states of VIC and NSW driving sales growth nationally, with assistance from Canberra:
Commodities:
The news on the commodities front was mixed in March.
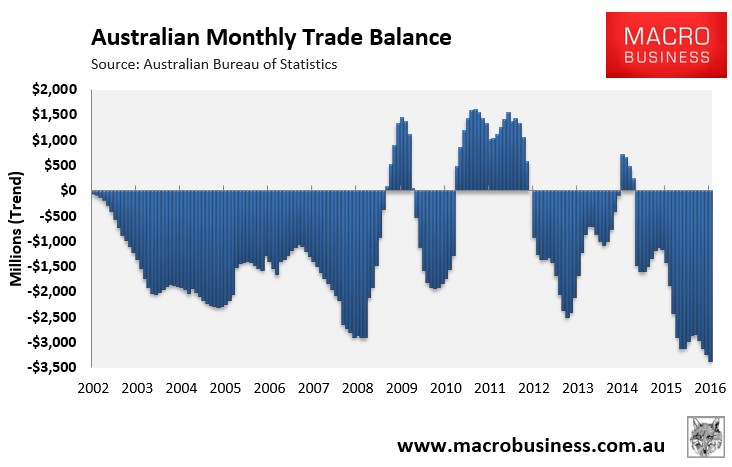
First, the international trade data for January was released which revealed the worst trade deficit on record in nominal trend terms, coming in at a whopping $3,364 million:
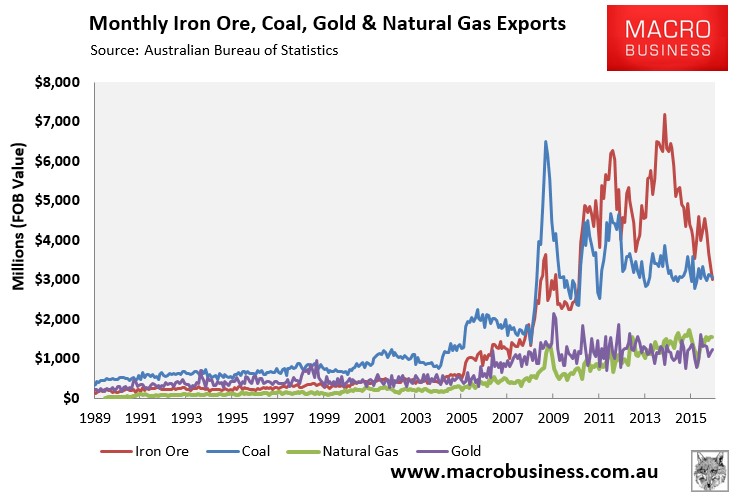
For the first time in years, coal also overtook iron ore as Australia’s biggest export commodity:
That said, the RBA’s commodity price index rebounded strongly in March, registering a big 5.3% bounce in SDR (currency weighted) terms over the month to be up by 6.0% over the March quarter:
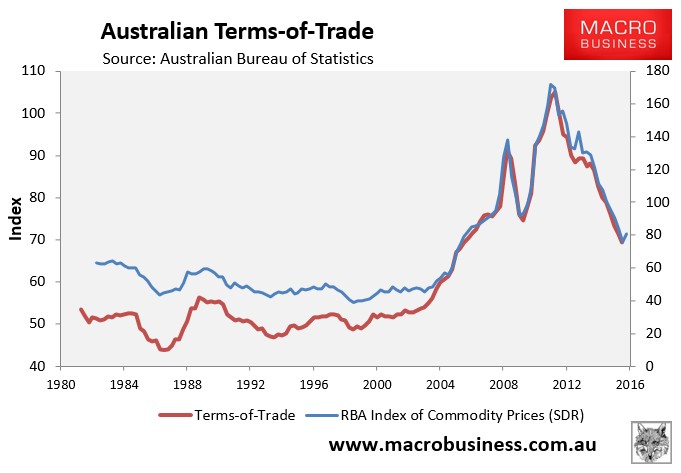
As shown above, there is a strong correlation between the terms-of-trade and the RBA’s commodity price index in SDR terms.
This means that the terms-of-trade will get a much needed reprieve when the national accounts for March 2016 are released in early June. And with it, the national income recession that has been in motion since late-2011 will take a pause.
We expect the reprieve to be short-lived, however, with the iron ore market currently being supported by short-term factors (e.g. restocking and the Tangshan Flower Show), and the market still facing structural oversupply on the back of still rising global mine volumes and falling Chinese steel demand.
Conclusion
It was a mixed month for the economy in March.
Housing credit continues to slow after macroprudential measures. And with it, house price growth is fading as are rents. The peak in residential construction is also in sight, although actual construction should stay strong for several more months.
The economy and labour market are currently being supported by the big housing bubbles in Sydney and Melbourne, but these are both unsustainable and losing steam, pointing to weakness in the second half.
Commodity prices rebounded in the March quarter, which should support national income growth in the upcoming national accounts. But the factors driving this rebound are temporary, and the terms-of-trade will likely resume its fall over the second half, pulling down income growth in the process.
Overall, we see no reason to change our forecasts, namely:
- more rate cuts, the only question is when;
- a resumption of commodity price falls, especially for iron ore and LNG;
- a resumption of falls for the dollar following the recent bounce;
- struggling profits in mining, increasingly in banks, and a productivity push across industrials, and
- a housing market in which prices will stall and then fall later in the year.
unconventionaleconomist@hotmail.com
