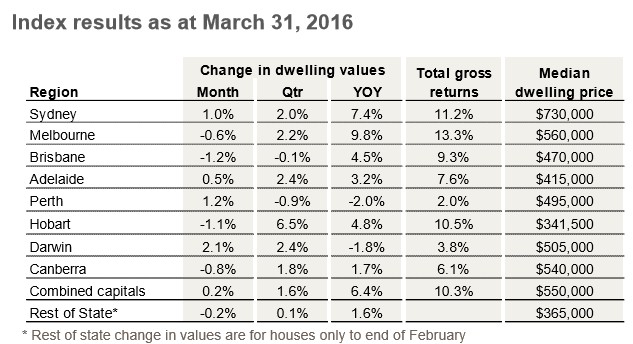
Following on from my post yesterday on RP Data’s daily dwelling values index results for March, Core Logic-RP Data has released its full results, which also cover the smaller capitals and regional areas (see next table).
As you can see above, the smaller capitals and the regions had a mixed month in March, with Darwin (+2.1%) recording a big rise, but Hobart (-1.1%), Canberra (+0.8%) and ‘rest of State’ (-0.2%) recording falls.
Advertisement
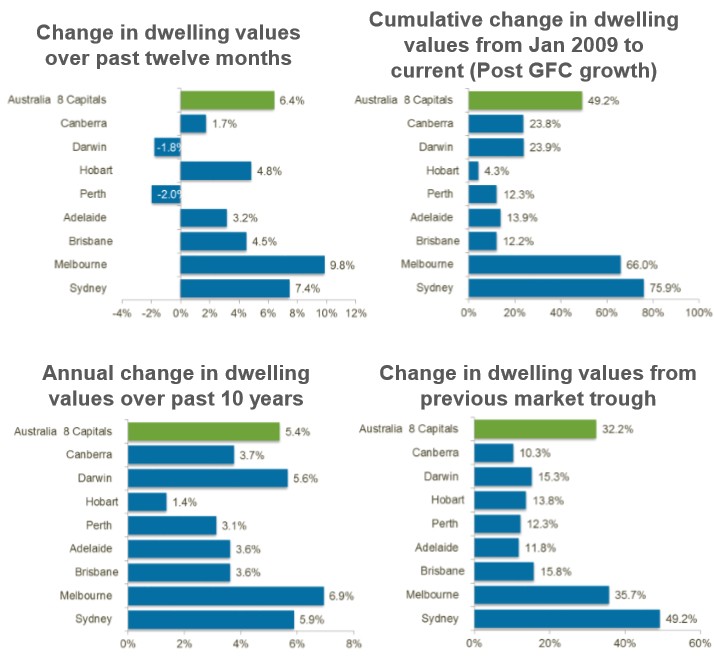
Growth momentum also slowed to its slowest pace in 31 months, with dwelling values rising by 6.4% over the past twelve months across the combined capitals:
According to RP Data’s Tim Lawless:
Advertisement
“The housing market has been losing momentum since July last year, when capital city dwelling values were increasing at the annual rate of 11.1%.”
Perth and Darwin are the only two capital cities where home values are trending lower on an annual basis, down 2.0 per cent and 1.8 per cent respectively. However, Mr Lawless noted the moderation in the rate of capital growth in the Sydney market has been the most pronounced, with annual dwelling value growth more than halving to 7.4 per cent per annum, from a high of 18.4 per cent per annum in July last year.
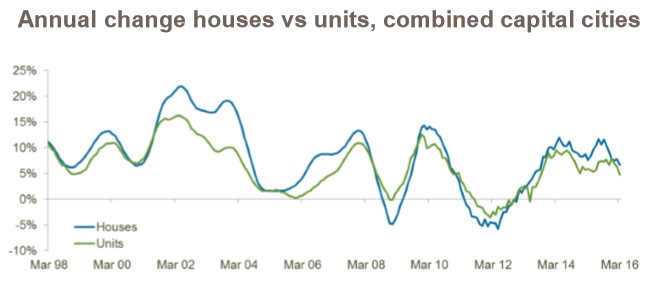
Meanwhile, unit prices are slowing faster due to the explosion of supply:
According to the March results, most capital cities continue to see the detached housing sector outperform the unit market. Over the past twelve months, house values rose by 6.6 per cent compared with a 4.7 per cent increase in unit values.
“The over performance by detached housing relative to units can most likely be attributed to the more efficient release of higher density housing supply together with an ongoing shortage of strategically located vacant land and new detached housing stock,” Mr Lawless said.
The largest performance gap between houses and units is evident in Melbourne, where higher unit supply appears to be weighing on the rate of value growth. Melbourne house values were up 10.7 per cent over the past twelve months, whilst unit values are only 2.5 per cent higher over the past year.
Below are some charts summarising the state-of-play at the state and territory level:
Advertisement
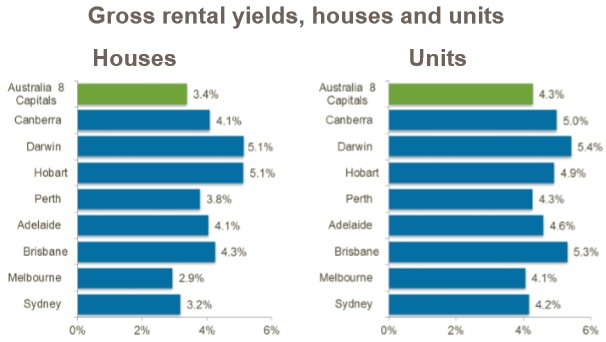
The nation’s rental market remains sluggish, with yields compressing over the past year, particularly in Sydney and Melbourne:
Every capital city has seen a deterioration in the rental yield profile over the past twelve months, with gross rental yields reducing from 3.7 per cent across the combined capitals twelve months ago, to 3.5 per cent at the end of March this year.
Melbourne continues to show the lowest gross rental yields, with houses averaging 2.9 per cent (which is still a record low) and unit yields averaging 4.1 per cent (up from 4.0 per cent).
Mr Lawless said, “A low rental yield scenario in Melbourne and Sydney is likely to act as a further dampener to investment demand in these markets, as the prospects for capital gains become less certain.
“We’re likely to see many investors turn towards other housing markets where the outlook for capital gains is stronger, housing is more affordable and the yield profile is healthier.”
Advertisement
The outlook is for a continued slowing of housing activity:
“Listing numbers have been trending higher, with the number of capital city homes currently being advertised for sale almost 8.5 per cent higher than a year ago”…
“Additionally, housing finance figures are showing a trend towards fewer new mortgage commitments”…
“The lower number of housing finance commitments is also reflected in a slowdown in the number of homes transacting”.
Leith van Onselen is Chief Economist at the MB Fund and MB Super. He is also a co-founder of MacroBusiness.
Leith has previously worked at the Australian Treasury, Victorian Treasury and Goldman Sachs.