
As summarised earlier, the Australian Bureau of Statistics (ABS) today released the national accounts for the December quarter, which registered a 0.6% increase in real GDP over the quarter and a 3.0% rise over the year. The result beat market expectations of 0.4% growth over the quarter and 2.5% growth over the year.
On a per capita basis, real GDP rose by 0.3% and was up by 1.6% over the year. But more importantly for living standards, real national disposable income per capita fell by 0.4% over the quarter and was down 2.3% over the year.
According to the ABS, seasonally adjusted GDP growth for the quarter was driven by household final consumption expenditure, which contributed 0.4 percentage points, and Public gross fixed capital formation, which contributed 0.2 percentage points to GDP growth.
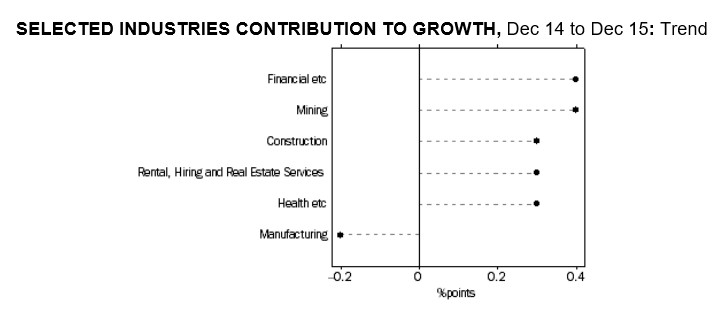
Reflecting Australia’s houses and holes economy, the main contributors to GDP growth over the year in trend terms were Financial and insurance services (+0.4 percentage points), Mining (+0.4 percentage points), Construction (+0.3 percentage points), and Rental Hiring and Real Estate Services (+0.3 percentage points), although Health (+0.3 percentage points) also contributed to growth. Offsetting these growth industries was Manufacturing (-0.2 percentage points).
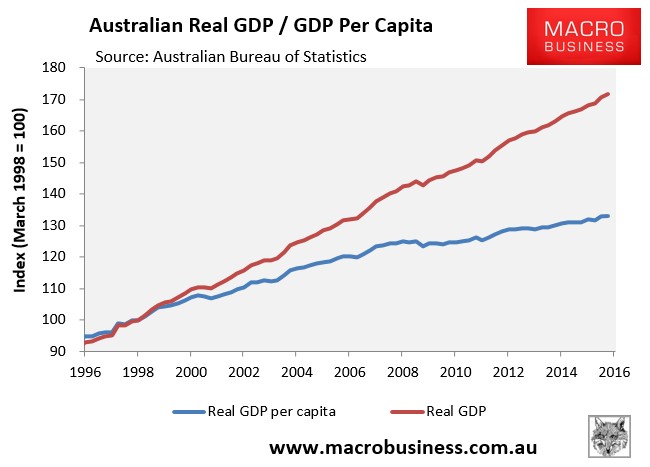
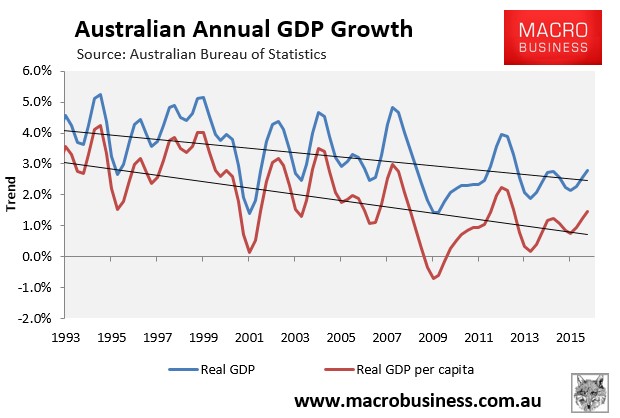
Real GDP per capita rose by 0.3% in the December quarter and was up by only 1.6% over the year. The below charts track real GDP against GDP per capita, and shows that Australia’s still high immigration program is masking our poor underlying growth performance:
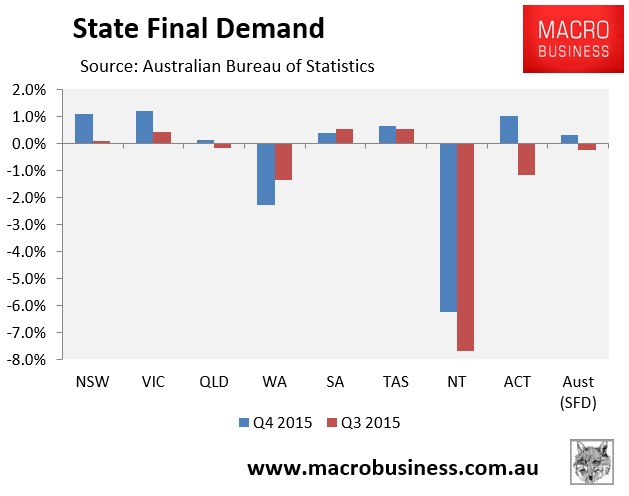
Quarterly final demand, which excludes export volumes, grew by only 0.3% at the national level, led by the housing bubble epicentres of NSW (+1.1%) and VIC (+1.2%). By contrast, final demand was weak in QLD (+0.1%) and was sharply negative in both WA (-2.3%) and the NT (-6.3%):
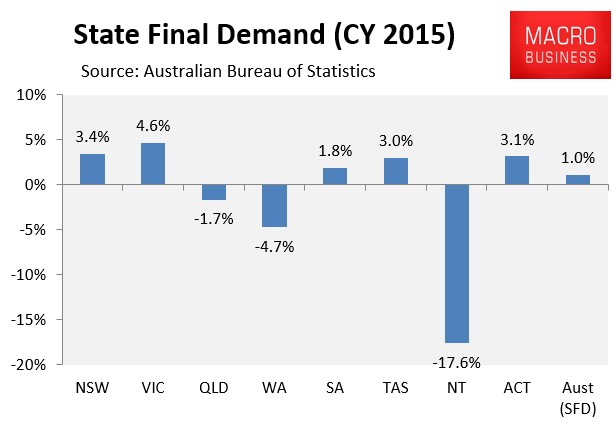
In the 2015 calendar year, final demand was weak (negative in per capita terms), growing by just 1.0% nationally. Again the bubble epicentres of NSW and VIC led the charge, whereas QLD, WA and the NT went backwards:
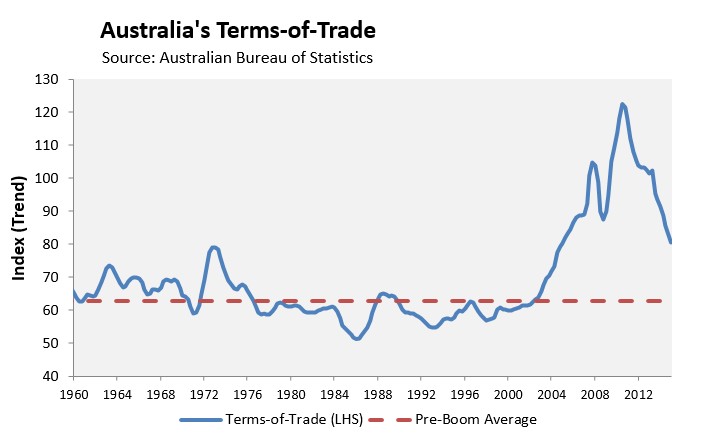
The terms-of-trade fell by a seasonally-adjusted 3.1% over the quarter and by 12.0% over the year, and is now tracking at its lowest level in a decade, with much further still to fall:
And as expected, the falling terms-of-trade dragged-down income growth, with real national disposable income (NDI) down 0.1% over the quarter and by 1.1% for the year.
However, because of population growth, per capita NDI fell by a stronger 0.4% over the quarter and by 2.3% over the year, and will continue to be weak as long as the terms-of-trade unwinds from its current still high level (see next chart).
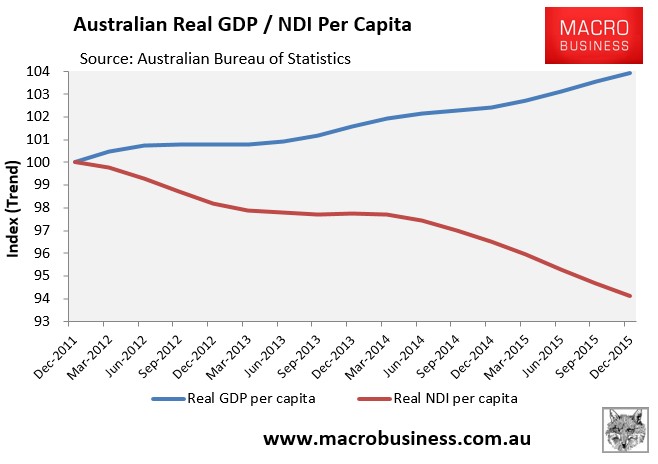
Indeed, the ongoing slump in per capita income – down 5.9% since December 2011 – is the real story of this release, not the meaningless rise in GDP, which does nothing for living standards.
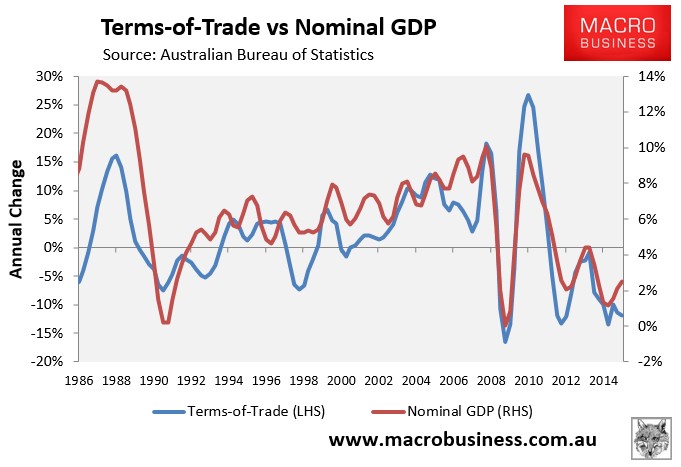
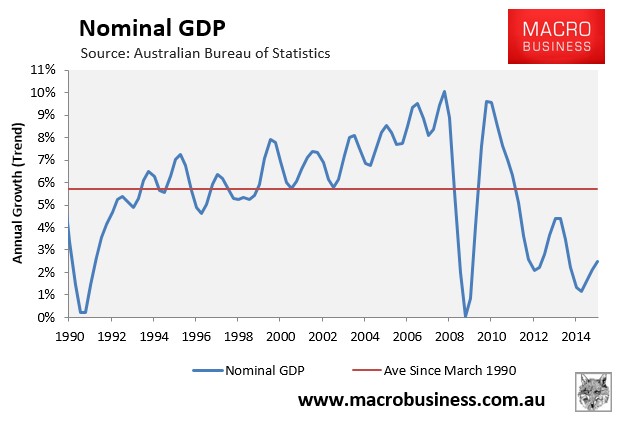
The fall in the terms-of-trade and national disposable income have also helped supress nominal GDP, which rose by only 04.% over the quarter and by 2.4% over the year, and is generally a negative indicator for government finances:
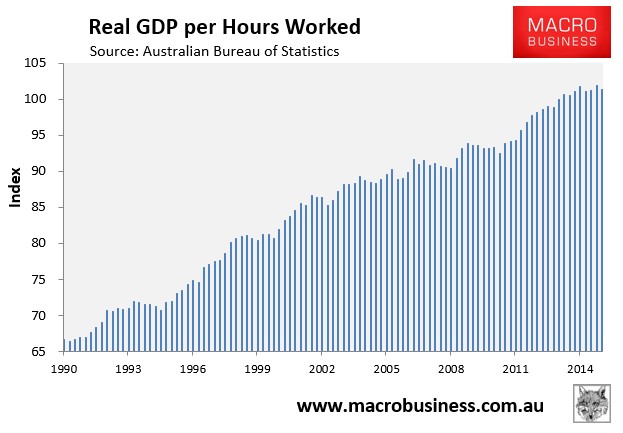
Another negative from this release is that real GDP per hour worked fell by 0.6% in the December quarter and was down by 0.4% over the year, suggesting deteriorating labour productivity:
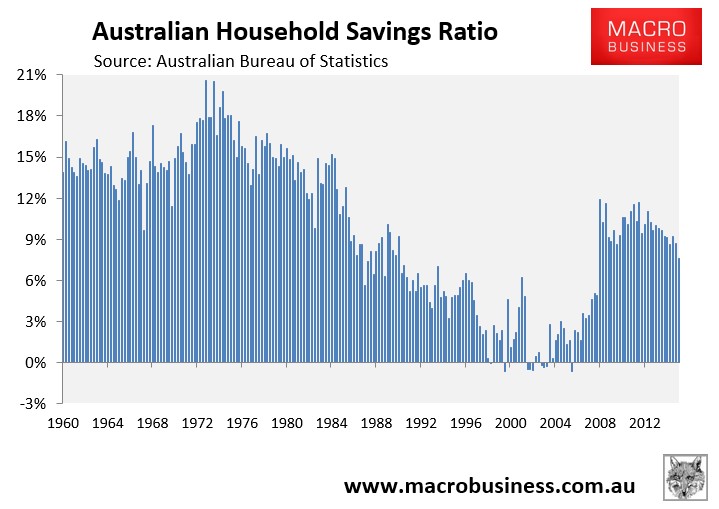
Moreover, the household savings ratio fell sharply to 7.6% from 8.7% in September – the lowest reading since the GFC hit in September 2008:
We should not be surprised by this result given the jump in Australia’s bank offshore borrowing and net foreign debt, which has been used to pump Australia’s record mortgage debt:

Beneath the surface, this is a worrying release.
Headline GDP has clearly been driven by the housing bubble (debt) induced binge in consumption and dwelling construction, which is clearly unsustainable. Meanwhile, national disposable income continues to shrink, domestic demand is poor, and labour productivity has stalled.
The outlook is also poor, with ongoing falls in commodity prices likely to continue dragging down per capita NDI over coming years – a trend that will persist as the terms-of-trade retraces back towards its pre-boom average.
The ongoing weak nominal GDP growth is also a bad sign for Budget revenues, which are already under immense pressure.
What will drive the economy when the bubble in house prices and construction activity inevitably reverses, most likely from the second half of 2016?
