Over much of the past three years, employment has grown at a healthy annual pace of 2½ per cent. This has been faster than we had expected, particularly so, given economic growth was slower than we had expected. Employment growth has also been faster than the working-age population has been growing. As a result, the share of the Australian population employed is around its all-time high, which is a good outcome. Normally, we would have expected this strong employment growth to lead to a decline in the unemployment rate. But the unemployment rate has turned out to be very close to what we had expected and has moved sideways around 5¼ per cent for some time now.
So what is going on here? Strong employment growth but little change in the unemployment rate means that the strength in labour demand has been met by strong growth in labour supply. This increase in labour supply has come from more people joining the labour force and from some of those with jobs putting off leaving the labour force. These trends have been particularly pronounced for females aged between 25 and 54 and older workers of both sexes.
The surprising strength in labour supply has been one of the factors that has contributed to wages growth being slower than we had expected. But at the same time, the lower growth in wages has probably contributed to the strength in employment growth. My undergraduate honours thesis at Adelaide Uni examined the aggregate labour demand curve in Australia which was a much debated topic at the time.[1] So more than 30 years on, I will discuss similar issues today.
I will look at the rise in participation rates of females and older workers and discuss some of the factors that have been contributing to it. I will also look briefly at what jobs have been created. In doing so, I will make use of the micro data in the monthly labour force survey (LFS) as well as micro data from the HILDA survey.[2] That is, we are examining the micro data to understand the macro trends in the labour market.
By and large, the new jobs created over the past few years have been representative of the existing stock of jobs. There have been low wage and high wage, lower skilled and higher skilled jobs created, but about average on both counts. The jobs growth has been in household services jobs such as health care, social assistance and, education, as well as in business services. Two-thirds of the employment growth over the past two years has been in full-time jobs.
Then I will look at wages growth and show that the lower average wage outcomes of the past few years have reflected the increased prevalence of wages growth in the 2s across the economy.
Finally, I will look forward and talk about the RBA’s forecasts for the labour market. Two of the critical influences on that forecast are how much further labour supply will increase and how entrenched are wage outcomes.
Participation
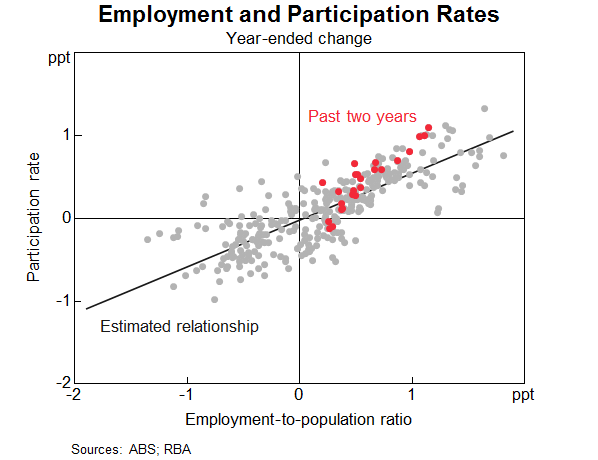
An increase in the number of people in employment can be met either by an increase in people entering from outside the labour market or a decline in unemployment. The increase in people coming from outside the labour force, causing an increase in the participation rate, is known as an ‘encouraged worker’ effect – when economic conditions improve, there is a tendency for people to enter or defer leaving the workforce.[3] Historically more of the increase in employment has translated into a reduction in the unemployment rate than by a rise in the participation rate.
However, the past couple of years have been unusual. The increase in employment has been met disproportionately by an increase in the number of people participating in the labour force (Graph 1). The share of the population participating in the labour force is at a record high. The two main groups contributing to this rise in participation are females and older workers. I will discuss each of these in turn and some of the forces driving the outcomes over both the recent past and from a longer perspective. An understanding of these forces can help us assess how much further these trends are likely to continue.
Graph 1
Female participation
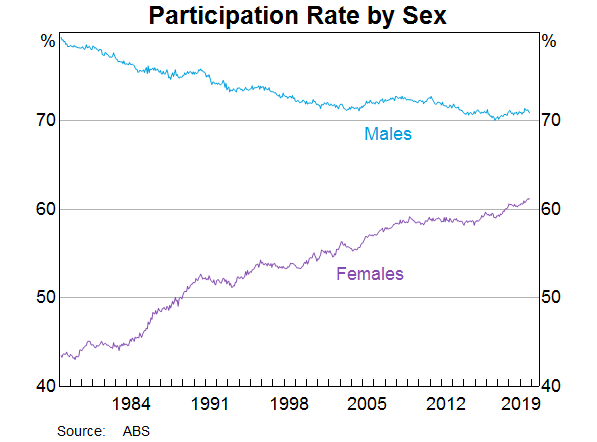
Female employment growth has accounted for two-thirds of employment growth over the past year. The female participation rate is now at its highest rate, and the gap between female and male participation is now the narrowest it has ever been (Graph 2).
Graph 2
The female participation rate has steadily increased over recent decades (from 40 per cent in 1970 to 61 per cent in 2019), and a similar upward trend is evident across other advanced economies. Changing societal norms and rising educational attainment have contributed to more women moving into paid employment or employment outside the home. Female participation has also been influenced by the increasing flexibility of working-time arrangements, the availability and cost of child care and policies such as parental leave.
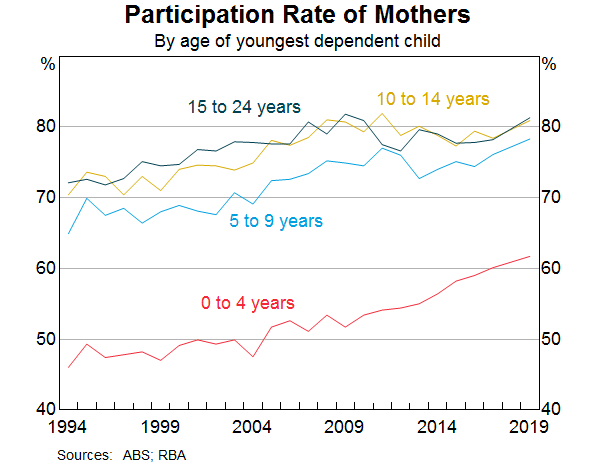
Nearly half of employed females work part time, often to care for children. Over recent decades, the participation rate of mothers with dependent children has trended higher, rising by 10 percentage points since the early 2000s to 73 per cent. Over the past decade, the rise in participation has been most pronounced for mothers with children aged between 0 and 4 (Graph 3). Of those returning to work within two years after the birth of a child, an increasing majority are citing ‘financial reasons’ as their main reason for doing so. Other mothers returning to work cite ‘social interaction’ or to ‘maintain career and skills’ as their main reason. Financial reasons could be capturing a number of different considerations including low income growth, the rise in household debt or child care costs.
Graph 3
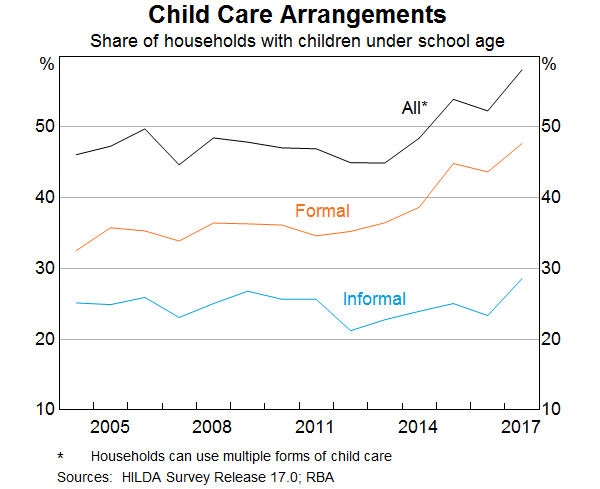
Research suggests the cost and quality of child care does have a significant effect on the labour supply of women.[4] Data from the HILDA survey show that the share of households using formal child care for young children has increased notably over the past decade (Graph 4). However, access to child care places and financial assistance with child care costs remain ‘very important’ incentives for females currently outside the labour force.
Graph 4
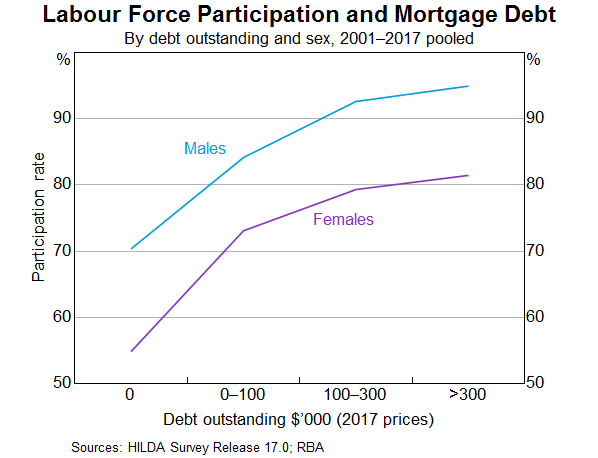
Another factor that is linked to higher rates of female participation over recent decades is the increase in the level of mortgage debt of home owners (Graph 5). The rise in debt levels has broadly coincided with the increase in the participation rate of females. However, it is difficult to establish which way causality is going. Are debt levels higher because more households have two incomes and can afford to borrow more? Or does the need to borrow more to afford housing drive the decision to participate more? Or is it the case that the low level of income growth in recent years has meant that households have more debt than they anticipated and need to work longer to pay it down? Research to establish causality has usually found some evidence of a causal relationship running from higher debt levels to higher participation.[5] However, the analysis indicates that the effects are not that large at an aggregate level.
Graph 5
The rollout of the National Disability Insurance Scheme (NDIS) may also have encouraged increased participation of female carers. We know from a detailed survey of NDIS participants and their families that parents of those with disabilities work fewer hours on average and are more likely to be in casual employment.[6] It is probably too early in the rollout of the scheme to see a material increase in the number of parents re-entering the labour market. The survey suggests there has been a slight increase in the average number of hours worked since the start of the scheme, but the percentage of families/carers of NDIS participants who wanted to work more hours has not changed.
Thus two significant drivers of the increase in participation rates of females aged between 25 and 54 over a long period of time are child care costs and other financial factors. The open question is how much more the participation rate of this group will rise.
Older workers
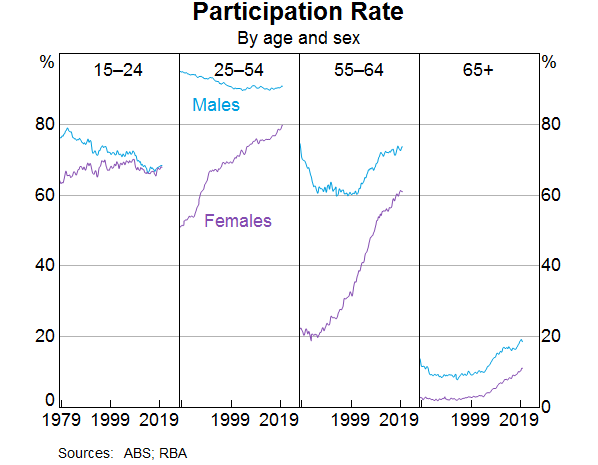
The share of the Australian population aged between 15 and 64 years has continued to decline, and is expected to continue to decline. This is due to the ongoing transition of baby boomers into retirement ages. All else being equal, an ageing population will result in a fall in the supply of labour, since the generation retiring is larger than the generation entering the workforce. But there has been a long-term trend for each cohort to participate more than previous cohorts did at the same age. That trend has accelerated recently, and more than offset the effect of ageing on its own. The share of 55 year olds and older that are employed is 35 per cent, compared to 22 per cent 20 years ago.
This cohort effect is particularly clear in the third panel of Graph 6. The much larger rise in female participation than males over the past two decades is a stark illustration of the effect, as the other drivers of participation in this age group should have similar influences on both male and female participation.
Graph 6
Why are older people working longer?[7] One contributing factor is improved health. People are working longer because they can, both because of their own health and also because the nature of work has changed over the years towards services and away from manual work, which means most people are in less physically demanding jobs.
It used to be the case that many older workers would have to choose between working full time and retiring. From a labour economics point of view, the labour/leisure trade-off has much more choice than it used to.[8] In the past, it was often an all or nothing decision. As the labour market has become more flexible over recent decades, older workers may be able to reduce their hours but still participate in the labour market. Indeed, around one-third of workers aged 55 years and older are working part time, with over half doing so because they prefer to do so. The ABS Retirement and Retirement Intentions survey suggests that of people aged 45 years and older, around one-third of workers intend to cut down from full-time work to part-time work as they get older.
As people live longer, they may want to work longer voluntarily, depending on the value they get from working. But they also may need to work longer to achieve the necessary income to support the standard of living they would like in retirement.
Access to a retirement pension or superannuation is a very significant element in the decision to retire. More than half of all retirees over 60 cite that reaching retirement age or becoming eligible for the pension/superannuation as the main reason they retired from work. The male participation rate begins to decline around age 50 and there is a noticeable change in the rate of decline around 65; the historical pension age for men. For women there is a similar pattern, although in the past there was also a change in the rate of decline around age 60.
Accordingly, announced and actual increases in pension ages are also likely to have contributed to increased participation. This has been documented in the past for females after the government increased the female pension age from 60 to 65 between 1996 and 2013 (in 6 month increments every 2 years).[9]
Currently the pension age is being raised to 67 years for both sexes; a process that began in 2017. The average age of job leavers over the age of 55 has increased slightly in recent years. Our analysis of LFS micro data provides tentative evidence that the 2017 changes to the pension age had an impact on workers’ retirement decisions. The participation rate of those born in 1952 and 1953 (who were affected by the changes in 2017) does not decline as quickly when they turned 65, compared to the earlier cohort groups that were not affected by the pension age increase.[10] In aggregate, this analysis suggests that the pension changes boosted the participation rate by around 0.1 percentage point.
As I said above, some older workers are working for financial reasons. As we all know, one of the major considerations for those contemplating retirement is their wealth and ability to fund their retirement. Increasing house prices and share prices over much of the last decade are likely to have reduced participation of older individuals.[11] The recent decline in house prices may have resulted in some individuals delaying their retirement and not withdrawing their labour supply. However, the price declines were modest compared to the earlier increase, so that those considering retirement would have experienced a net gain in house prices and a decline in their debt.
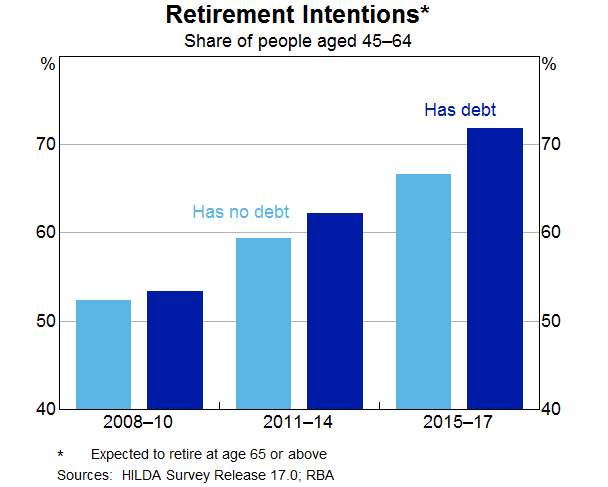
Similar to females, the rise in the participation rate of persons aged 55 years or older is also likely to have been related to developments in household debt. Over recent decades there has been a trend towards greater indebtedness for these persons. The proportion of older households with owner-occupied home loans has risen from around 20 per cent in the early 2000s to around 37 per cent today. The increase in debt has also been associated with a change in the retirement intentions of older workers. Over time, the gradual shift towards later retirement has been more noticeable for those with debt (Graph 7). As with the female participation story, there is a question of causality. Are people working later in life because they have an unexpectedly high level of debt? Or had they always intended to work longer and hence were more willing to borrow more and carry more debt later in life?
Graph 7
To draw this together, participation rates have risen as employment has grown over the past three years. This increase in supply has been unexpected, so it is important to try to understand what is driving it to have some sense on how much further these trends are likely to run. The two major shifts in participation have been amongst females aged 25–54 and older workers. These trends have been there for a while and have been even stronger recently. I have presented some of the insights from our analysis of various micro data sources but there is still more to understand. We will continue to focus on this given its importance to the outlook, which I will come to later.
Employment
What sort of jobs have been created in recent years?
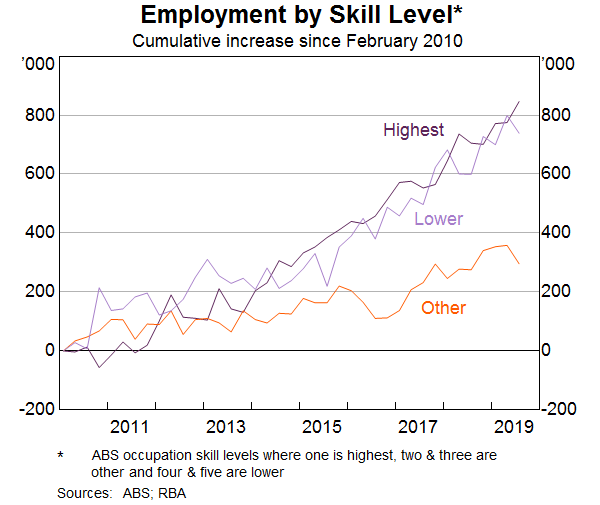
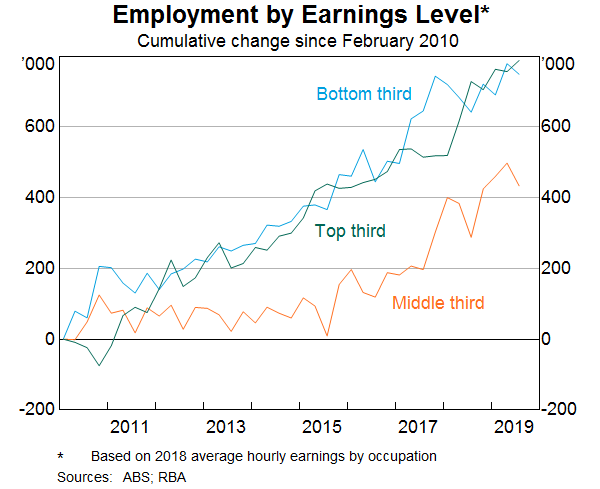
Some have assumed that the jobs that have been created in recent years are lower-skilled or lower-paid jobs. However, when we break down the occupation-level data by skill type or pay level, this is not the case. The strongest growth in employment over the past decade has been in highest-skilled (as defined by the ABS) jobs. There has also been solid growth over the same period in lower-skilled jobs (Graph 8). Similarly, the growth in employment has been broadly distributed across the pay spectrum (Graph 9).
Graph 8
Graph 9
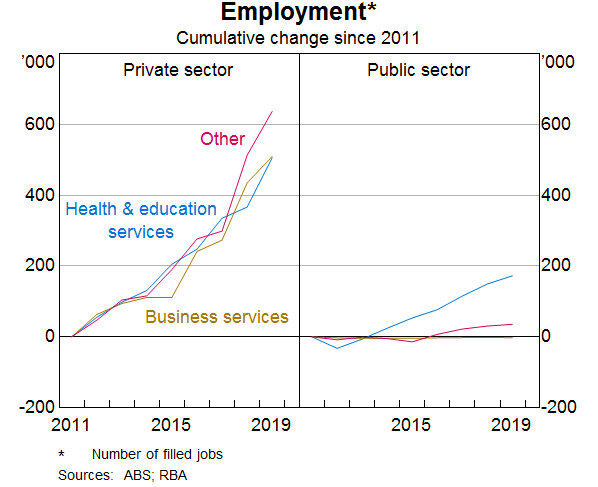
Another often stated view is that much of the job creation in recent years has been in the public sector, rather than the private sector. According to the Labour Account data, the number of jobs created in the private sector has far outnumbered the number of jobs created in the public sector (Graph 10).[12] Private sector job creation has been particularly strong in health care and education (which is partly, but a long way from entirely, due to government spending in these areas), but also in business services and industries like construction and hospitality.
Graph 10
We have also used the micro data to look at the people that have moved into some of these growth areas. For example, the share of employment in the health care & social assistance industry has increased from 9 to 13 per cent over the past decade. Those entering or leaving health care and social assistance tend to do so from a small number of other industries such as public administration, support services, education and training and other services into health care and social assistance. Around 10 per cent of people entering employment from outside the labour market are moving into health care, while a slightly smaller share move into this sector from unemployment. A large share of workers between the age of 55 and 69 years of age work in health care and social assistance, so this is likely to be related to individuals delaying retirement.
Wages
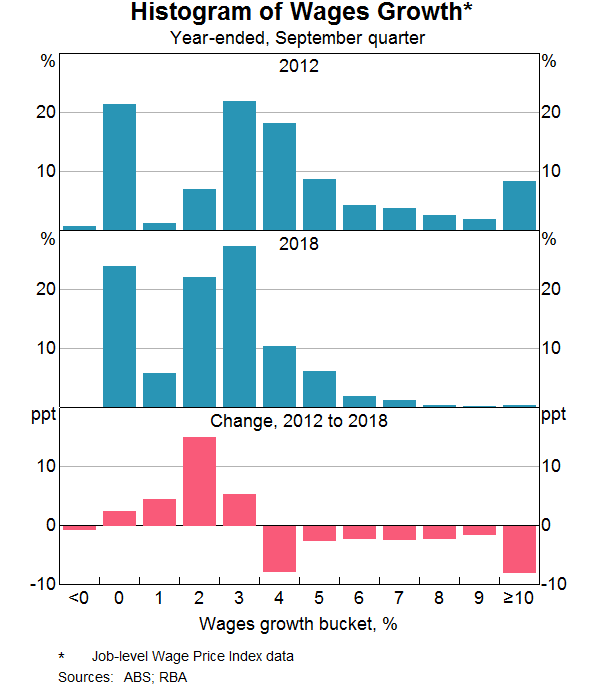
Wages growth has declined noticeably since around 2012. As wages growth has fallen, the distribution of wages growth has also become increasingly compressed. This fall in the dispersion in wages growth across jobs mainly reflects a sharp fall in the share of jobs receiving ‘large’ wage rises. The Bank has highlighted this previously, but I will update that analysis and illustrate the increased pervasiveness of wage outcomes between 2 and 3 per cent across the labour market.[13]
The share of jobs that experience a wage change of more than 4 per cent has fallen from over one-third in the late 2000s to less than 10 per cent of jobs in 2018 (Graph 11). Given that firms are also unwilling or unable to reduce wages, this has meant that the vast majority of wage growth observations in the labour market are now tightly clustered in the range of 0–4 per cent.
Graph 11
There is growing evidence to suggest that wage adjustments of 2 point something per cent have now become the norm in Australia, rather than the 3–4 per cent wage increases that were the norm prior to 2012. The rising prevalence of wage outcomes in the 2s can be seen in the official data and in the Bank’s liaison with firms.
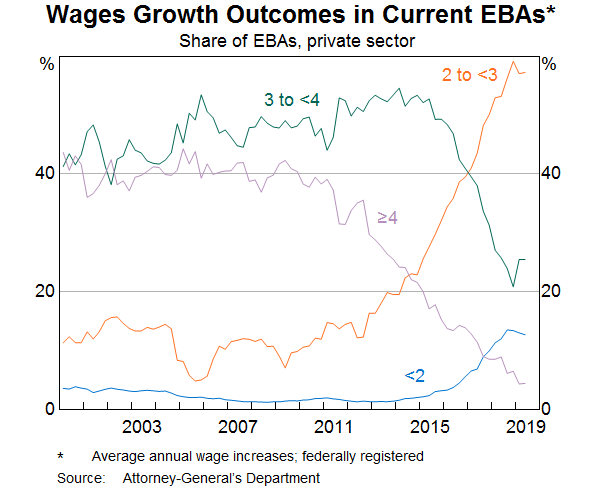
One notable example is the large increase in the share of enterprise bargaining agreements that provide annual wage rises in the 2–3 per cent range. The share of such agreements has risen from around 10 per cent over the 2000s to almost 60 per cent in 2019 (Graph 12). Over the same period, the proportion of agreements providing wage increases of 3 per cent or more has fallen sharply.
Graph 12
A similar picture emerges when we look at the job-level data that underlie the ABS’s wage price index (WPI). These data, which also provide insights on wage outcomes for jobs where pay is set according to individual arrangements, also show that the share of jobs getting wage rises in the 2–3 per cent mark has risen noticeably. The Bank’s liaison with firms also confirms that the share of firms reporting wages growth of between 2 and 3 per cent has increased to around 45 per cent in recent years. Prior to 2012, fewer than one in 10 firms were reporting wages growth in this range.
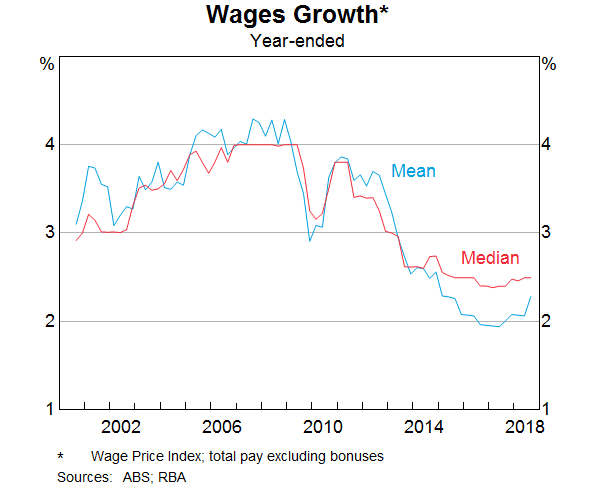
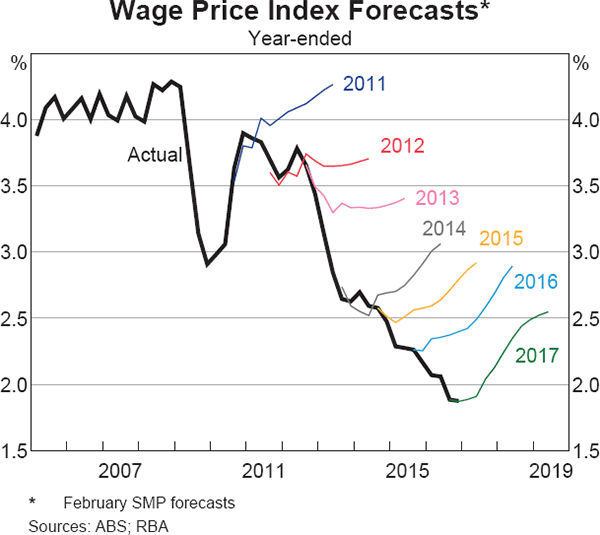
Another way to see this shift in wage setting over time is to look at the median rates of wages growth across all jobs in the labour market (Graph 13). Unlike the mean, the median is less affected by the large decline in ‘large’ wage rises in recent years and the changing prevalence of wage freezes. Prior to 2012, median wages growth was firmly anchored at 4 per cent. In recent years, median wages growth has fallen to 2½ per cent, and has remained at that level.
Graph 13
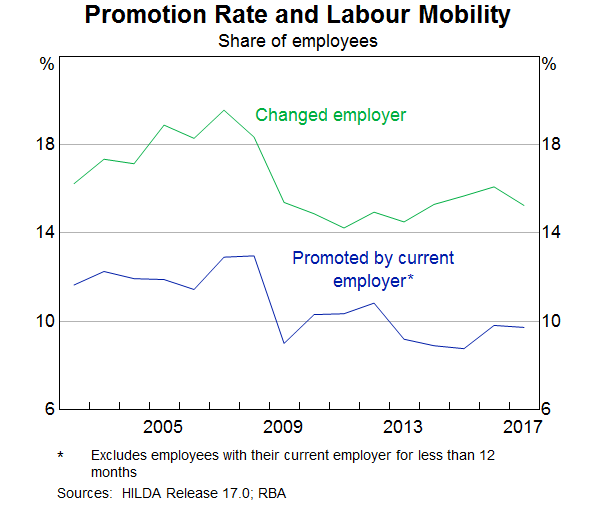
Different measures of wages growth capture slightly different concepts of labour costs. The WPI, which is one of the main measures that the Bank monitors, tracks wage outcomes of individual jobs over time, rather than tracking particular employees.[14] This feature of the WPI makes it useful for gauging developments in wages growth after abstracting from any changes in the nature of work or the composition of employment. However, this feature also means that the WPI does not capture wage rises that come from getting promoted or changing firms.
But other surveys suggest that promotions can be a key source of earnings growth for individuals. On average, a promotion leads to a 5 per cent boost in hourly wages, which is comparable to the wage rise a worker gets when switching firms. Since 2012, there has been a broad-based decline in the proportion of employees that are getting promoted at work or switching jobs (Graph 14). This means that a smaller fraction of the workforce are receiving these wage rises.
Graph 14
Why have wage outcomes in the 2s become so prevalent?[15] One phenomenon that could explain it is the well-known tendency for workers to resist reductions to their wages in real terms.[16] This phenomenon, also known as ‘downward real wage rigidity’, leads to a clumping of employees’ nominal wage changes in the vicinity of their expected rate of inflation, particularly when nominal wages growth is tracking at a low level. In that sense, the RBA’s inflation target of 2–3 per cent on average over time provides a strong nominal anchor in wage negotiations. When my colleagues looked at the job-level WPI data they did find evidence of a clumping of wage outcomes either at, or just above, expected inflation.
While wage increases in the 2s have become very common for many employees, those whose wages are set according to an award have generally been receiving wage increases in excess of 2 per cent in recent years. This reflects the Fair Work Commission adjustments, which have provided support to wages growth at the lower end of the skill distribution, given the prevalence of award-reliant jobs in this part of the labour market. Wages growth for the least-skilled jobs has outpaced all other skill groups since around 2013. This contrasts with the commodity price boom period, when wages growth was strongest for higher-skilled jobs. Consistent with this, the ratio of average hourly earnings of award-reliant employees to those of other employees has risen since 2012, largely reversing the falls seen in the earlier period.
Outlook
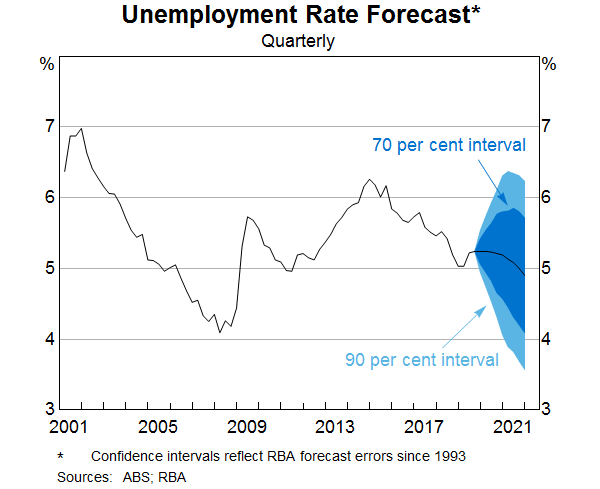
The recent Statement on Monetary Policy provided the Bank’s latest forecasts for the labour market and wages growth. GDP growth is forecast to gradually increase over the next couple of years, which should result in a small decline in the unemployment rate from its current rate of 5¼ per cent. As Graph 15 shows, there is always uncertainty around that central forecast. One of the key sources of uncertainty currently around the outlook for the unemployment rate as well as wages growth, is whether labour supply will be as responsive to labour demand as it has been in recent years. That is, will the expected increase in labour demand encourage as much participation as it has most recently? How much further do some of these drivers of increased participation for older and female workers have to run? That is a difficult question to answer.
Graph 15
The dynamics of participation and unemployment flows will have an important bearing on wages growth as well as household income growth. We expect wages growth to remain largely unchanged at its current level over the next couple of years.
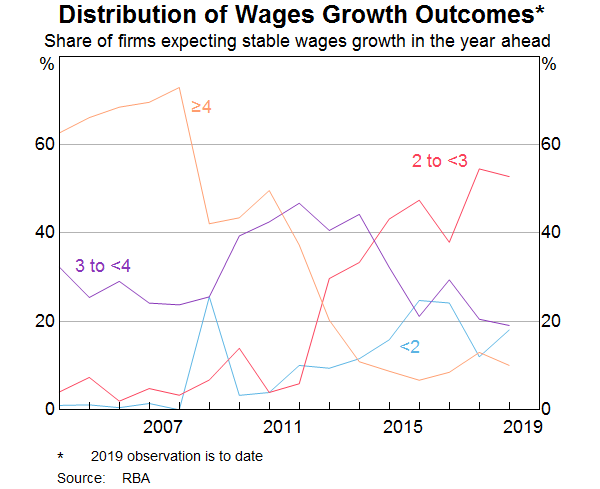
Why don’t we think wages growth will pick up over the next couple of years? What we know from our liaison program is that the proportion of firms expecting stable wages growth in the year ahead is around 80 per cent and only around 10 per cent anticipate stronger wages growth. Of those firms expecting stable wages growth, the share reporting wage growth outcomes of 2–3 per cent has steadily risen over time. This supports the case that lower wage rises have become the new normal (Graph 16).
Graph 16
Recently there has been a rise in the proportion of new EBAs with a term of three years or more. The lower wages growth incorporated in those agreements suggests that wages growth of around 2½ per cent for EBA-covered employees will persist for longer than in the past.
The more wages growth is entrenched in the 2s, the more likely it is that a sustained period of labour market tightness will be necessary to move away from that. At the same time, I don’t think there is much risk in the period ahead that aggregate wages growth will move any lower.
Conclusion
Today I have provided an overview of the current state of play in the labour market and the Bank’s expectation about how it might evolve in the period ahead. I have highlighted some of the key forces that have shaped these developments, in particular, the rise in the participation rates of female workers and older workers. The Bank is trying to understand what has been driving these macro developments using some newly available micro data sources. This greater understanding should help inform our outlook for the labour market.
This increase in labour supply has meant that the strong employment outcomes in recent years has not generated the pick-up in wages growth that might otherwise have occurred. At the same time, I have highlighted the increased prevalence of wages growth in the 2s across the economy. A gradual lift in wages growth would be a welcome development for the workforce and the economy. It is also needed for inflation to be sustainably within the 2–3 per cent target range.
The question is, why should we believe a word that the bank says when it clearly has NO IDEA what is driving wages:
How can the bank be taken seriously on wages when it resorts to supposed measurement issues while it won’t even mention the screamingly obvious:
Advertisement
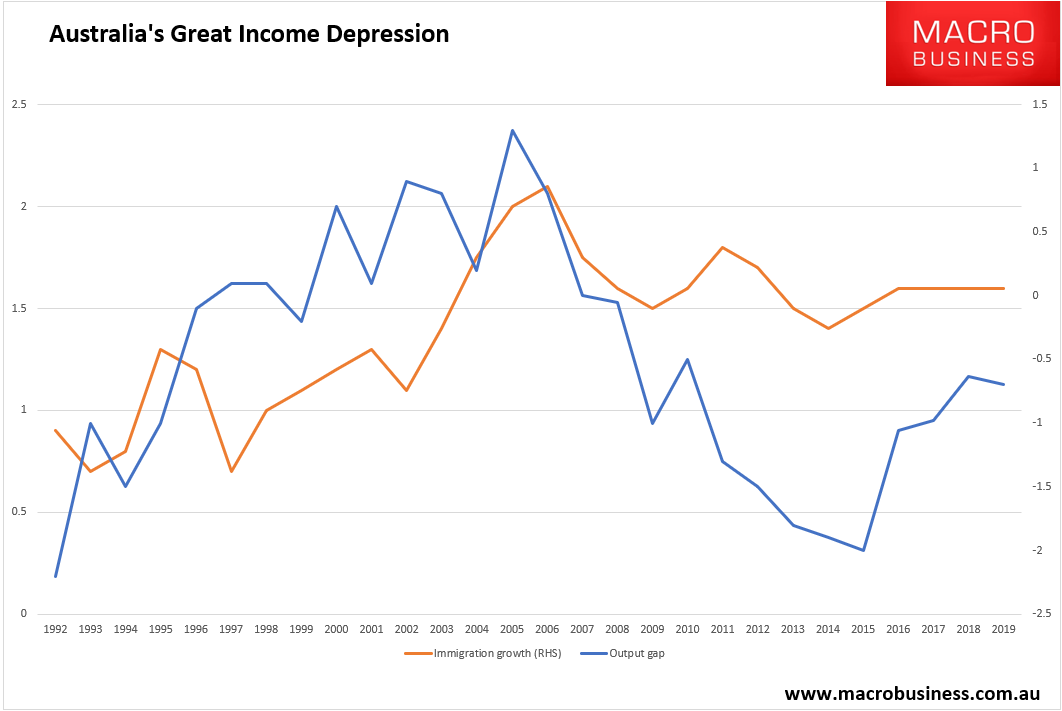
the persistence of the ouput gap this cycle;
the role of mass immigration and temporary visas;
nor the strucutral change to bullshit jobs that has come with both:
As you can see, before 2008, as a nation we always allowed immigration to fall when the output gap appeared, to prevent too much competition in the labour market. But afterwards, we did the opposite and ramped up immigration. Worse, the sources of immigration deteriorated radically from highly paid, skilled workers into desperate and cheap warm bodies from anywhere in the Third World.
Advertisement
Under this macroeconomic regime, any and every time that economic slack appears it will always land on the labour market in the form of weak wages. The rest is history: a permanent income depression for workers as every time the output gap closes, more cheap foreign labour floods in to widen it again, despite the demand that they also bring.
So, what began as an external shock under Labor, which was too idiotic to cut immigration lest it be labelled racist, has since morphed into a worker-devouring Kracken of permanent Coalition policy that today has Australia rivaling Great Depression USA for falling living standards.
Don’t be fooled into thinking that it had to be this way. It didn’t. Although there was always going to be some adjustment after the mining boom as national competitinvess was repaired, the use of mass immigration to hide the correction has ensured that certrain sectors are protected while other suffer more than they should. Households and tradable sectors have born the brunt of the adjustment while property, banking and retail (until recently) were protected. This happened instead of the far better national interest policies of productivity reform, competitiveness reform and crashing one’s own currency.
Advertisement
Alas, the same policy bastardry it is still happening and the income depression is therefore not over. Ahead, the Chinese economy is going to slow to a virtual standstill and the second leg in the falling commosity price story will transpire, denuding the nation of huge slabs of income once again.
With the Coalition determined to pump in cheap foreign labour to support capital, while Labor and the RBA inexplicably cheers it on, that will again direct all of the adjustment onto labor as Australia’s Great Income Depression runs for another lost decade.
So is the micro-economic evidence:
Advertisement
For years we have seen Dominos, Caltex, 7-Eleven, Woolworths and many other fast food franchises busted for rorting migrant labour.
The issue culminated in 2016 when the Senate Education and Employment References Committee released a scathing report entitled A National Disgrace: The Exploitation of Temporary Work Visa Holders, which documented systemic abuses of Australia’s temporary visa system for foreign workers.
Mid 2017, ABC’s 7.30 Report ran a disturbing expose on the modern day slavery occurring across Australia.
Meanwhile, Fair Work Ombudsman (FWO), Natalie James, told Fairfax that people on visas continue to be exploited at an alarming rate, particularly those with limited English-language skills. It was also revealed that foreign workers are involved in more than three-quarters of legal cases initiated by the FWO against unscrupulous employers.
Then The ABC reported that Australia’s horticulture industry is at the centre of yet another migrant slave scandal, according to an Australian Parliamentary Inquiry into the issue.
The same Parliamentary Inquiry was told by an undercover Malaysian journalist that foreign workers in Victoria were “brainwashed” and trapped in debt to keep them on farms.
A UNSW Sydney and UTS survey painted the most damning picture of all, reporting that wages theft is endemic among international students, backpackers and other temporary migrants.
A few months ago, Fair Work warned that most of Western Sydney had become a virtual special economic zone in which two-thirds of businesses were underpaying workers, with the worst offenders being high-migrant areas.
Dr Bob Birrell from the Australian Population Research Institute latest released a report, based on 2016 Census data, revealed that most recently arrived skilled migrants (i.e. arrived between 2011 and 2016) cannot find professional jobs, with only 24% of skilled migrants from Non-English-Speaking-Countries (who comprise 84% of the total skilled migrant intake) employed as professionals as of 2016, compared with 50% of skilled migrants from Main English-Speaking-Countries and 58% of the same aged Australian-born graduates. These results accord with a survey from the Bankwest Curtin Economics Centre, which found that 53% of skilled migrants in Western Australia said they are working in lower skilled jobs than before they arrived, with underemployment also rife.
The Australian Bureau of Statistics (ABS) latest Characteristics of Recent Migrants report, revealed that migrants have generally worse labour market outcomes than the Australian born population, with recent migrants and temporary residents having an unemployment rate of 7.4% versus 5.4% for the Australian born population, and lower labour force participation (69.8%) than the Australian born population (70.2%).
ABC Radio recently highlighted the absurdity of Australia’s ‘skilled’ migration program in which skilled migrants have grown increasingly frustrated at not being able to gain work in Australia despite leaving their homelands to fill so-called ‘skills shortages’. As a result, they are now demanding that taxpayers provide government-sponsored internships to help skilled migrants gain local experience, and a chance to work in their chosen field.
In early 2018 the senate launched the”The operation and effectiveness of the Franchising Code of Conduct” owing in part to systematic abuse of migrant labour.
Then there is new was research from the University of Sydney documenting the complete corruption of the temporary visas system, and arguing that Australia running a “de-facto low-skilled immigration policy” (also discussed here at the ABC).
In late June 2018 the government released new laws to combat modern slavery which, bizarrely, imposed zero punishment for enslaving coolies.
Over the following few months we witnessed widespread visa rorting across cafes and restaurants, including among high end establishments like the Rockpool Group.
Then Alan Fels, head of the Migrant Workers Taskforce, revealed that international students are systematically exploited particularly by bosses of the same ethnicity.
Academic research also supports it. Below are key excepts from Chapter 13 entitled Temporary migrant workers (TMWs), underpayment and predatory business models, written by Iain Campbell:
This chapter argues that the expansion of temporary labour migration is a significant development in Australia and that it has implications for wage stagnation…
Three main facts about their presence in Australia are relevant to the discussion of wage stagnation. First, there are large numbers of TMWs in Australia, currently around 1.2 million persons. Second, those numbers have increased strongly over the past 15 years. Third, when employed, many TMWs are subject to exploitation, including wage payments that fall below — sometimes well below — the minimum levels specified in employment regulation…
One link to slow wages growth, as highlighted by orthodox economics, stems from the simple fact of increased numbers, which add to labour supply and thereby help to moderate wages growth. This chapter argues, however, that the more salient point concerns the way many TMWs are mistreated within the workplace in industry sectors such as food services, horticulture, construction, personal services and cleaning. TMW underpayments, which appear both widespread in these sectors and systemic, offer insights into labour market dynamics that are also relevant to the general problem of slow wages growth…
Official stock data indicate that the visa programmes for international students, temporary skilled workers and working holiday makers have tripled in numbers since the late 1990s… In all, the total number of TMWs in Australia is around 1.2 million persons. If we include New Zealand citizens and permanent residents, who can enter Australia under a special subclass 444 visa, without time limits on their stay and with unrestricted work rights (though without access to most social security payments), then the total is close to 2 million persons… TMWs now make up around 6% of the total Australian workforce…
Decisions by the federal Coalition government under John Howard to introduce easier pathways to permanent residency for temporary visa holders, especially international students and temporary skilled workers, gave a major impetus to TMW visa programmes.
Most international students and temporary skilled workers, together with many working holiday makers, see themselves as involved in a project of ‘staggered’ or ‘multi-step’ migration, whereby they hope to leap from their present status into a more long-term visa status, ideally permanent residency. One result, as temporary migration expands while the permanent stream remains effectively capped, is a lengthening queue of onshore applicants for permanent residency…
Though standard accounts describe Australian immigration as oriented to skilled labour, this characterisation stands at odds with the abundant evidence on expanding temporary migration and the character of TMW jobs. It is true that many TMWs, like their counterparts in the permanent stream, are highly qualified and in this sense skilled. However, the fact that their work is primarily in lower-skilled jobs suggests that it is more accurate, as several scholars point out, to speak of a shift in Australia towards a de facto low-skilled migration programme…
A focus on raw numbers of TMWs may miss the main link to slow wages growth. It is the third point concerning underpayments and predatory business models that seems richest in implications. This point suggests, first and most obviously, added drag on wages growth in sectors where such underpayments and predatory business models have become embedded. If they become more widely practised, underpayments pull down average hourly wages. If a substantial number of firms in a specific labour market intensify strategies of labour cost minimisation by pushing wage rates below the legal floor, it can unleash a dynamic of competition around wage rates that foreshadows wage decline rather than wage growth for employees…
Increases in labour supply allow employers in sectors already oriented to flexible and low-wage employment, such as horticulture and food services, to sustain and extend strategies of labour cost minimisation… The arguments and evidence cited above suggest a spread of predatory business models within low-wage industries.37 They suggest an unfolding process of degradation in these labour markets…
And below are extracts from Chapter 14, entitled Is there a wages crisis facing skilled temporary migrants?, by Joanna Howe:
Advertisement
Scarcely a day goes by without another headline of wage theft involving temporary migrant workers…
In this chapter we explore a largely untold story in relation to temporary migrant workers… it exposes a very real wages crisis facing workers on the Temporary Skill Shortage (TSS) visa (formerly the 457 visa) in Australia. This crisis has been precipitated by the federal government’s decision to freeze the salary floor for temporary skilled migrant workers since 2013… the government has chosen to put downward pressure on real wages for temporary skilled migrants, thereby surreptitiously allowing the TSS visa to be used in lower-paid jobs…
In Australia, these workers are employed via the TSS visa and they must be paid no less than a salary floor. This salary floor is called the Temporary Skilled Migration Income Threshold (TSMIT). TSMIT was introduced in 2009 in response to widespread concerns during the Howard Government years of migrant worker exploitation. This protection was considered important because an independent review found that many 457 visa workers were not receiving wages equivalent to those received by Australian workers…
In effect, TSMIT is intended to act as a proxy for the skill level of a particular occupation. It prevents unscrupulous employers misclassifying an occupation at a higher skill level in order to employ a TSS visa holder at a lower level…
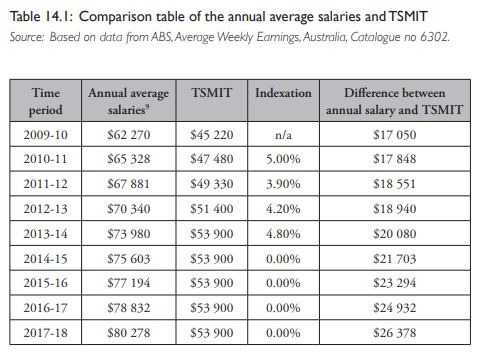
TSMIT’s protective ability is only as strong as the level at which it is set. In its original iteration back in 2009, it was set at A$45 220. This level was determined by reference to average weekly earnings for Australians, with the intention that TSMIT would be pegged to this because the Australian government considered it ‘important that TSMIT keep pace with wage growth across the Australian labour market’. This indexation occurred like clockwork for five years. But since 1 July 2013, TSMIT has been frozen at a level of A$53 900. ..
There is now a gap of more than A$26 000 between the salary floor for temporary skilled migrant workers and annual average salaries for Australian workers. This means that the TSS visa can increasingly be used to employ temporary migrant workers in occupations that attract a far lower salary than that earned by the average Australian worker. This begs the question — is the erosion of TSMIT allowing the TSS visa to morph into a general labour supply visa rather than a visa restricted to filling labour market gaps in skilled, high-wage occupations?..
But why would employers go to all the effort of hiring a temporary migrant worker on a TSS visa over an Australian worker?
Renowned Australian demographer Graeme Hugo observed that employers ‘will always have a “demand” for foreign workers if it results in a lowering of their costs’. The simplistic notion that employers will only go to the trouble and expense of making a TSS visa application when they want to meet a skill shortage skims over a range of motives an employer may have for using the TSS visa. These could be a reluctance to invest in training for existing or prospective staff, or a desire to move towards a deunionised workforce. Additionally, for some employers, there could be a belief that, despite the requirement that TSS visa workers be employed on equivalent terms to locals, it is easier to avoid paying market salary rates and conditions for temporary migrant workers who have been recognised as being in a vulnerable labour market position. A recent example of this is the massive underpayments of chefs and cooks employed by Australia’s largest high-end restaurant business, Rockpool Dining Group, which found that visa holders were being paid at levels just above TSMIT but well below the award when taking into account the amount of overtime being done…
Put simply, temporary demand for migrant workers often creates a permanent need for them in the labour market. Research shows that in industries where employers have turned to temporary migrants en masse, it erodes wages and conditions in these industries over time, making them less attractive to locals…
A national survey of temporary migrant workers found that 24% of 457 visa holders who responded to the survey were paid less than A$18 an hour. Not only are these workers not being paid in according with TSMIT, but they are also receiving less than the minimum wage. A number of cases also expose creative attempts by employers to subvert TSMIT. Given the challenges many temporary migrants face in accessing legal remedies, these cases are likely only scratching the surface in terms of employer non-compliance with TSMIT…
Combined, then, with the problems with enforcement and compliance, it is not hard to conclude that the failure to index TSMIT is contributing to a wages crisis for skilled temporary migrant workers… So the failure to index the salary floor for skilled migrant workers is likely to affect wages growth for these workers, as well as to have broader implications for all workers in the Australian labour market.
It’s not just temporary visas. It is the entire mass immigration model:
students, visa holders, tourists all work for nothing to gain longer terms visas;
their numbers are endless and so is the labour supply shock;
and that endless flow has now generated a supply side adjustment to businesses that thrive on cheap foreign labour – basically service economy dross – that holds up empty calorie growth, boosts asset prices and the currency, holds own productivity via capital shallowing, and hollows out tradables in an era of global lowflation.
Advertisement
The RBA is nothing more than anti-wages propagandist these days, made all the worse by its pretense to be the opposite.
David Llewellyn-Smith is Chief Strategist at the MB Fund and MB Super. David is the founding publisher and editor of MacroBusiness and was the founding publisher and global economy editor of The Diplomat, the Asia Pacific's leading geo-politics and economics portal.
He is also a former gold trader and economic commentator at The Sydney Morning Herald, The Age, the ABC and Business Spectator. He is the co-author of The Great Crash of 2008 with Ross Garnaut and was the editor of the second Garnaut Climate Change Review.