Special report: Light at the end of the mine shaft or oncoming train for Perth housing?
It has been nearly three years since we published a members’ special report on the Perth housing market (see Perth property at the precipice, July 2014). A lot has happened since that time. Mining construction has crashed, property prices have fallen, as have rents. Domestic demand has contracted for a prolonged period, as have wages. And population growth into Perth has slowed to a crawl.
This report revisits the Perth housing market and finds that downside risks still remain, meaning investors risk catching a falling knife and should probably avoid this market for the time being.
Perth dwelling prices have fallen:
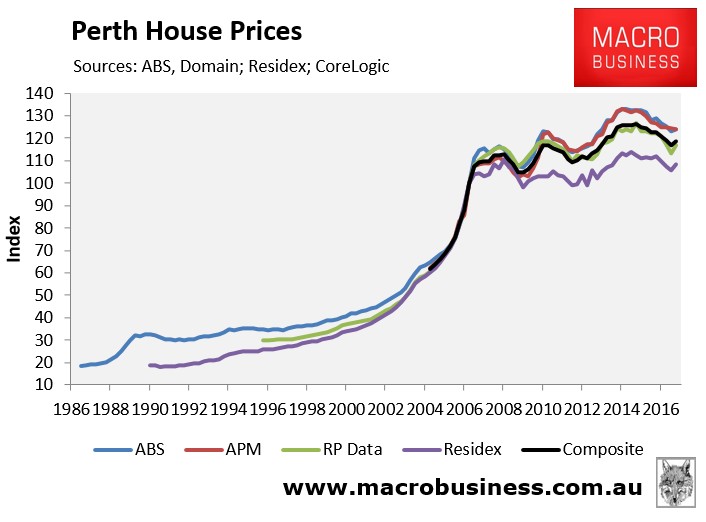
The below charts track detached house and unit prices in Perth, as reported by the four main housing data providers: the Australian Bureau of Statistics (ABS); Domain (formerly APM); CoreLogic; and Residex, as well as a composite measure, which is the average of these indices. The ABS has the longest running house price series for Perth, going back to 1986, whereas APM’s is relatively new. For units, Residex has the oldest series, which dates back to 1990 only.
When averaged-out across the four data providers, Perth house values peaked in December 2014 and had fallen by 6.2% as at December 2016:
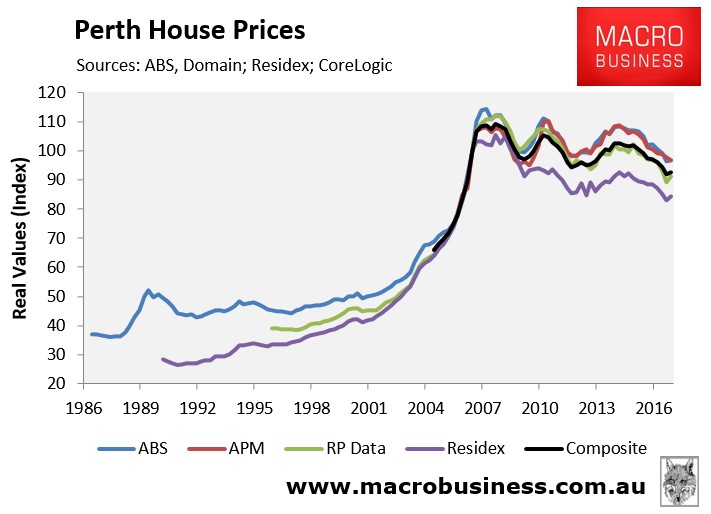
However, when adjusted for inflation, Perth house prices were down 15.3% from their September 2007 peak:
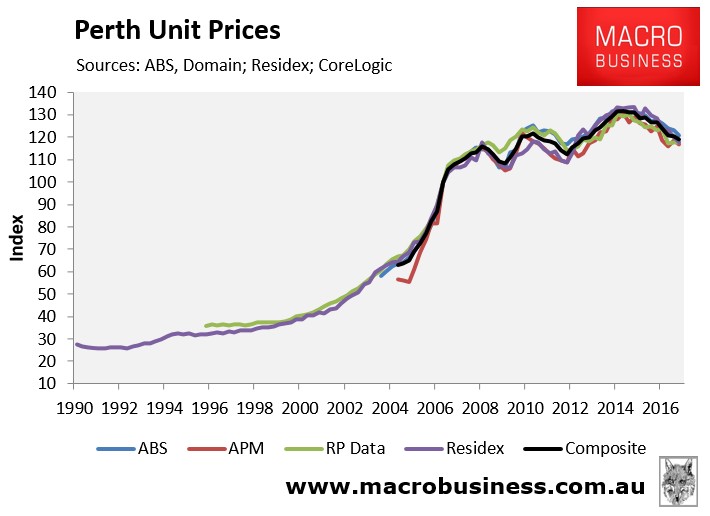
Perth unit prices peaked in June 2014 and had fallen by 9.8% as at December 2016, when averaged-out across the four data providers:
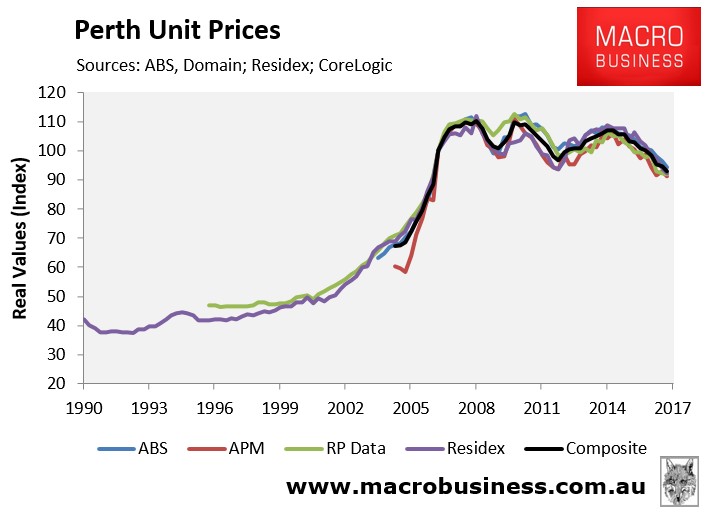
However, when adjusted for inflation, Perth unit prices were down 15.9% from their March 2008 peak as at December 2016:
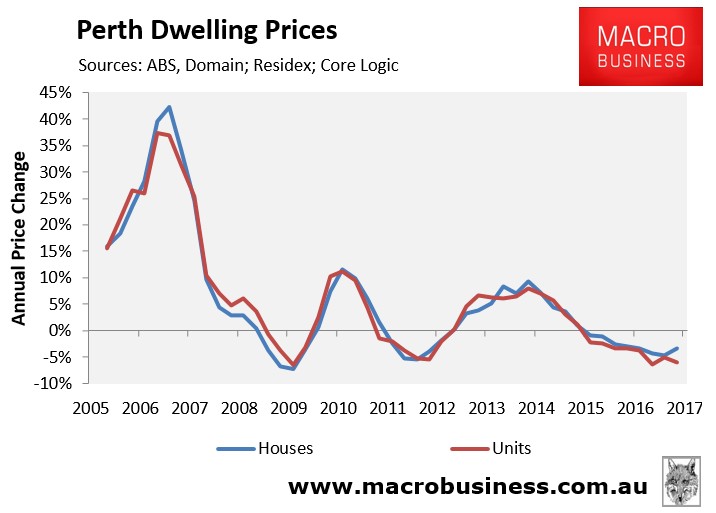
The most recent annual results showed Perth housing growth was stuck in negative, with detached house price growth (-3.4%) traveling better than unit price growth (-6.0%):
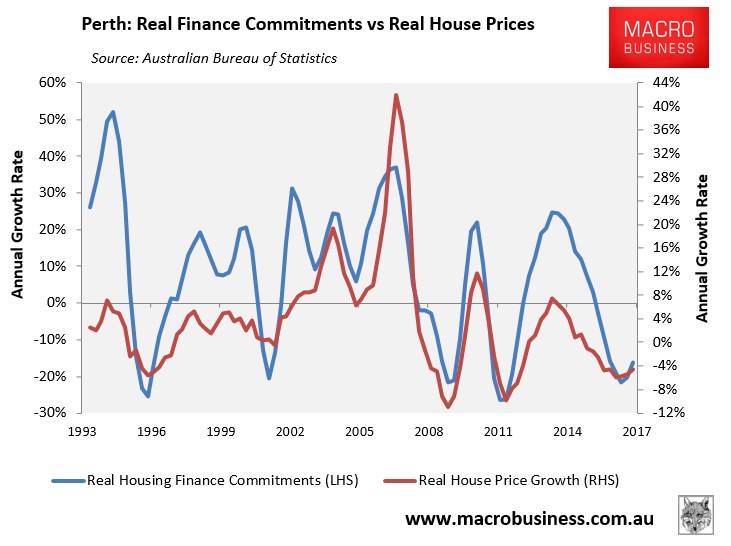
The growth in housing finance commitments has traditionally been a good leading indicator for house prices, albeit less so in recent times. In the second half of 2016, Western Australian finance commitments turned upwards, suggesting Perth house price falls might be moderating:
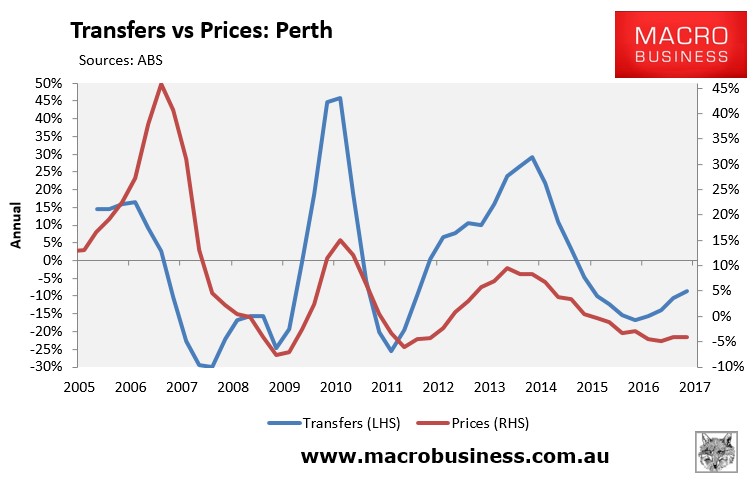
Housing transfers have also traditionally been a reasonably good leading indicator for house price growth. Housing transfers have rebounded in Perth, again giving support to the view that house price falls might be nearing a cyclical bottom:
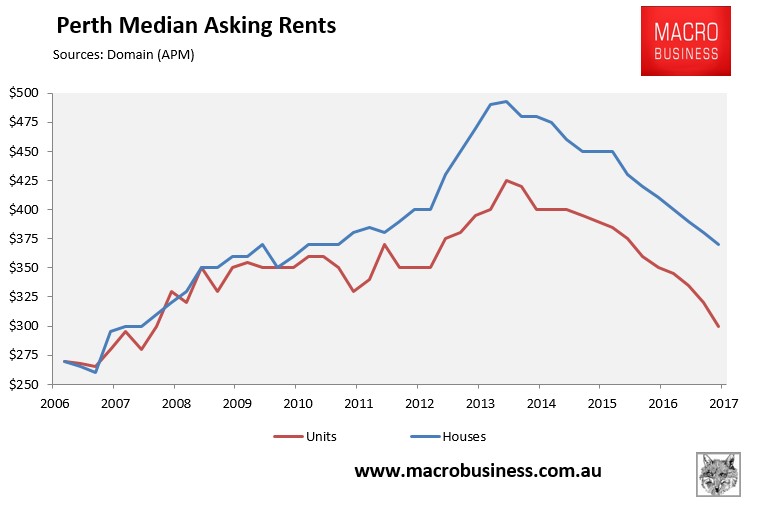
Perth rents have crashed:
Perth’s rental market has suffered even bigger declines than dwelling prices.
After peaking in June 2013, Perth median asking rents have plunged by 25% (houses) and 29% (units), according to Domain:
And because Perth rents have fallen at a brisker rate than dwelling values, rental yields continue to fall; albeit they remain above the national average:
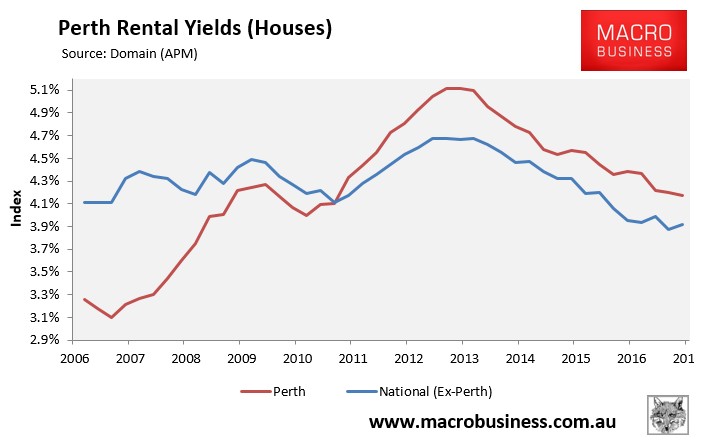
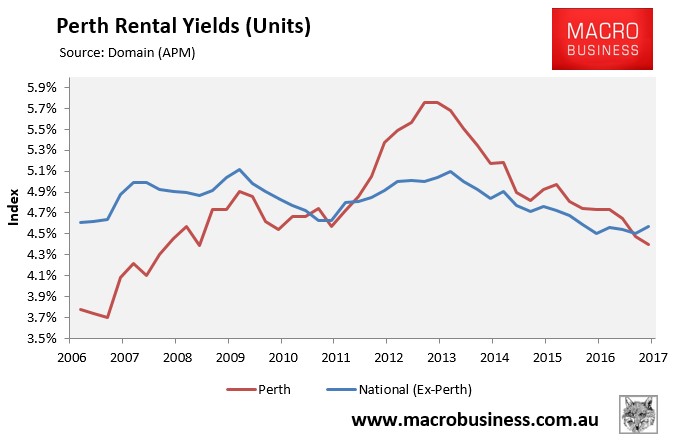
After peaking in late 2012 at 5.1% (houses) and 5.8% (units), Perth rental yields had fallen to 4.2% (houses) and 4.4% (units) as at December 2016.
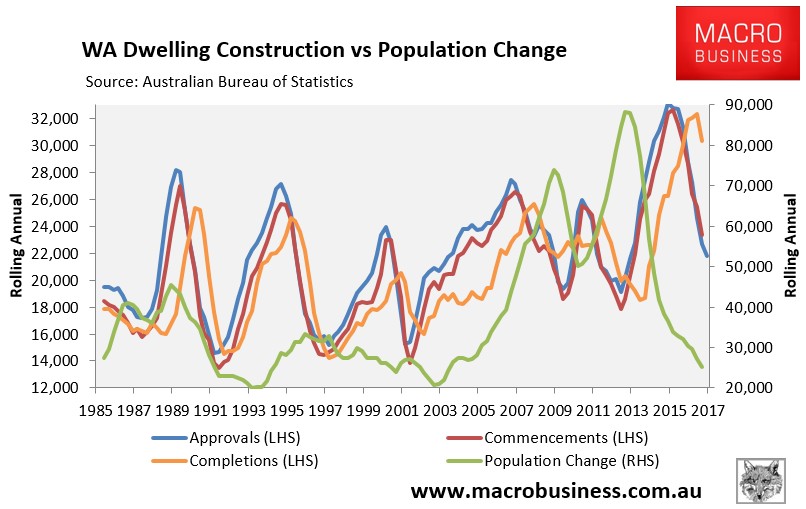
The previous strong growth in Perth house prices and rents had been driven, to a large extent, by strong population growth, which had not been matched by increased housing construction. This situation has clearly reversed over recent years, with population growth crashing just as supply accelerated:
Reflecting these dynamics, Perth’s rental vacancy rate has shifted sharply into oversupply at just under 5% – more than double the rest of the nation:
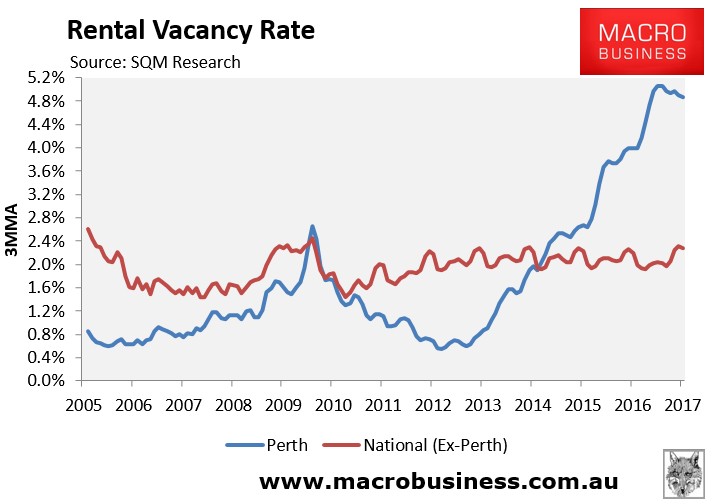
With dwelling supply still easily outpacing population growth, Perth rental vacancies are likely to remain elevated for some time to come, thus continuing to weigh heavily on rental growth.
Perth’s economy to remain under pressure:
Perth’s economy and employment market was, for a long-time, the strongest in the nation due to the once-in-a-century boom in commodity prices and mining-related capital investment.
However, over the past two years, mining investment has crashed, slashing Western Australia’s growth rate, reducing incomes and increasing unemployment:
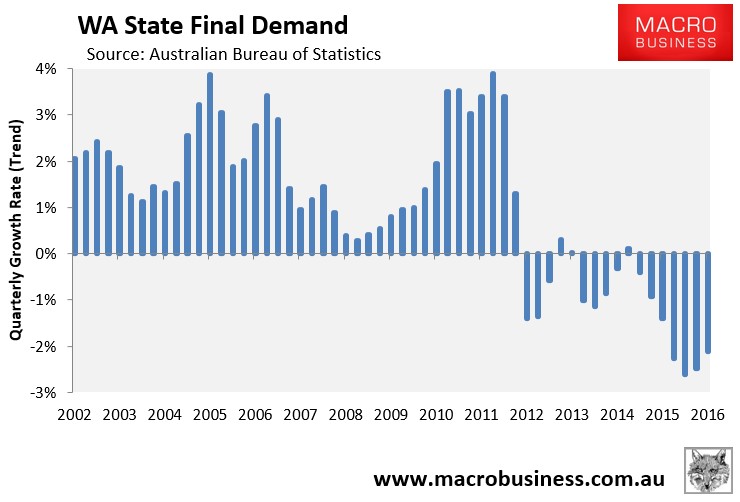
The December quarter national accounts, released in early March, revealed another epic decline in Western Australian final demand, which has fallen for seven consecutive quarters and 14 of the last 17 quarters:
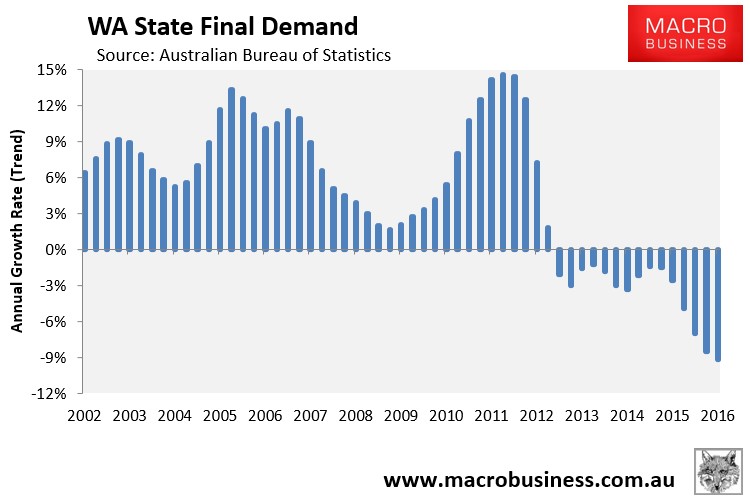
Whereas annual Western Australian final demand fell a whopping 9.2% in the 2016 calendar year:
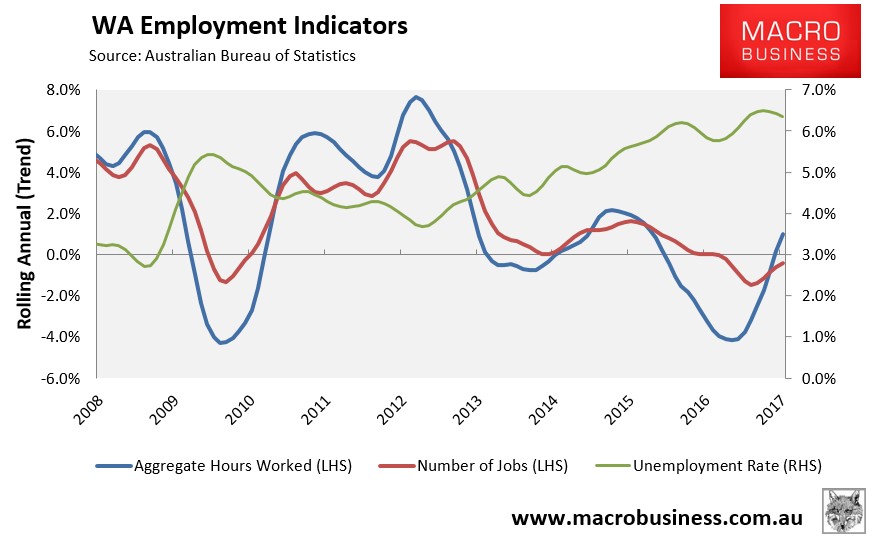
The pain has been felt by Western Australian workers, where annual jobs growth remains negative and unemployment is the second highest in the nation at 6.4%, despite some recent improvement:
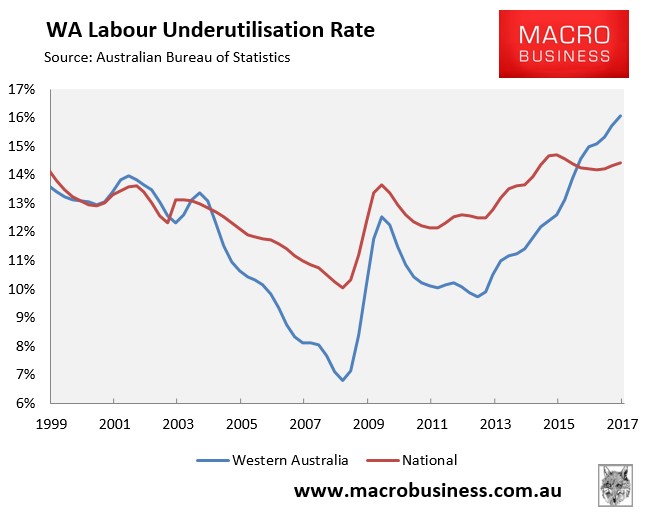
Overall labour underutilisation (i.e. unemployment and underemployment combined) has also surged in Western Australia in recent years and is now the second highest in the nation (behind South Australia) at 16.1%:
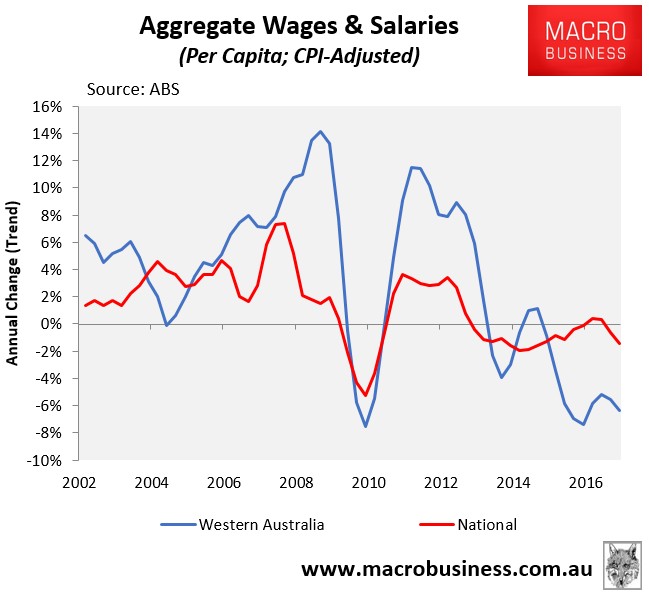
Western Australian workers have also suffered big pay cuts, with real per capita wages and salaries declining by more than 6% in the 2016 calendar year – a far cry from the heady days of the mining boom:
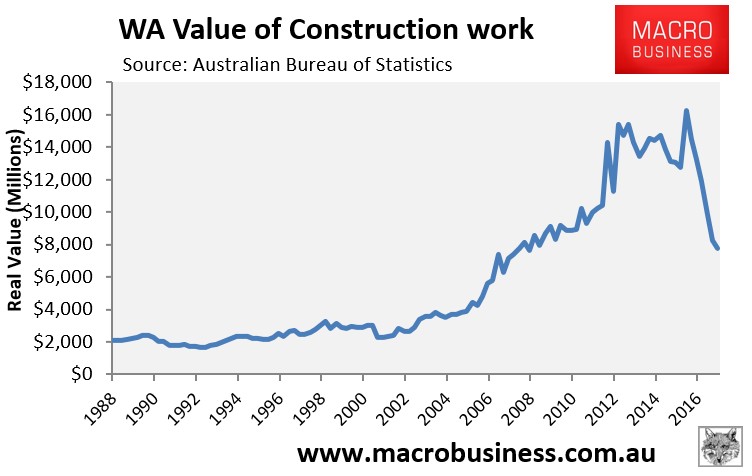
The Western Australian labour market is likely to undergo further adjustment. As shown in the next chart, construction is by far the biggest source of full-time jobs in the state:
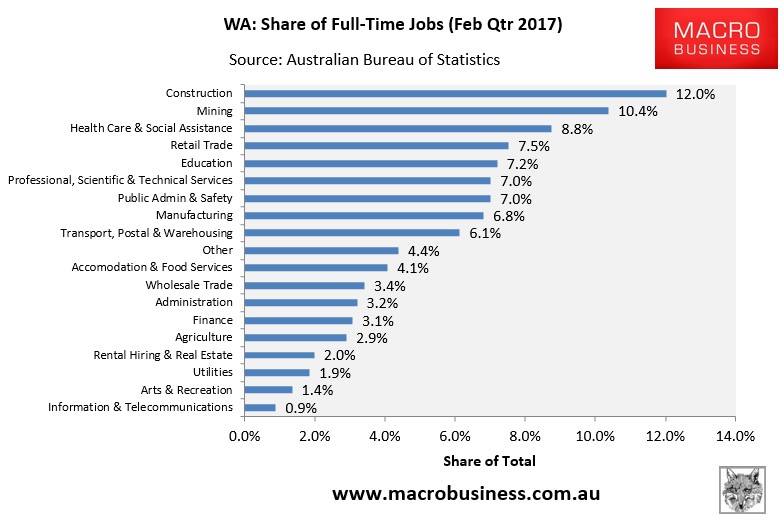
Mining investment in Western Australia is not expected to bottom-out until 2019 as the last of the boom major projects in Roy Hill, Sino and Wheatstone wind down. Meanwhile, the state’s housing construction boom has yet to fully unwind (see chart above), suggesting there are still more job losses to come.
We also believe that the recent rebound in bulk commodity prices was a bear market rally and another bowel-shaking deflation in iron ore and LNG prices lies ahead. Indeed we see prices for iron ore falling into the $20s and only slowly rebounding into the 2020s.
The State Budget, meanwhile, is also under extreme pressure. The cash deficit this year is $5.2 billion, whereas debt is tipped to hit an all-time high $41 billion by 2020. However, these estimates are based on highly favourable assumptions around population growth, consumption spending, dwelling and business investment, and wages growth, thus the actual outcome will likely end up worse.
As the Budget continues to fall short of projections, there is the clear and present danger that the State Government will continue Western Australia’s pro-cyclical policy by cutting into public demand as the economy sinks, thus exacerbating the downside.
How far from the bottom?
As noted in our 2014 report, an examination of the smaller mid-1970s mining boom is instructive to determine the potential impact on the Perth housing market as the mining investment booms fully unwinds.
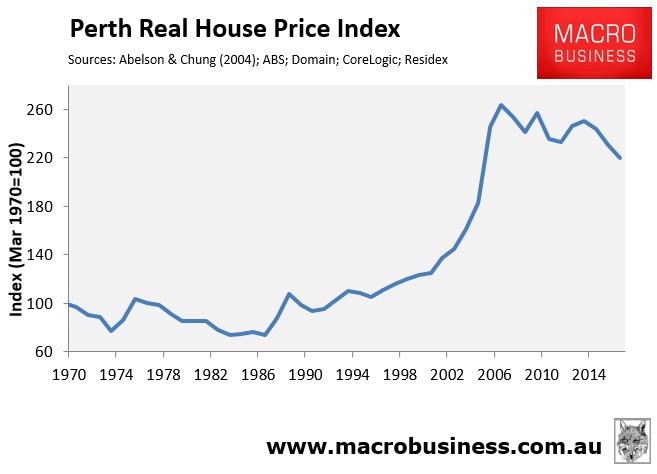
Shortly after Australia’s terms-of-trade peaked in 1974, Perth house prices increased to over 100% of the national average, before declining in a relative sense over the following decade as iron ore prices, and Australia’s terms-of-trade, collapsed:
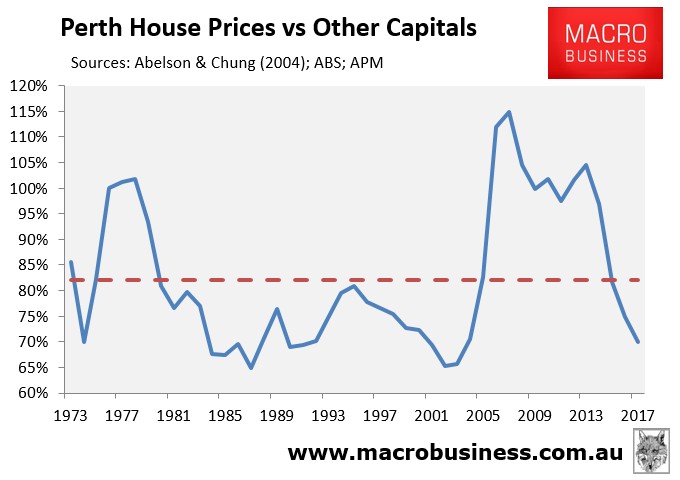
The mining boom this time around was much bigger than that of the mid-1970s, and Perth’s house prices rose to a record 115% of the national average in 2007. Since then, Perth relative and absolute home values have fallen sharply and were sitting at 70% of the national average as at December 2016, which is just above the trough of 65% reached in 1987 and 2002.
It is also worth noting that following the end of the mid-1970s mining boom, Perth house prices declined by nearly 30% in inflation-adjusted terms over an eight year period. To date, Perth house values have declined by 15% from their September 2007 peak (see above), which is a relatively moderate adjustment by comparison.
Given the large volume of supply still to hit the Perth housing market, and that Western Australia’s economy will remain under pressure for the foreseeable future, we think there are still downside risks for Perth house values and rents; albeit the correction my be past half way based on previous experience.
If you live in Perth, have a steady job, and want to purchase for personal reasons, then by all means go ahead – Perth housing is the best value that it has been in a decade.
But if you are seeking to purchase Perth housing as an investment, consider holding-off until it is clear that the economy, dwelling prices and rents have stabilised. Buying as an investment now risks catching a falling knife.
Moreover, regardless of whether you are an owner-occupier or investor, don’t assume there will be much (if any) real capital growth in Perth over the years ahead. After prices peaked in 1976, it took Perth houses another 20 years for values to finally break above that level in real inflation-adjusted terms:
Therefore, Perth housing values could remain soft for an extended period, offering limited upside from an investment perspective.
