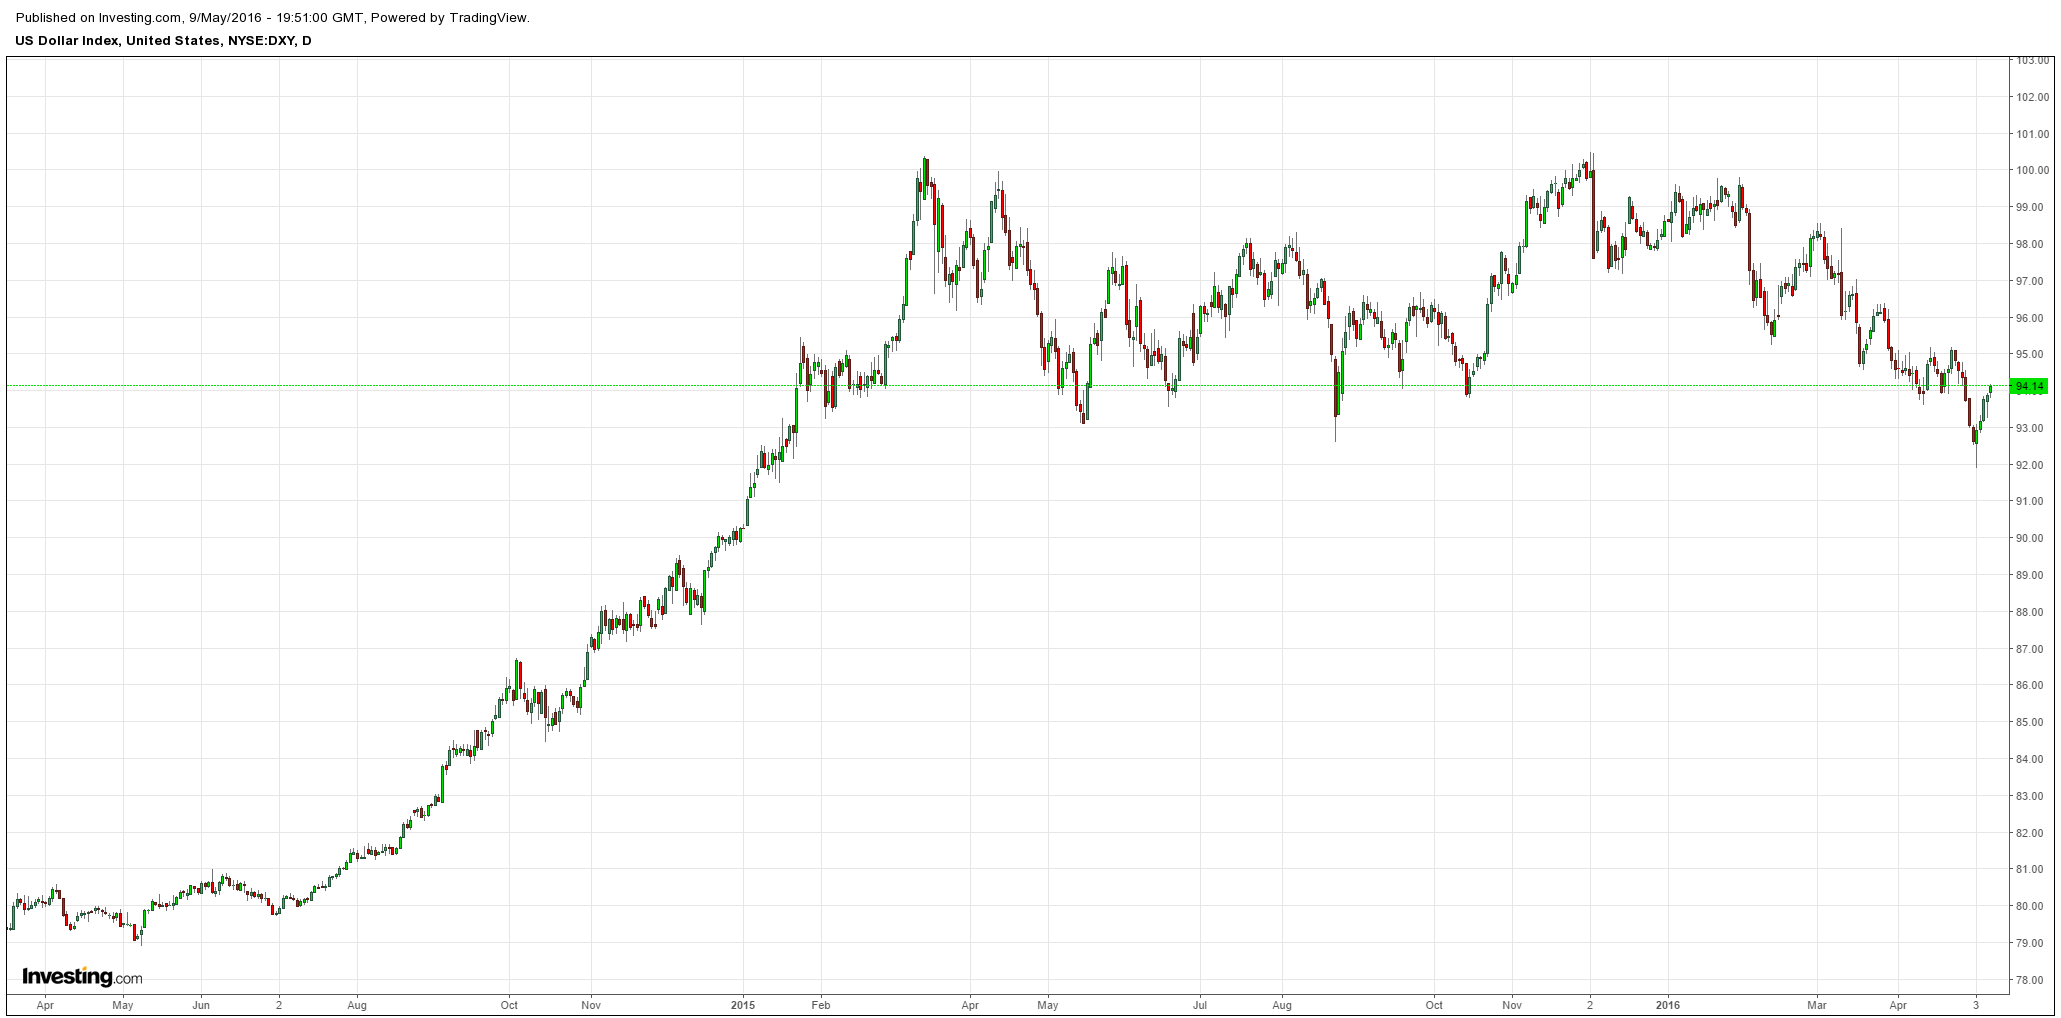
It’s back and it’s angry. The US dollar is galloping along:
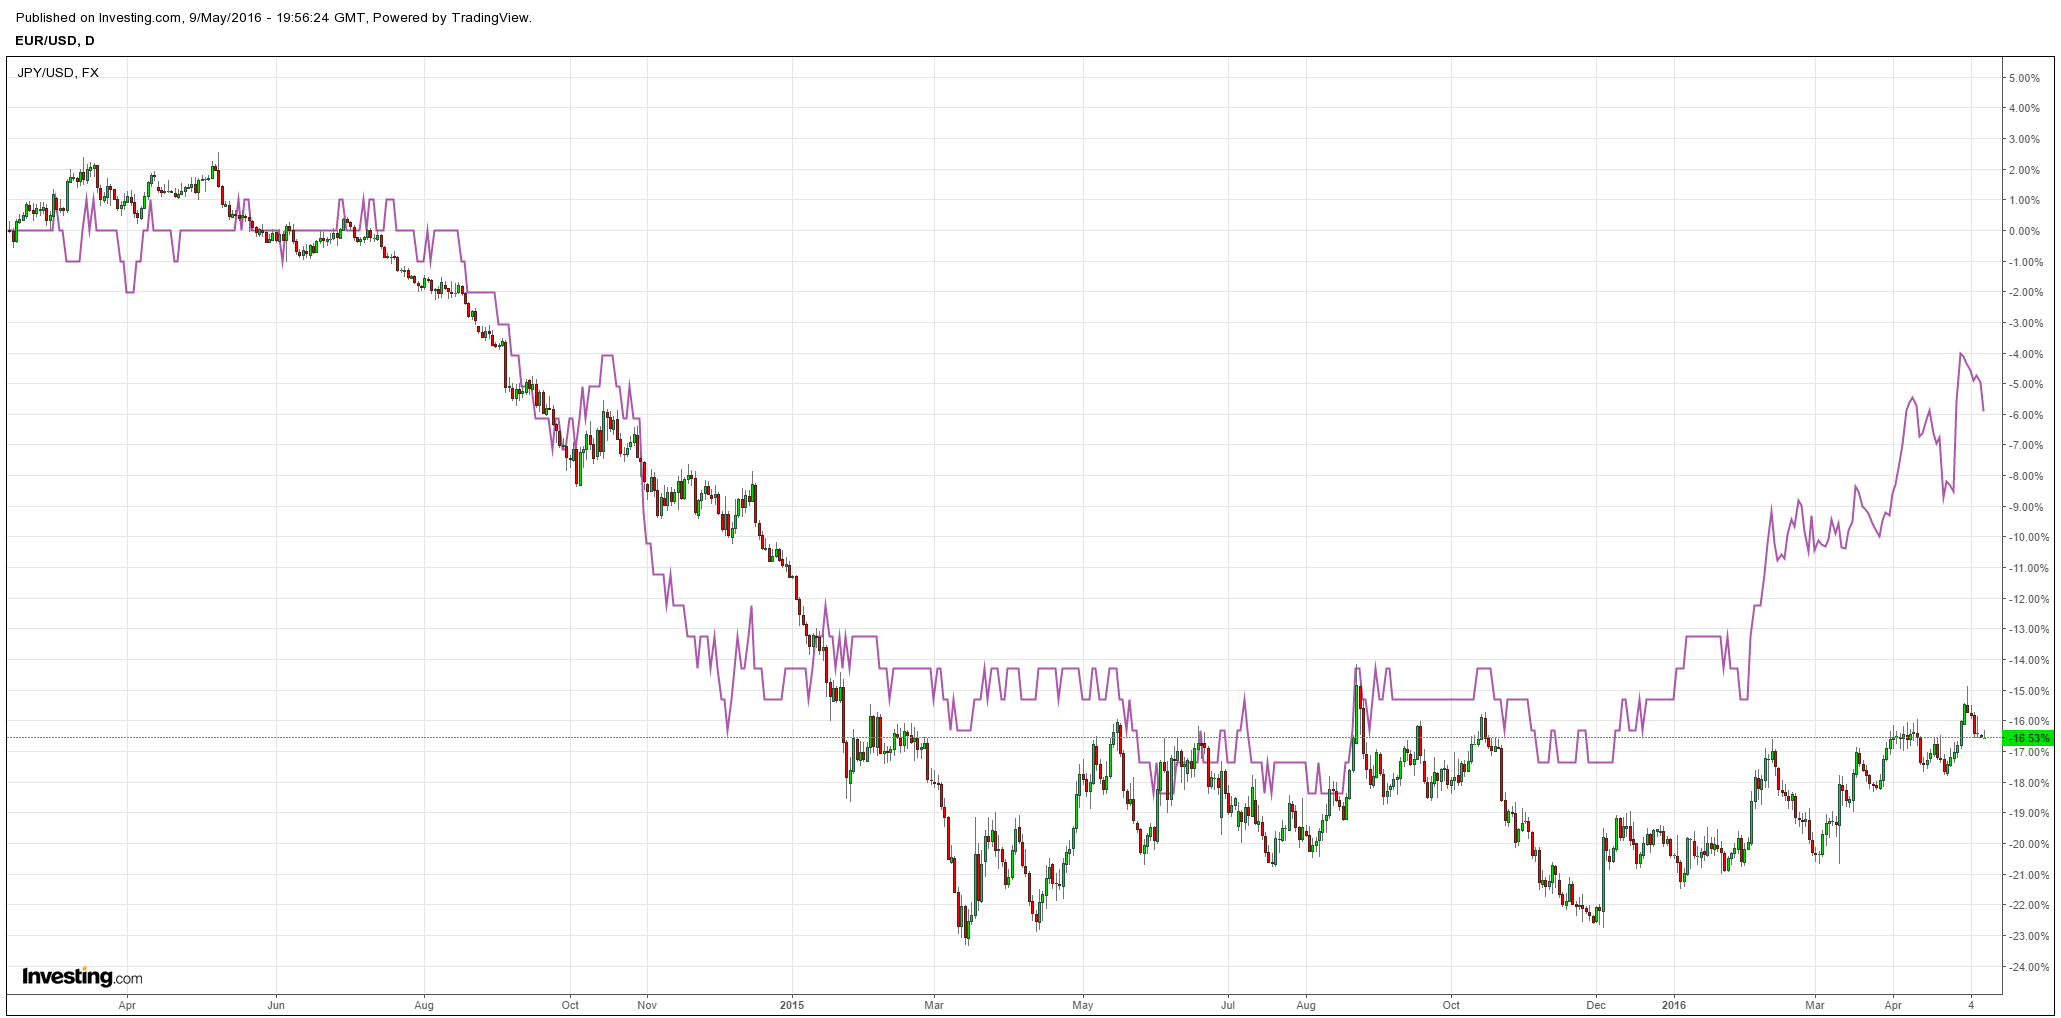
Euro and yen were hit:
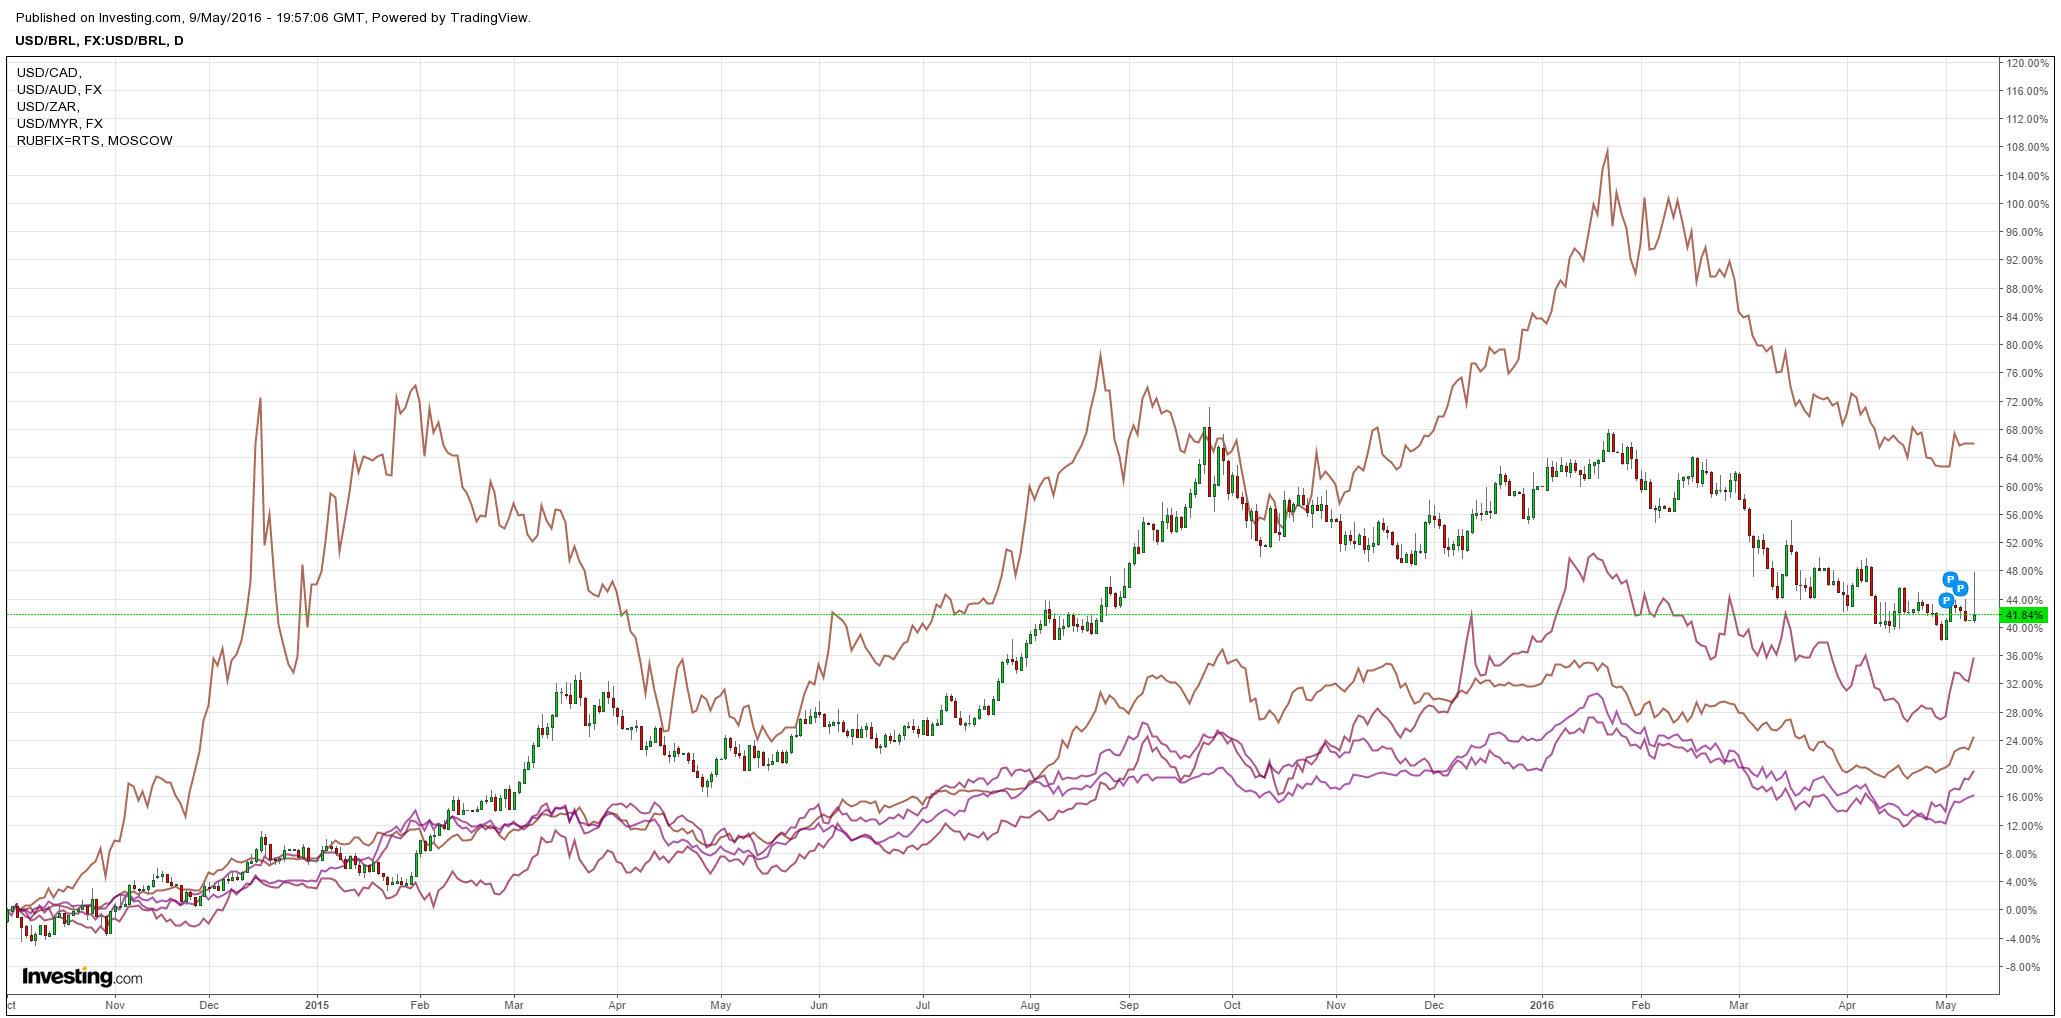
Commodity currencies were thumped none more so than the Aussie dollar:
Advertisement
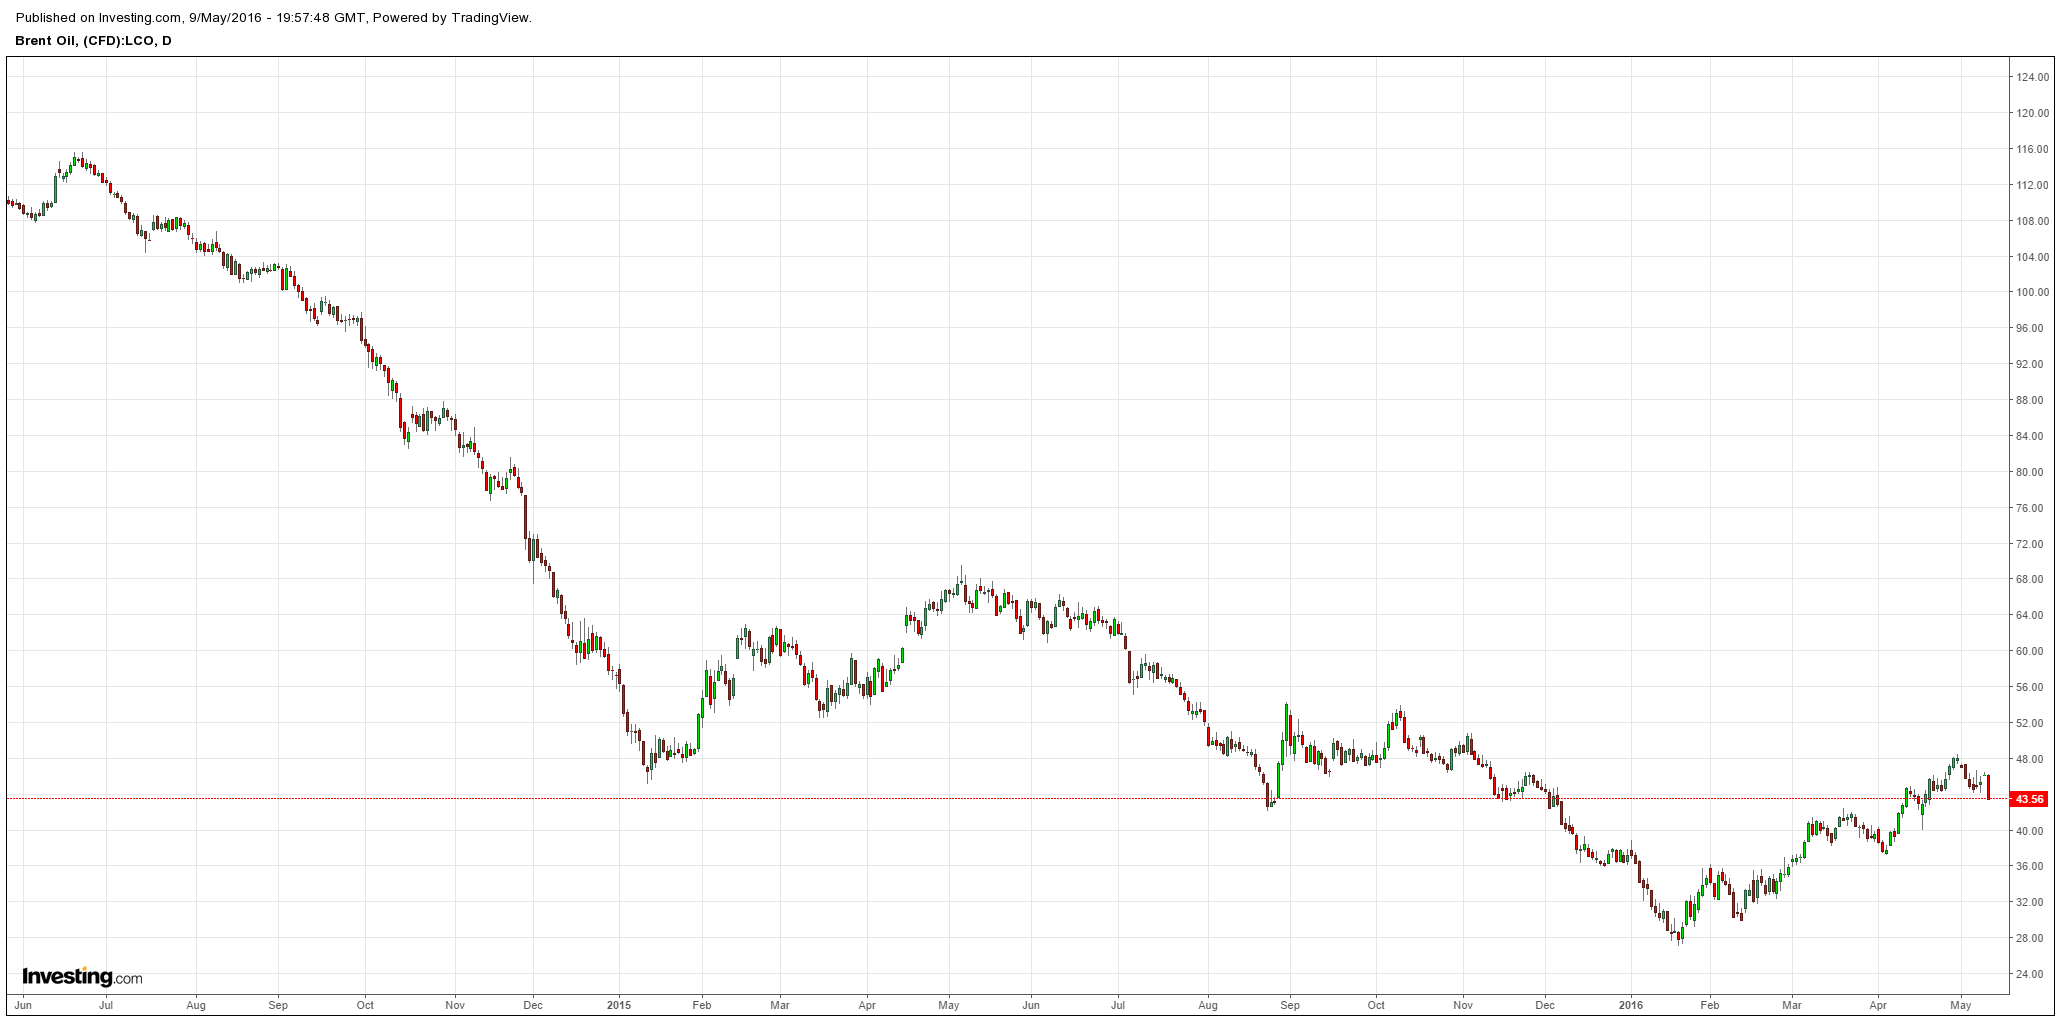
Brent was smashed:
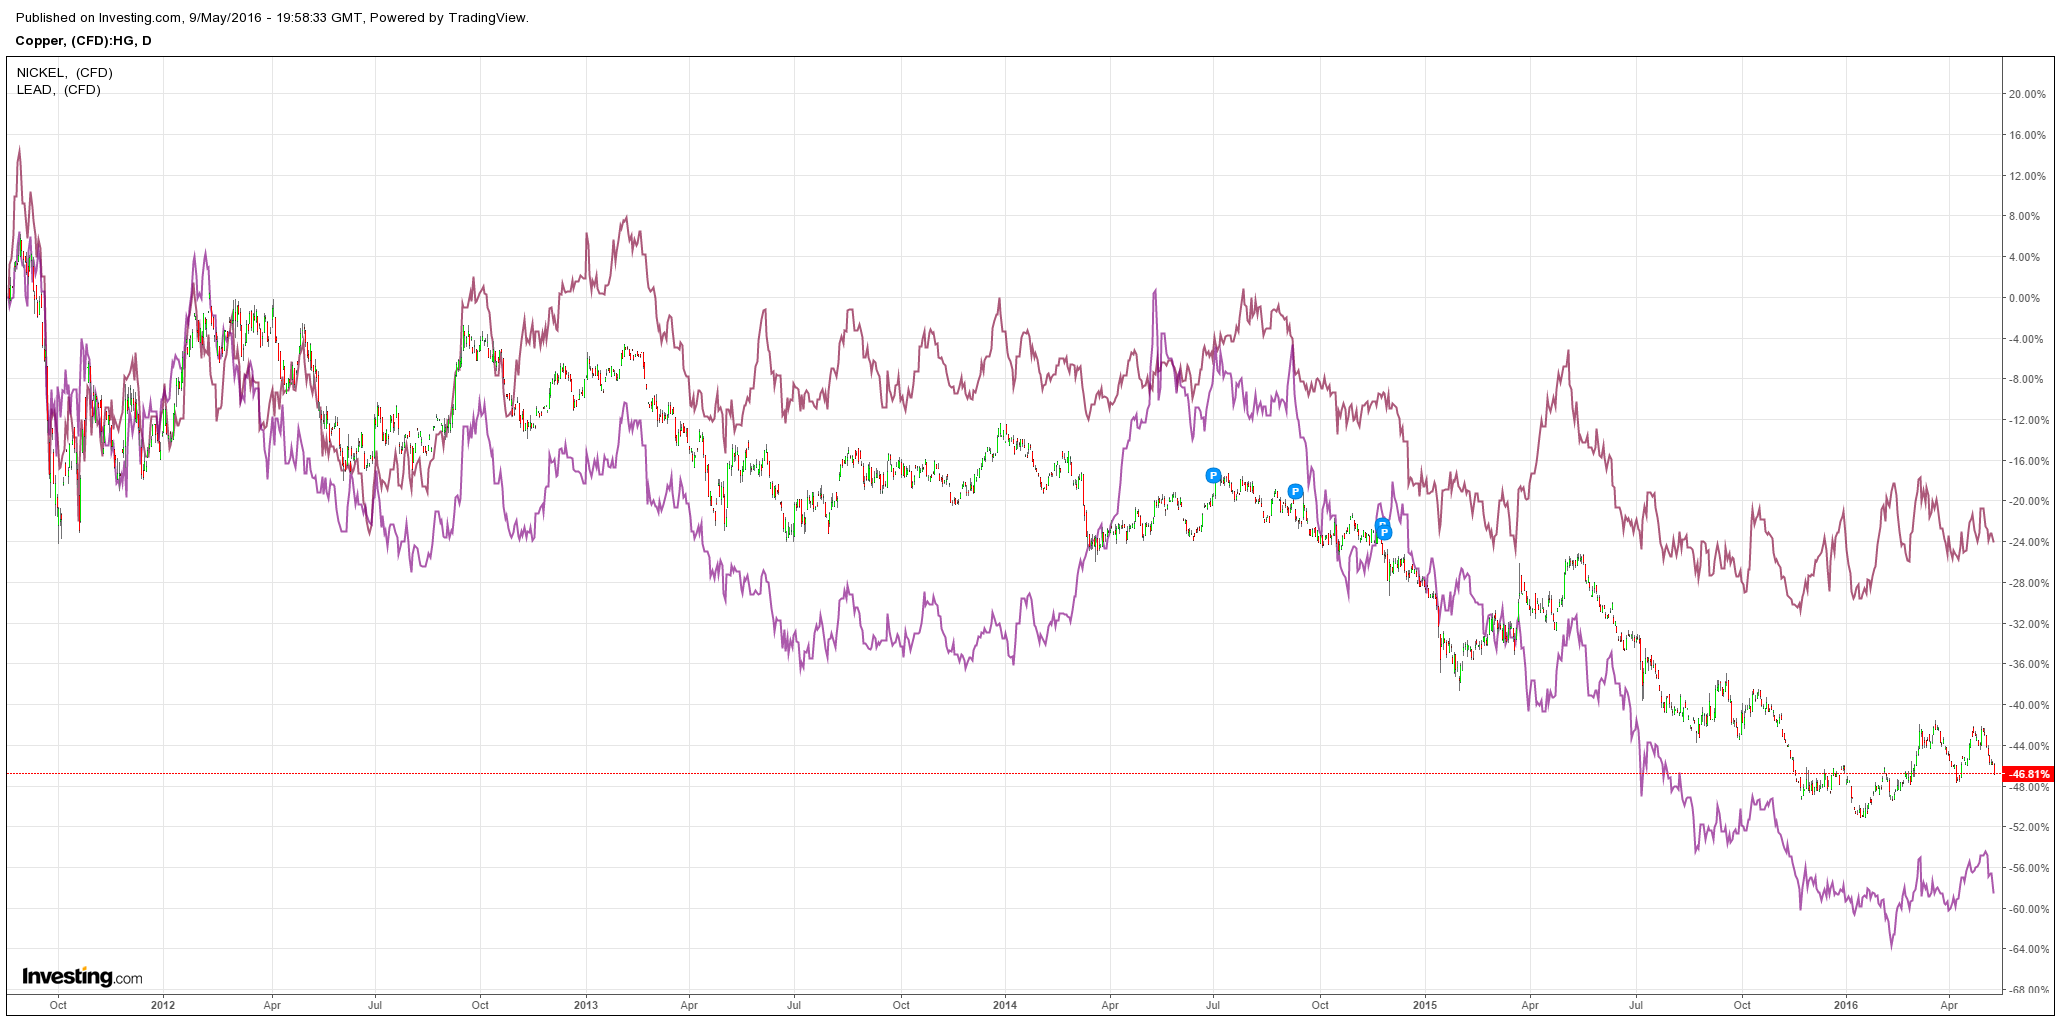
Base metals were hit hard:
Advertisement
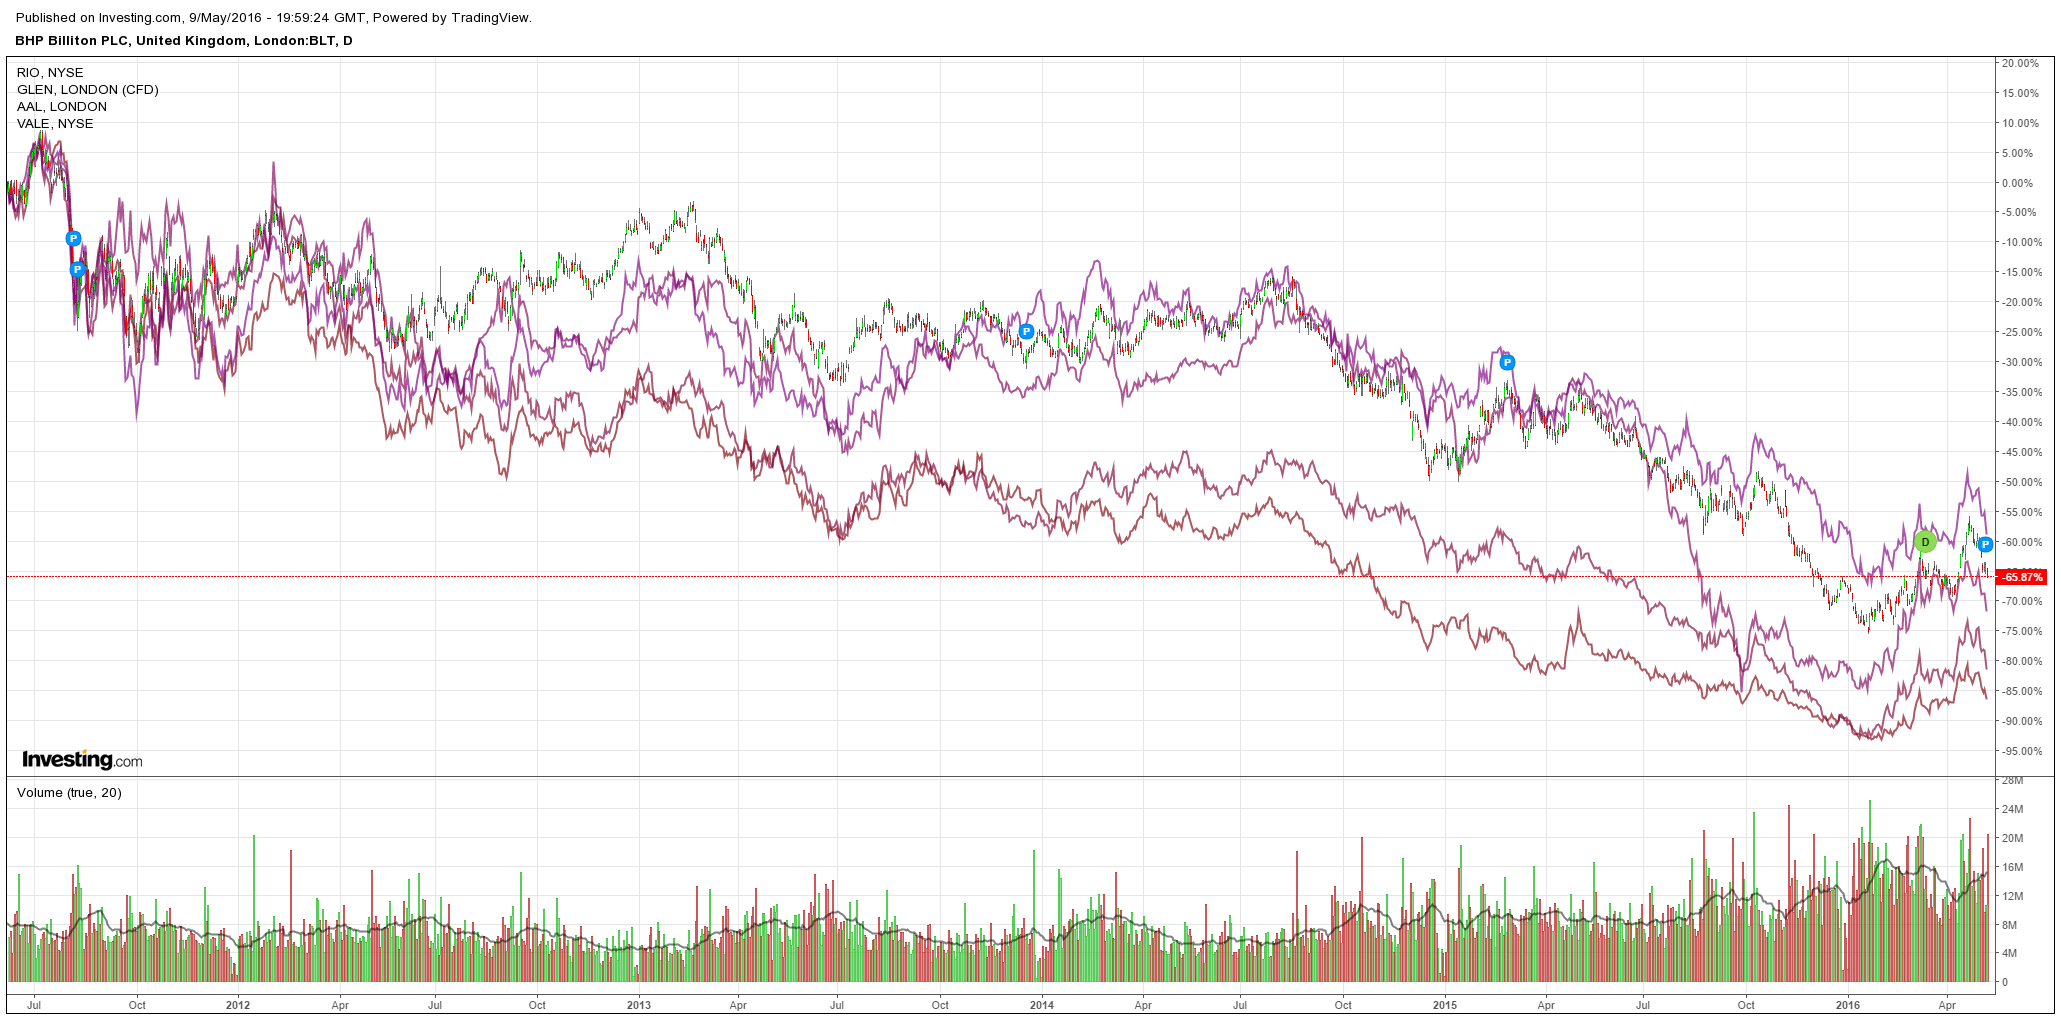
Big miners were pulverised with RIO -8% and BHP -6%:
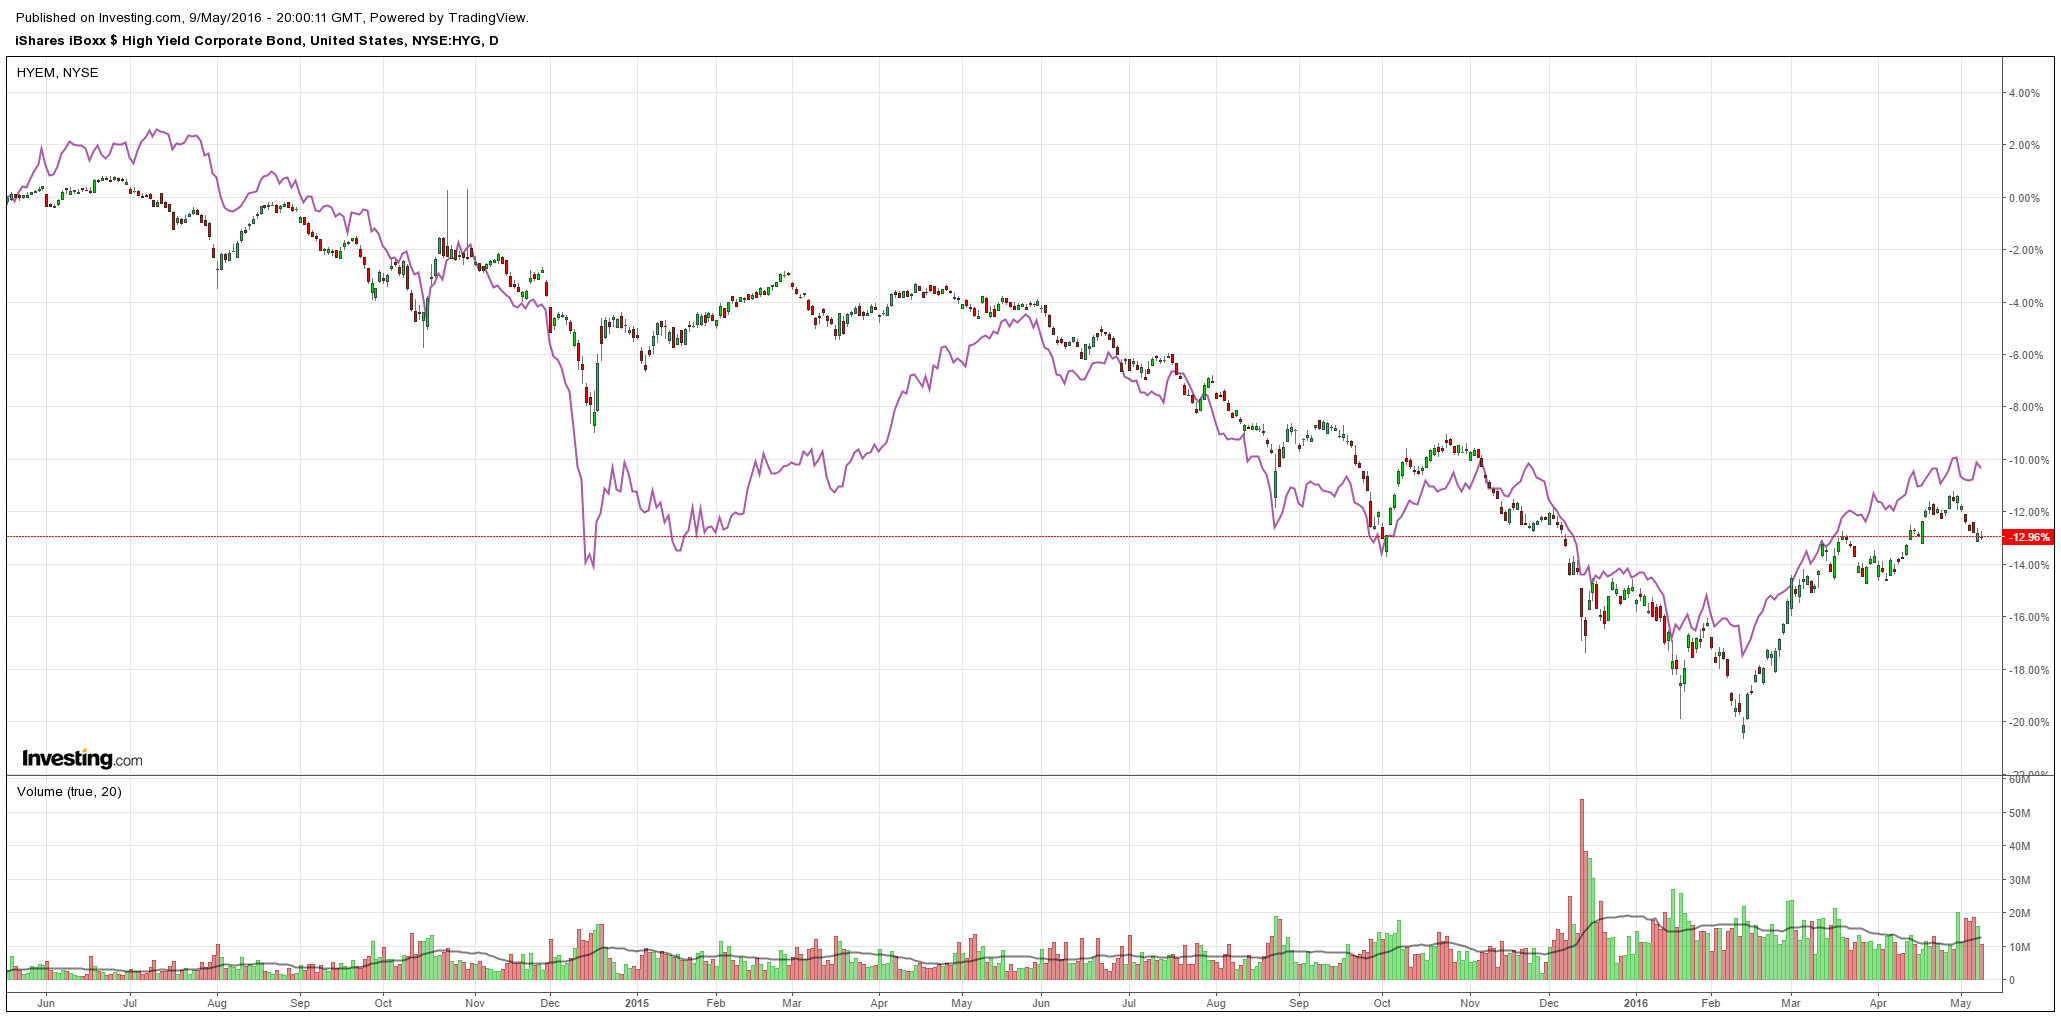
And EM/US high yield debt fell sharply:
Advertisement
The bear market rally is over and the Mining GFC is back as China’s modest stimulus is exposed. Worse, with raging bubbles in anything that moves, it increasingly looks like there is not much more China can do than press forward with structural reforms, and that means much lower hard commodities prices ahead.
BofAML takes a look at the technicals of oil to judge where we might be:
Price action at fair value resistance suggests correction
Three intraday crude oil rallies were sold last week resulting in prices closing near the open of the trading day. According to Japanese candlestick analysis; Wednesday, Thursday and Friday each formed a doji* candle suggesting indecision amongst market participants to effectively push prices higher. On April 29th crude oil reached an intraday high of $46.78 and closed near the open of the day forming the first of four doji candles in six trading sessions. Thursday can loosely be considered a gravestone doji, which as the name implies is bearish.
Aggregate volume and open interest bearishly diverge
The rally to the YTD high occurred on light volume. Considering the total (aggregate) volume across all WTI crude oil futures contracts, volume during the rally in the latter half of April was less than the rolling 15 day average. The decline from the YTD high occurred on greater than average volume. Since the rally began from the YTD low, the trend in aggregate open interest has bearishly diverged from price.
A look back at the golden cross is insignificant
Since 1983 there have been 23 occurrences when the 50 day moving average crossed above the 200 day moving average. By the time the 50 day average crossed back below the 200 day average, price was higher only 9 out of 23 times. When analyzing price action between the up cross and down cross points, the high price was before the low price 13 out of 23 times.
In our March 1st report, our market profile chart implied a close over $34.25 would prompt a rally to $39-$40, and it did. We later pointed to a sustained rally to $45.50 that would continue to fill the remainder of the prior distribution gap. Price reached this level in the end of April filling some of the 8/1/2015 – 2/29/2015 distribution gap.
Our updated market profile chart now shows $46.75 is the top of the value area in the 8/1/2015 – 2/29/2015 distribution and that aligns with the bottom of the value area of the 1/1/2015 – 7/31/2015 distribution. This ($46.75) is a major resistance level. A close through it could prompt a rally to $51.00 which opens the possibility of filling another distribution gap. However previously mentioned technical conditions suggest a decline and so we see $38.50 (3/31 POC) and $35.25 (value area 3/31) as major support levels.
Preliminary signs of a developing base
If crude oil prices were to decline for the next four to eight weeks, it would start to form the right shoulder of a head and shoulders bottom. While this is very preliminary, a decline to the mid to upper $30’s followed by a rally through resistance of about $45 would form an intermediate sized head and shoulders bottom that could project crude oil prices much higher.
Seasonal average trends show May is bad for crude
When comparing the 5, 10 and 30 year average price trends, May stands out as a weak month. Prices have declined on average over the past 5 and 10 years in May. The average trend over the past 30 years also leans lower.
Macro risks: Alberta fires, Saudi Oil Minister replaced
According to Bloomberg, wildfires in Canada have spread to the main oil-sands facilities knocking out approximately 1 million barrels of production per day. However the new Saudi oil minister, Khalid Al-Falih is said to be a close ally of Prince Mohammed bin Salman who is known for prioritizing market share (supply) over prices. These events could add increased short term volatility to trading.
Advertisement
Oil is certainly better placed to find a bottom than anything that Australia sells.
David Llewellyn-Smith is Chief Strategist at the MB Fund and MB Super. David is the founding publisher and editor of MacroBusiness and was the founding publisher and global economy editor of The Diplomat, the Asia Pacific’s leading geo-politics and economics portal.
He is also a former gold trader and economic commentator at The Sydney Morning Herald, The Age, the ABC and Business Spectator. He is the co-author of The Great Crash of 2008 with Ross Garnaut and was the editor of the second Garnaut Climate Change Review.