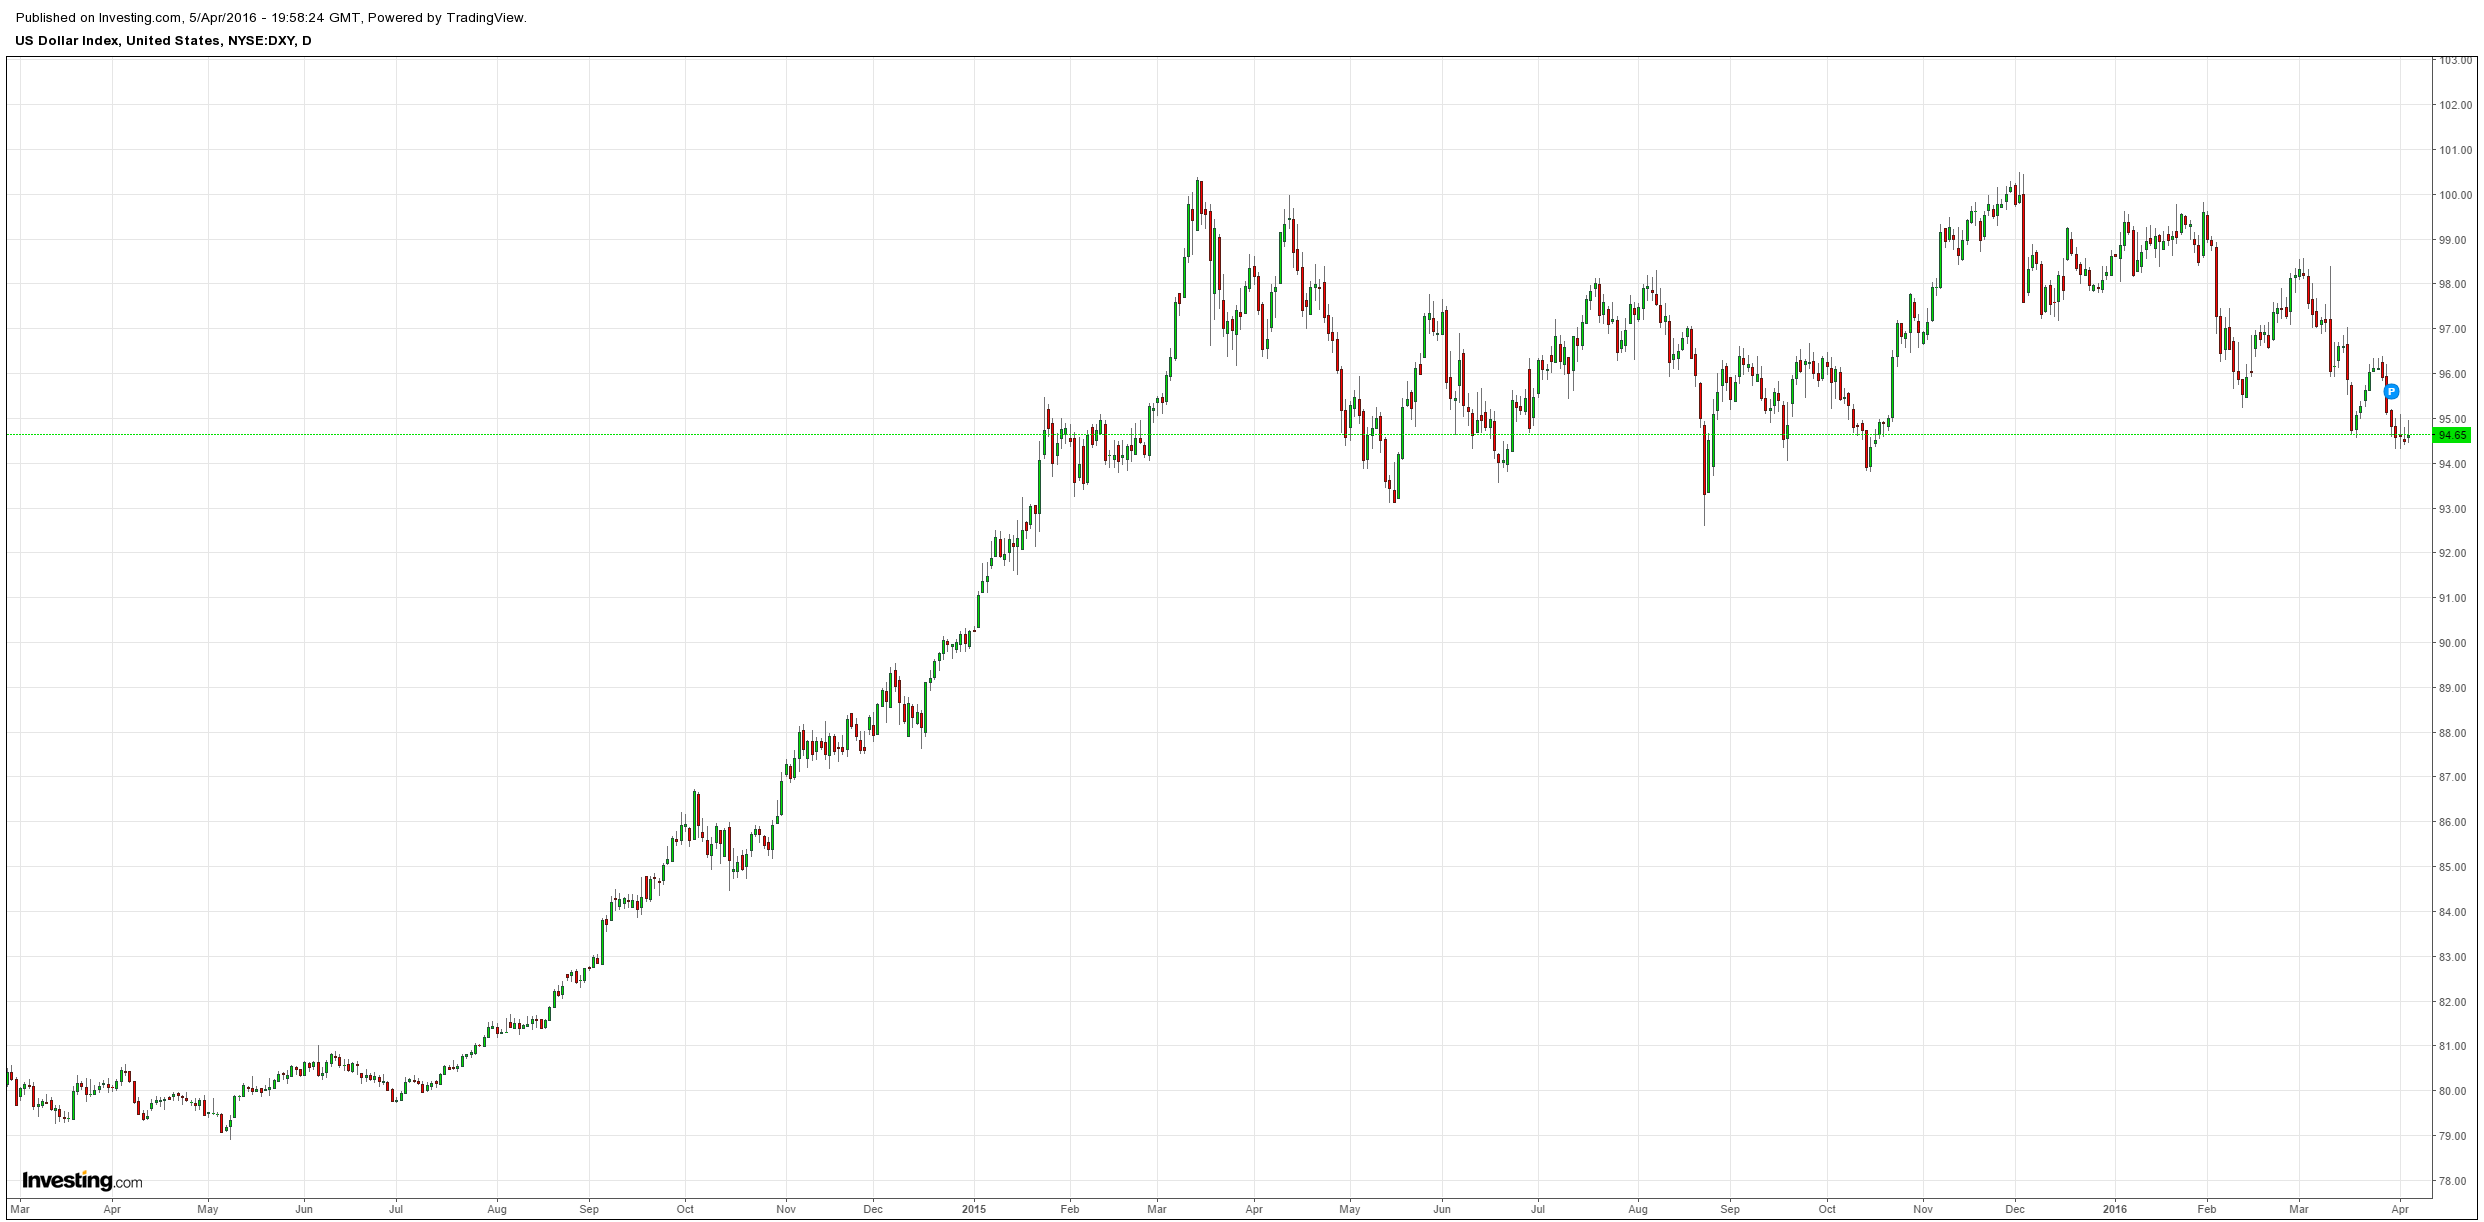
The Mining GFC rose again last night as oil continues to fuel volatility. The US dollar firmed a touch:
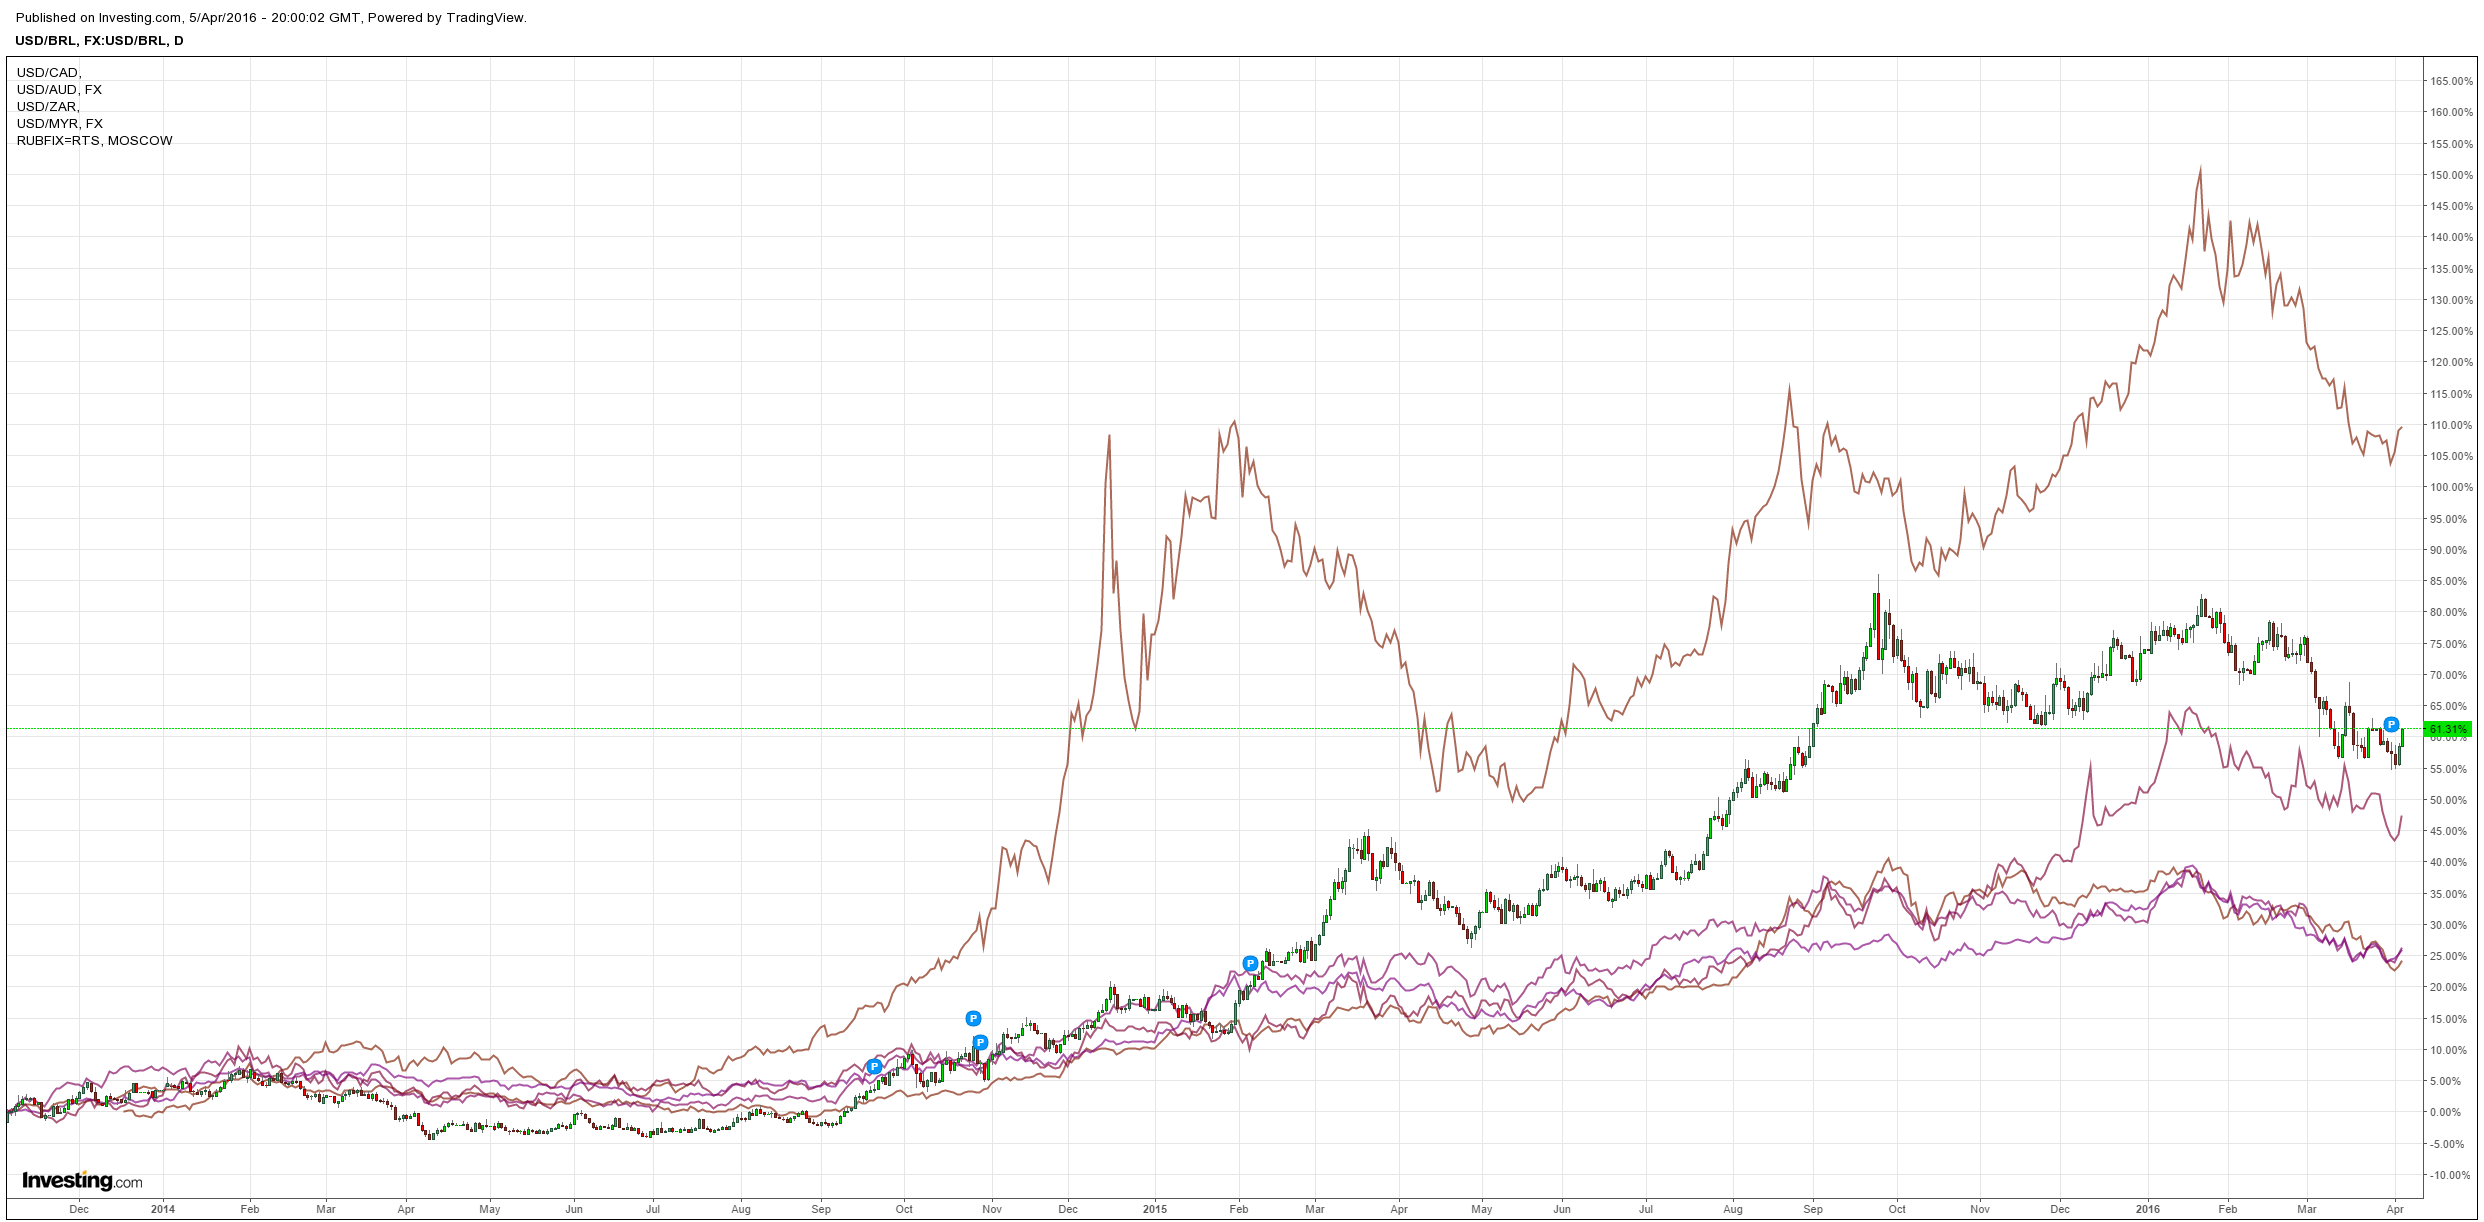
Commodity currencies fell sharply with the Aussie pounded:
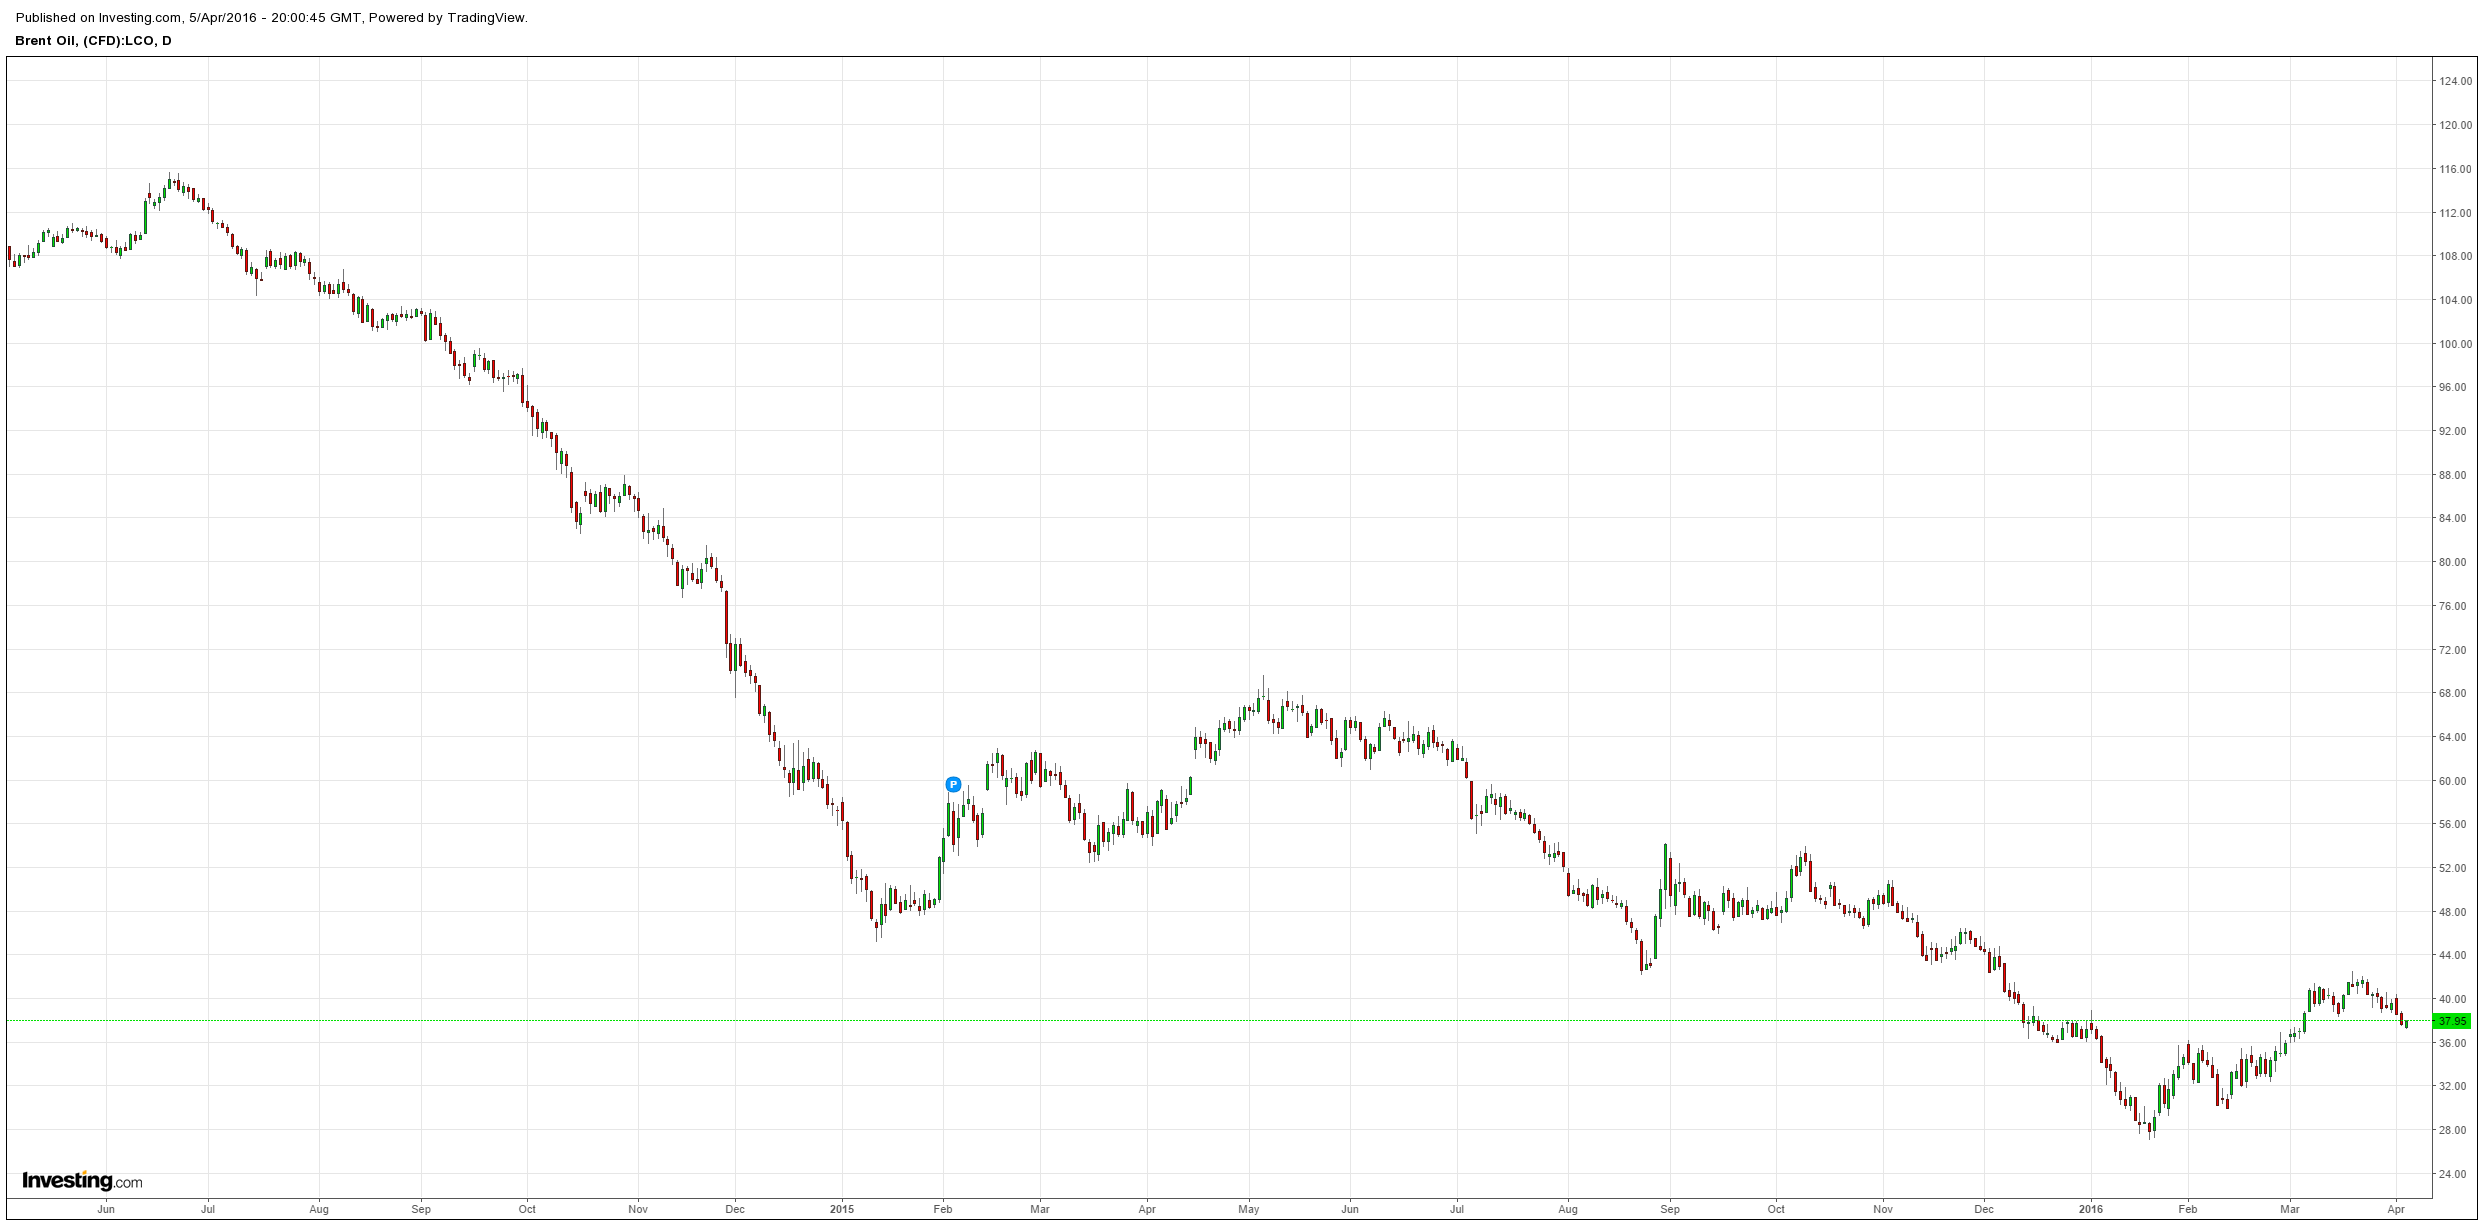
Brent managed a small rise but is still the driver:
Advertisement
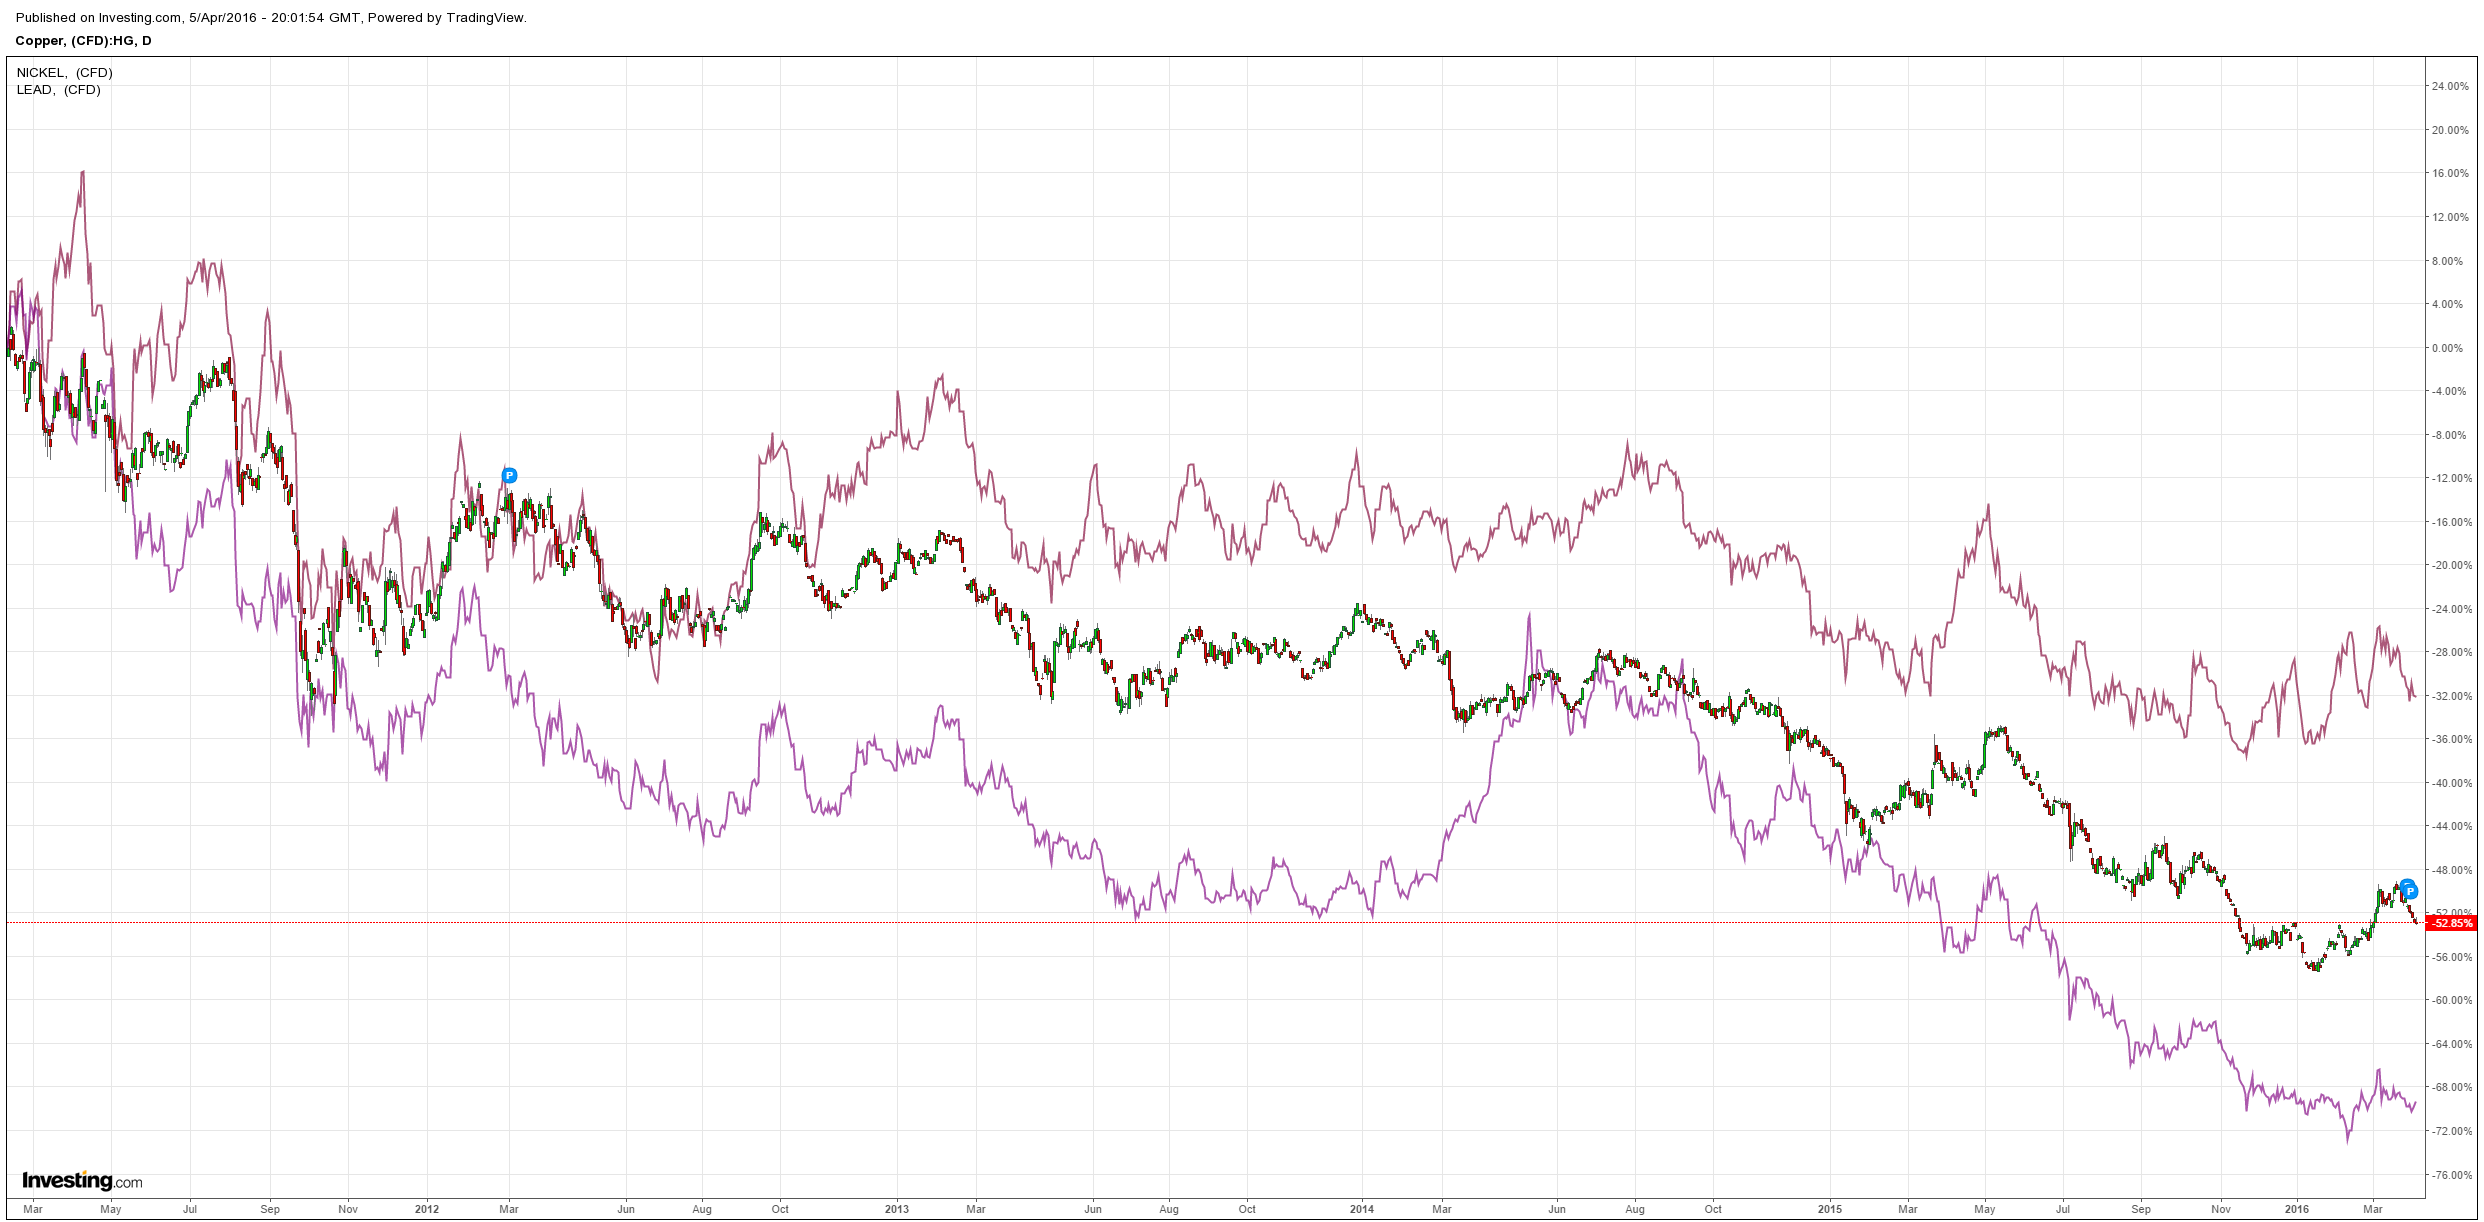
Base metals were weak:
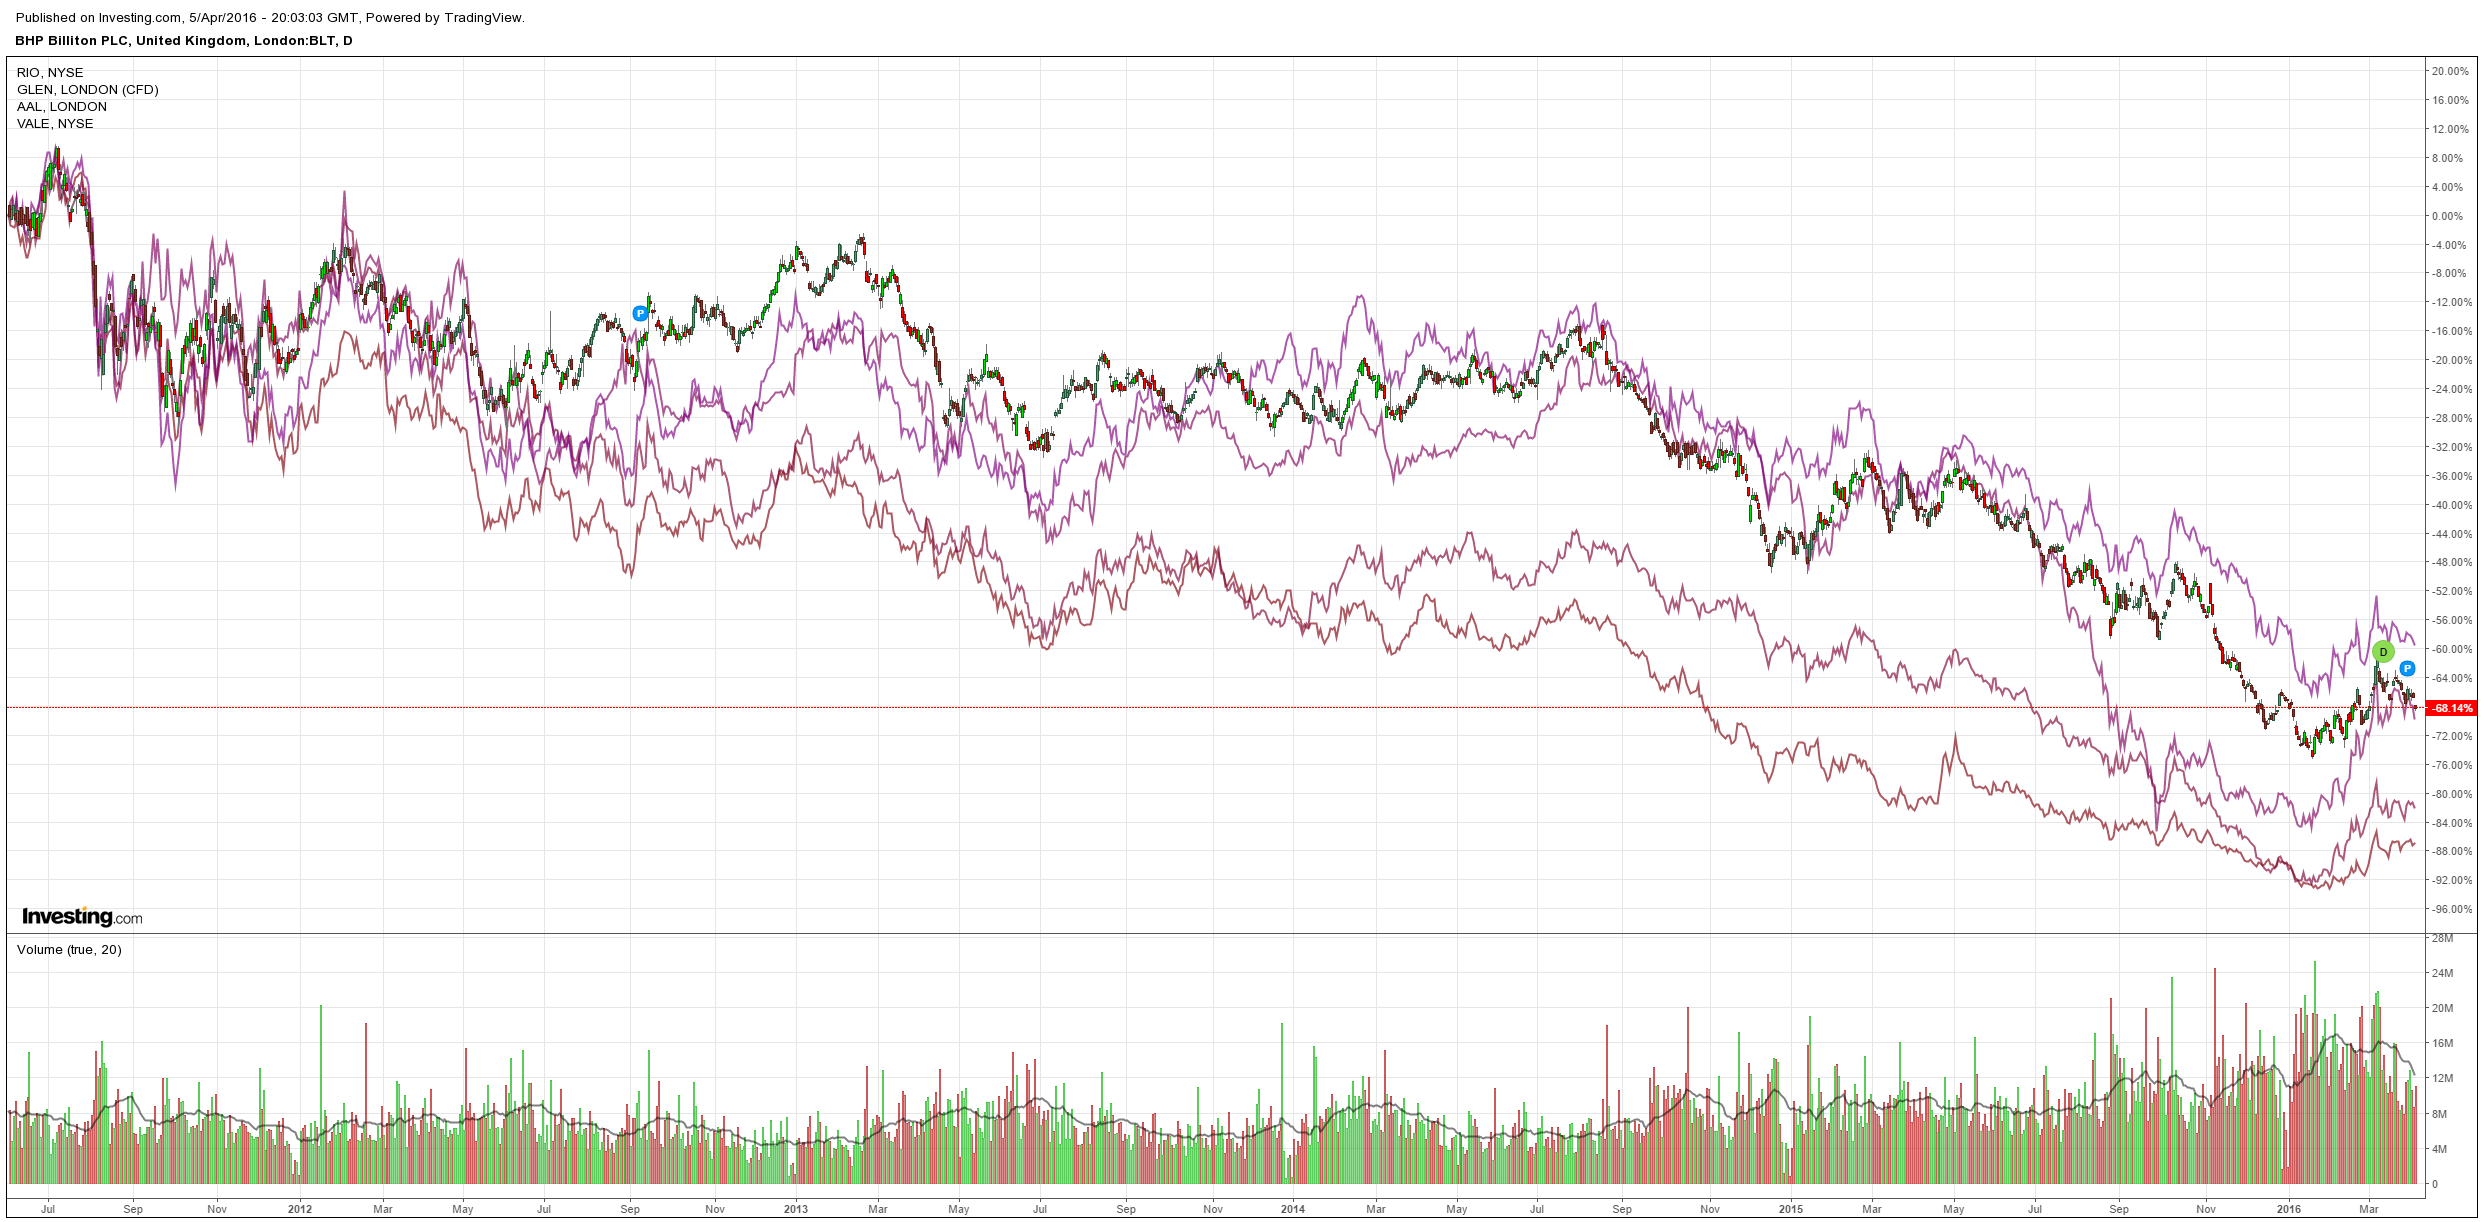
Miners were hammered:
Advertisement
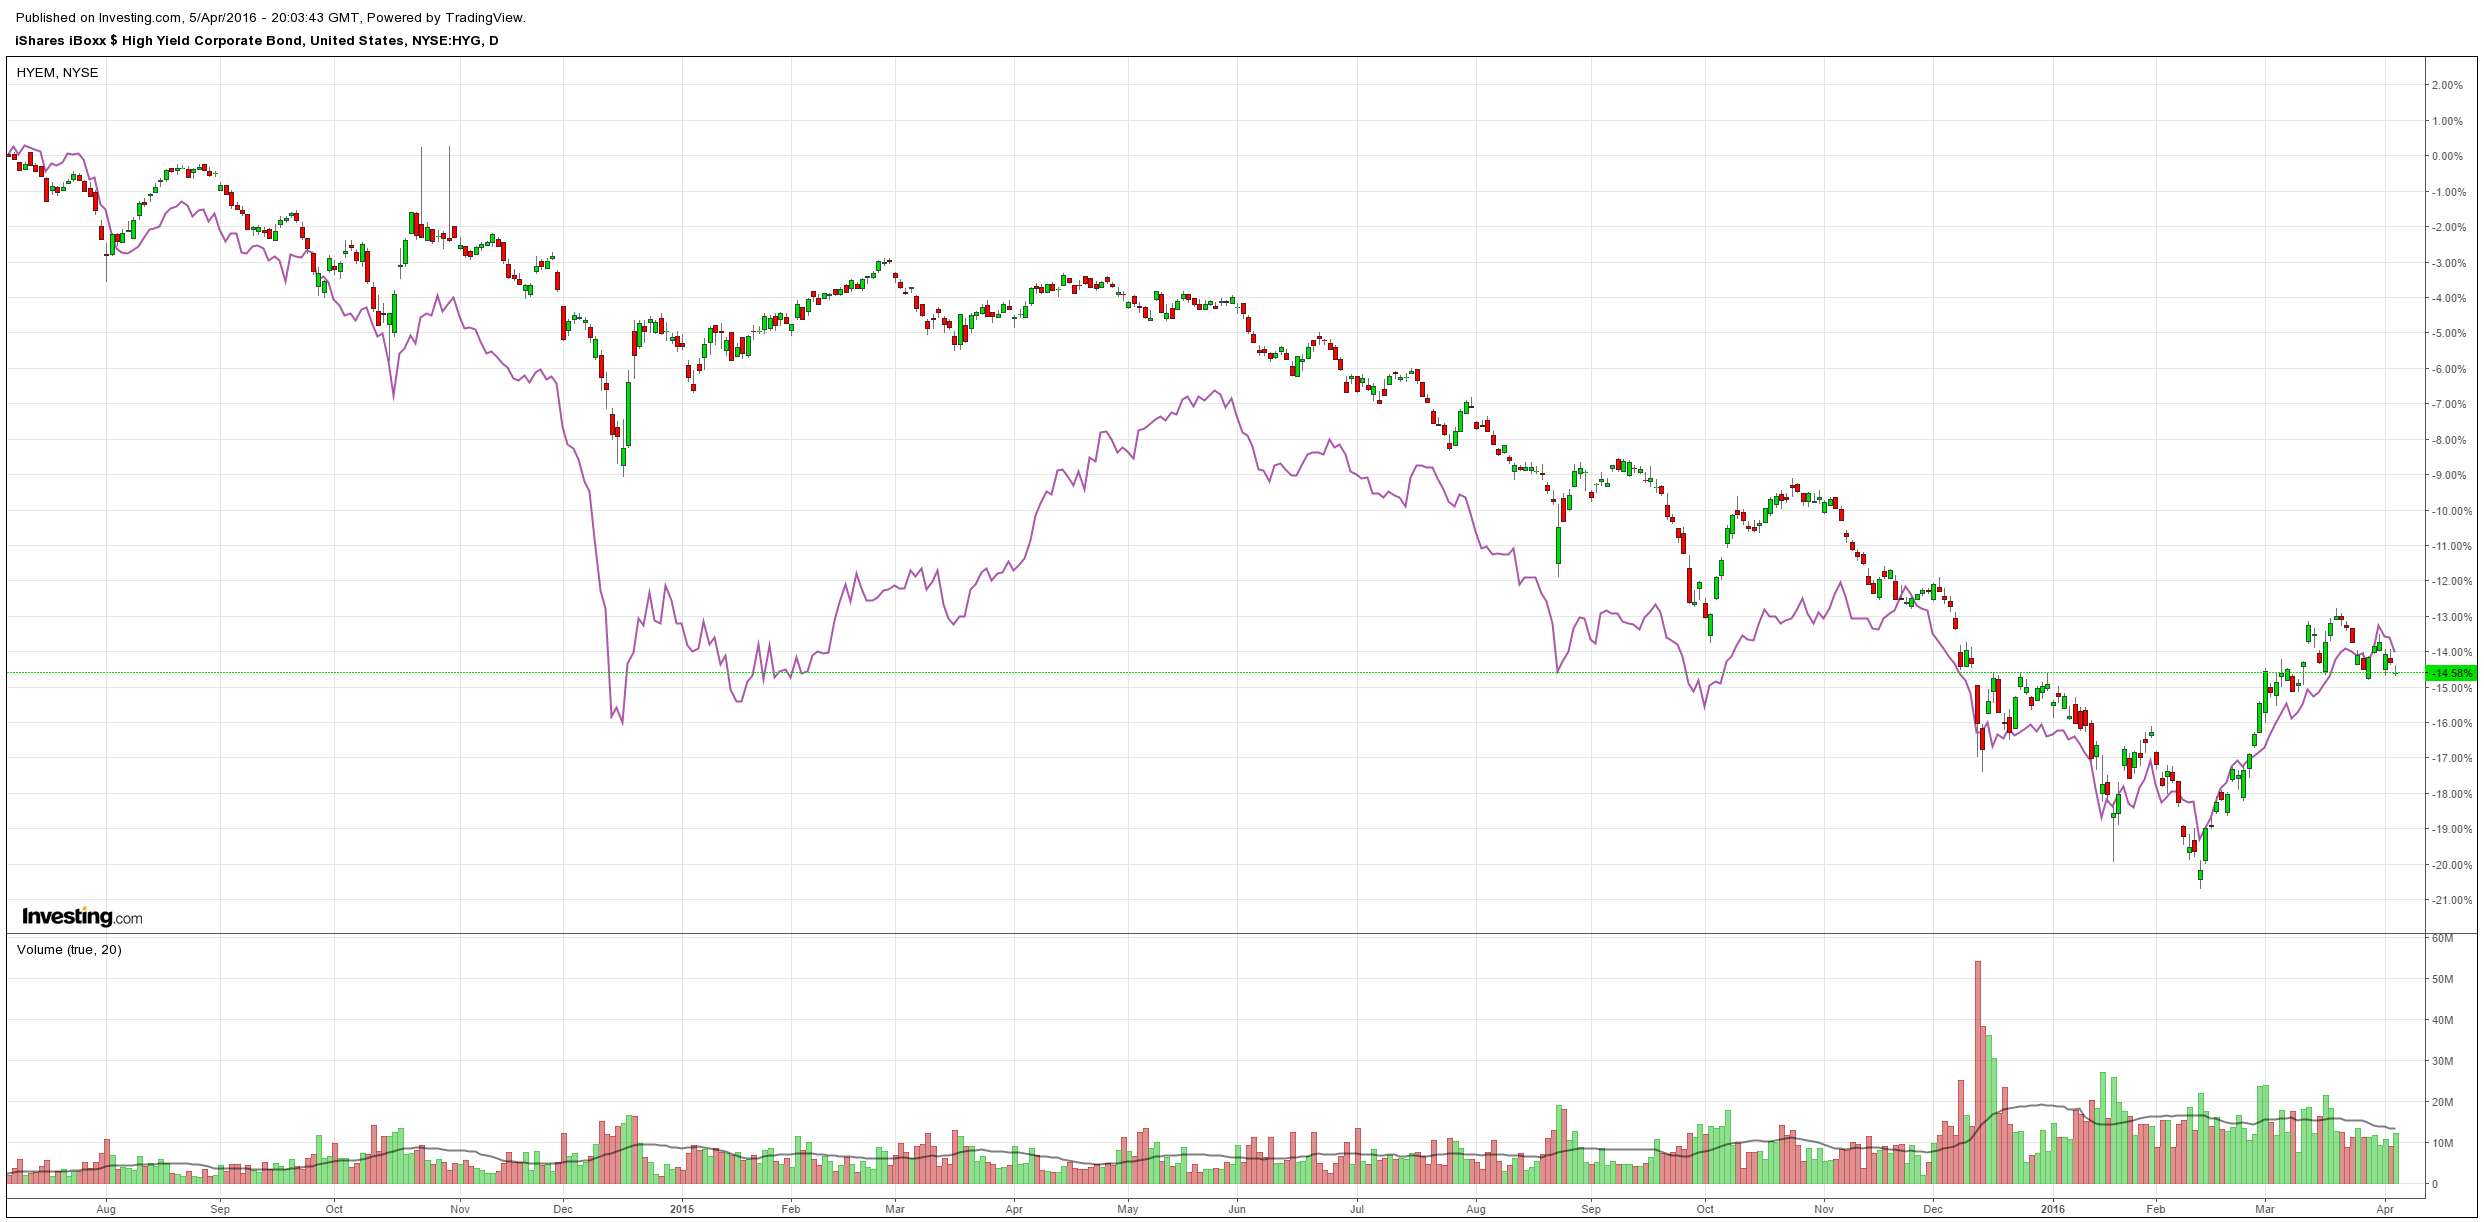
US and EM high yield was hit:
BofAML chimes in on the latter:
In terms of the shape of this cycle, absent a recession we expect the pace of defaults to be much closer to the 1998 experience than the 2007 one. In fact, we have coined the phrase “a rolling blackout” to describe the potential for a period of many years where the market experiences general weakness and moderately high defaults as individual sectors take turns realizing their moment of distress. Whether these moments are based on a deterioration of underlying fundamentals, an unwind of crowded trades, or some sort of series of macro-economic incidents is nearly irrelevant, as the uncertainty and consistent underperformance of the overall market will likely frustrate many investors and asset allocators. In our view this is not unlike the 1998-2002 experience, where the very same scenario could played out: years of high yield underperformance, poor returns and moderately high defaults. Recall in those years, high yield returned 2.9%, 2.5%, -5%, 4.4%, -1.9% (and 3 years in a row of negative excess returns) while the default rate slowly crept up from 2% to 8% over the course of 3.5 years before hitting double digits.
Should the market realize a mid to high single digit default rate for years cumulative losses over the length of the entire cycle could be worse than we’ve ever seen before. A total of 33% of issuers defaulted over the course of the 1987 and 1999 default cycles, higher than the 25% in 2008 as the latter benefitted from unprecedented central bank intervention. But the very same policies which helped alleviate the pain in the last cycle will likely add to the severity of the next one. This is because many of the companies that should have defaulted 7 years ago but instead received a lifeline will likely shutter doors now. As risk premiums have caused yields to jump nearly 400bp, many of these firm’s business models will now likely be unsustainable; especially given the lack of EBITDA growth we have seen this cycle (Chart 1). When these issuers are then coupled with the newest crop of unsustainable businesses from this credit cycle, we could see cumulative default rates approaching 40% this cycle versus the traditional 33%.
However, not only will defaults be higher than in past cycles, but credit losses are also likely to be worse than ever before. That’s because recoveries, even outside of the commodity space have been paltry in the post crisis years. Given where we are in the default cycle, prevailing recoveries are a full 10 points lower than where they should be. Chart 2 highlights historical time periods characterized by low default rates (inside of 4%). Whereas in the past, recoveries tended to surpass 50% in low default environments, the last few years have seen those averaging 40%.This is telling because it means the pressure on recoveries is not being caused by the abundance of assets for sale in the market, which increases as more companies default, but rather because of the quality of these assets as we have discussed in part 1 of our recovery analysis published last year.
So why are today’s assets garnering less enthusiasm than before? One reason, of course, is that a large portion of defaults today are in the commodity space, which are finishing with sub 10% recoveries as investors try to grapple with a market which may not have hit its bottom. However, problems persist even outside of the commodity industries. Take a look at the YoY growth in capex for non-commodity HY issuers (Chart 3). It’s striking how CEOs have invested much less in their businesses this cycle compared to previous ones. In fact, most of the capex growth since 2010 has come from energy issuers on the back of the US energy independence story in the early part of the decade; and we all know not to count on that going forward. On top of that, asset impairments as a percentage of tangible assets are through the roof, chipping away at valuations of an already low asset base. Not surprisingly, non-commodity recoveries reflect the same extent of erosion post 2010 as does overall HY (Chart 4).
Given that HY companies have seen hardly any organic growth within last few years, it is of little surprise that recoveries today are so low. The bad news is that we think they are going to decline further.
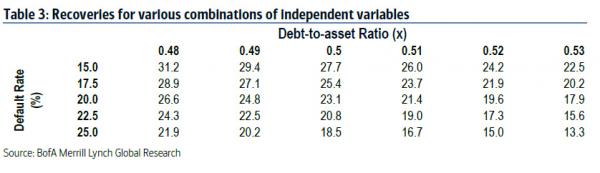
So where does this leave us? According to our model, should the default cycle look similar to the 1999 experience (2yr cumulative DR of 25%), and debt-to-asset ratio touch the highs of that cycle (0.51x), recoveries can be as low as 16c on the dollar. There is also a case to made that if there is no catalyst to total capitulation, and we see a longer flatter default cycle, we could see 2yr cumulative default rates much less than 25%. While this is reasonable, one can also argue that debt-to-asset ratio which today already stands at 0.48x, could ultimately go much further past 0.51x.Additionally, as we have seen in the post crisis years, default rates matter less than debt-to-asset ratios, meaning recoveries even under a rolling blackout scenario could even be worse than we expect.
Table 3 presents a scenario analysis of the range of recoveries to expect in the next few years depending on one’s forecast of default rates and debt-to-asset ratios. In almost any scenario recovery rates stand to be well below 30% this cycle.
While most investors we have talked to appreciate that recoveries will be lower going forward, we think it’s just as important to highlight just how much. Because, 8% yield may sound attractive if your expected credit losses are 400bps (6% DR*70% LGD). But the picture suddenly becomes unappealing knowing these losses could accumulate to 500bps; suddenly leaving you with an unremarkable excess spread cushion.
And it appears that investors have begun to pay attention, at least as seen from the events in the primary market. It’s no surprise that CCC issuance has cratered in the last year as investors are unwilling to extend credit to low quality issuers. Now it seems they are even rewarding BB issuers for using their newly raised debt judiciously, as can be seen from the lower clearing yields for debt being earmarked for capex investment over anything else
Welcome to the brave new world of massive default losses and record low recoveries.
This new world will be one where investors should and will adjust their expected compensation higher to make up for rising defaults, dwindling recoveries, and declining liquidity, all of which are here to stay.
I will go on record and say that if this analysis proves correct then Australia’s luck has run out.
David Llewellyn-Smith is Chief Strategist at the MB Fund and MB Super. David is the founding publisher and editor of MacroBusiness and was the founding publisher and global economy editor of The Diplomat, the Asia Pacific's leading geo-politics and economics portal.
He is also a former gold trader and economic commentator at The Sydney Morning Herald, The Age, the ABC and Business Spectator. He is the co-author of The Great Crash of 2008 with Ross Garnaut and was the editor of the second Garnaut Climate Change Review.