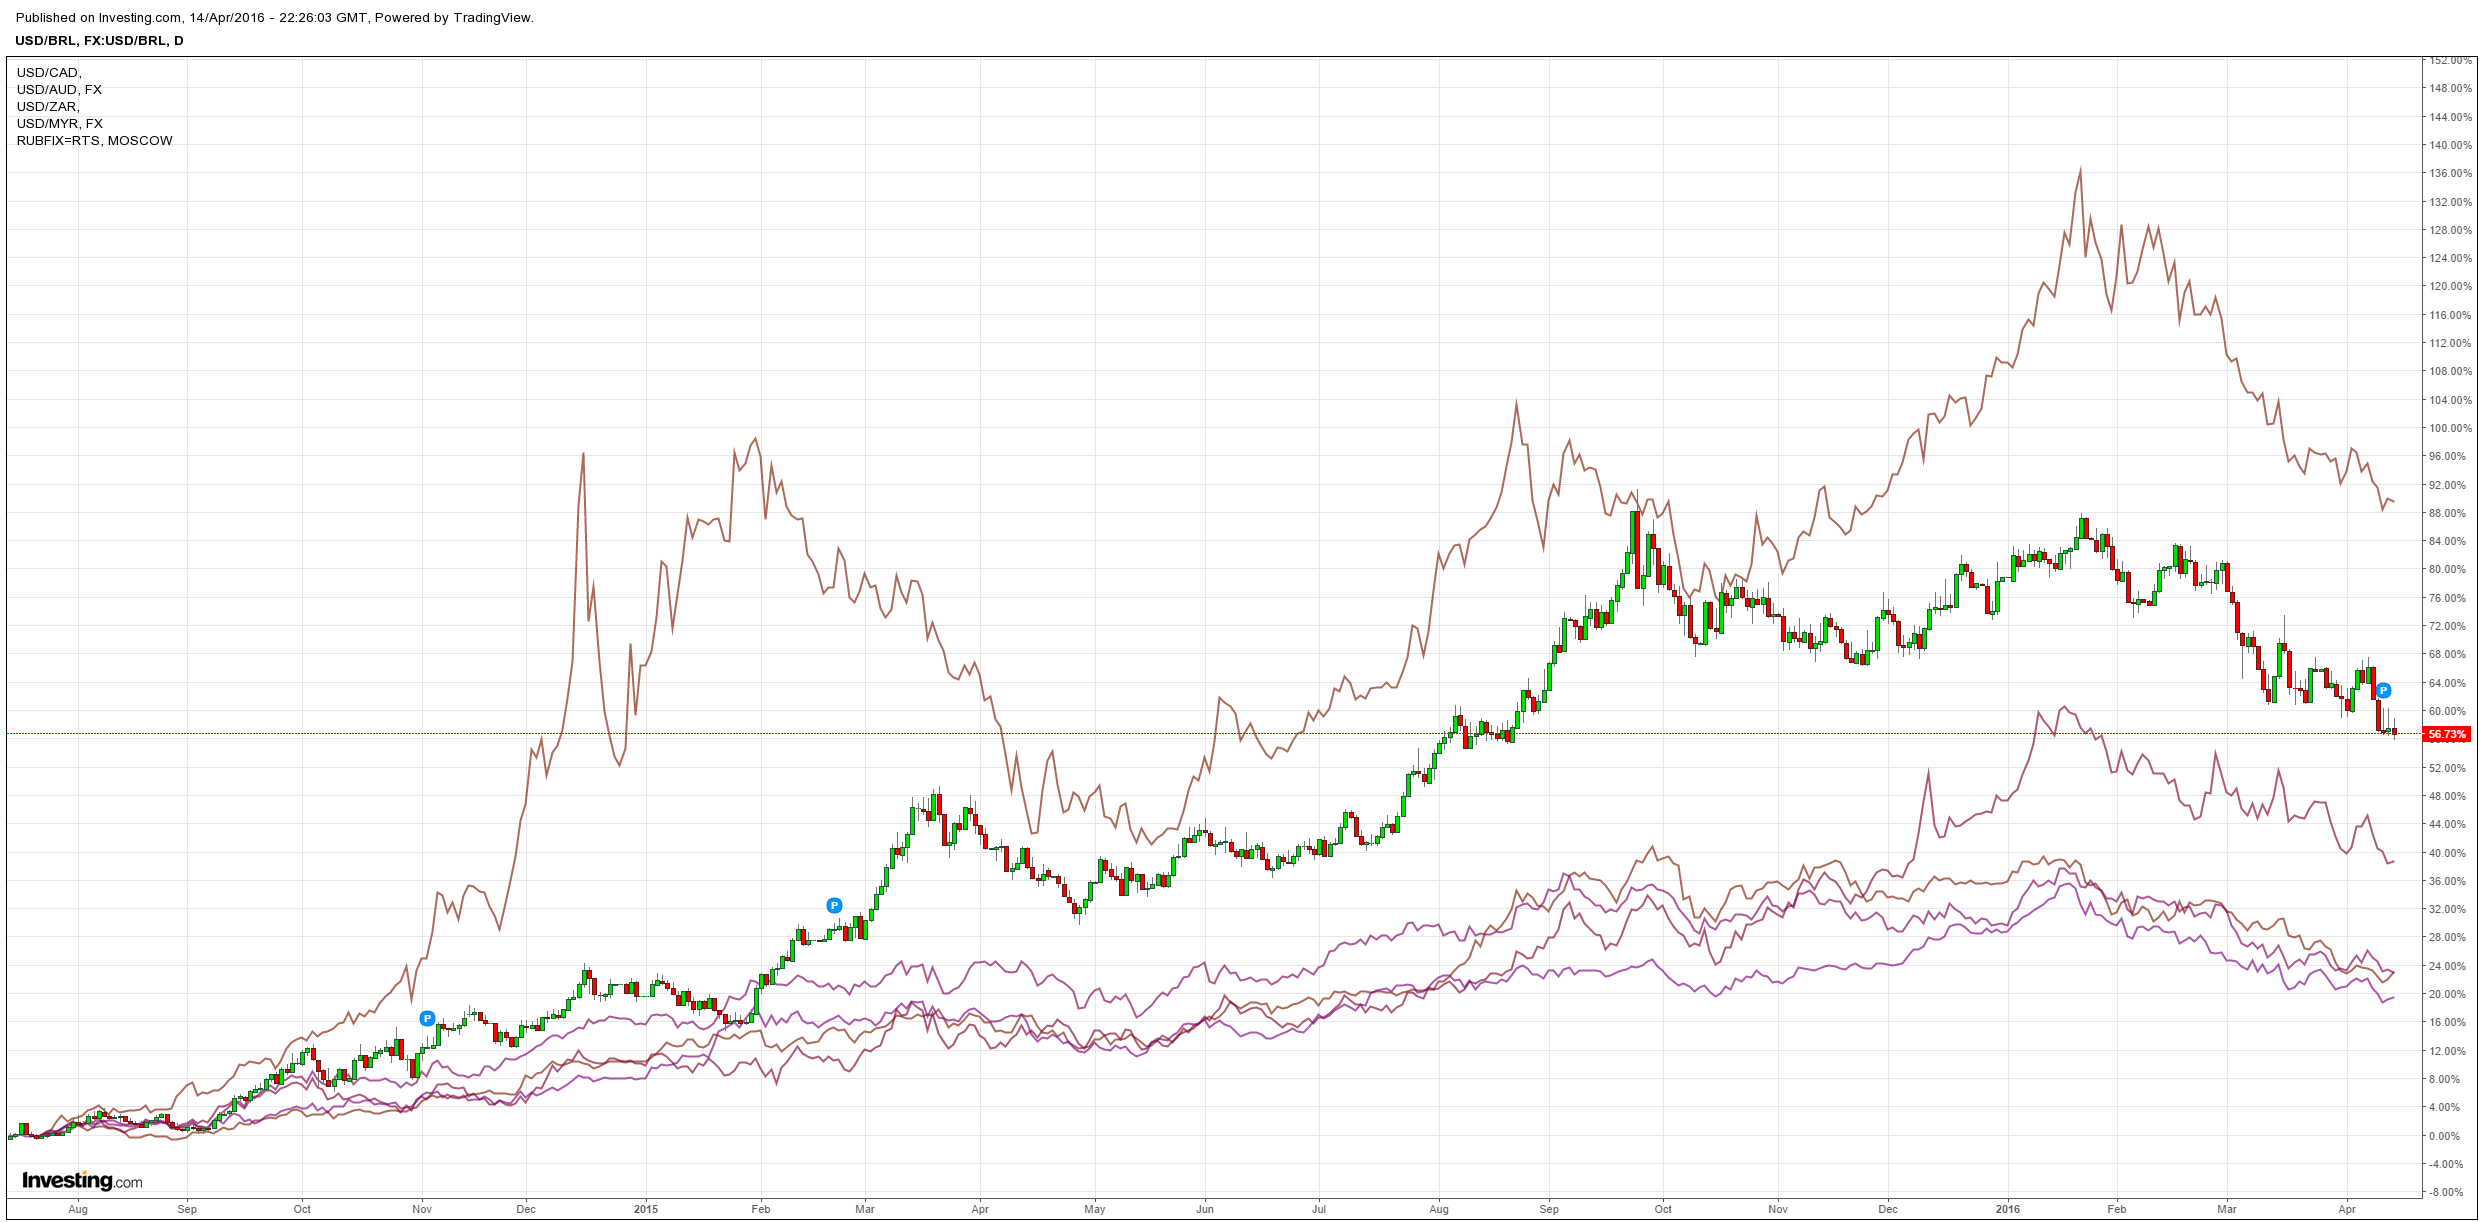
Commodity currencies too, except the Aussie (I guess on local data pushing out the RBA):
Advertisement
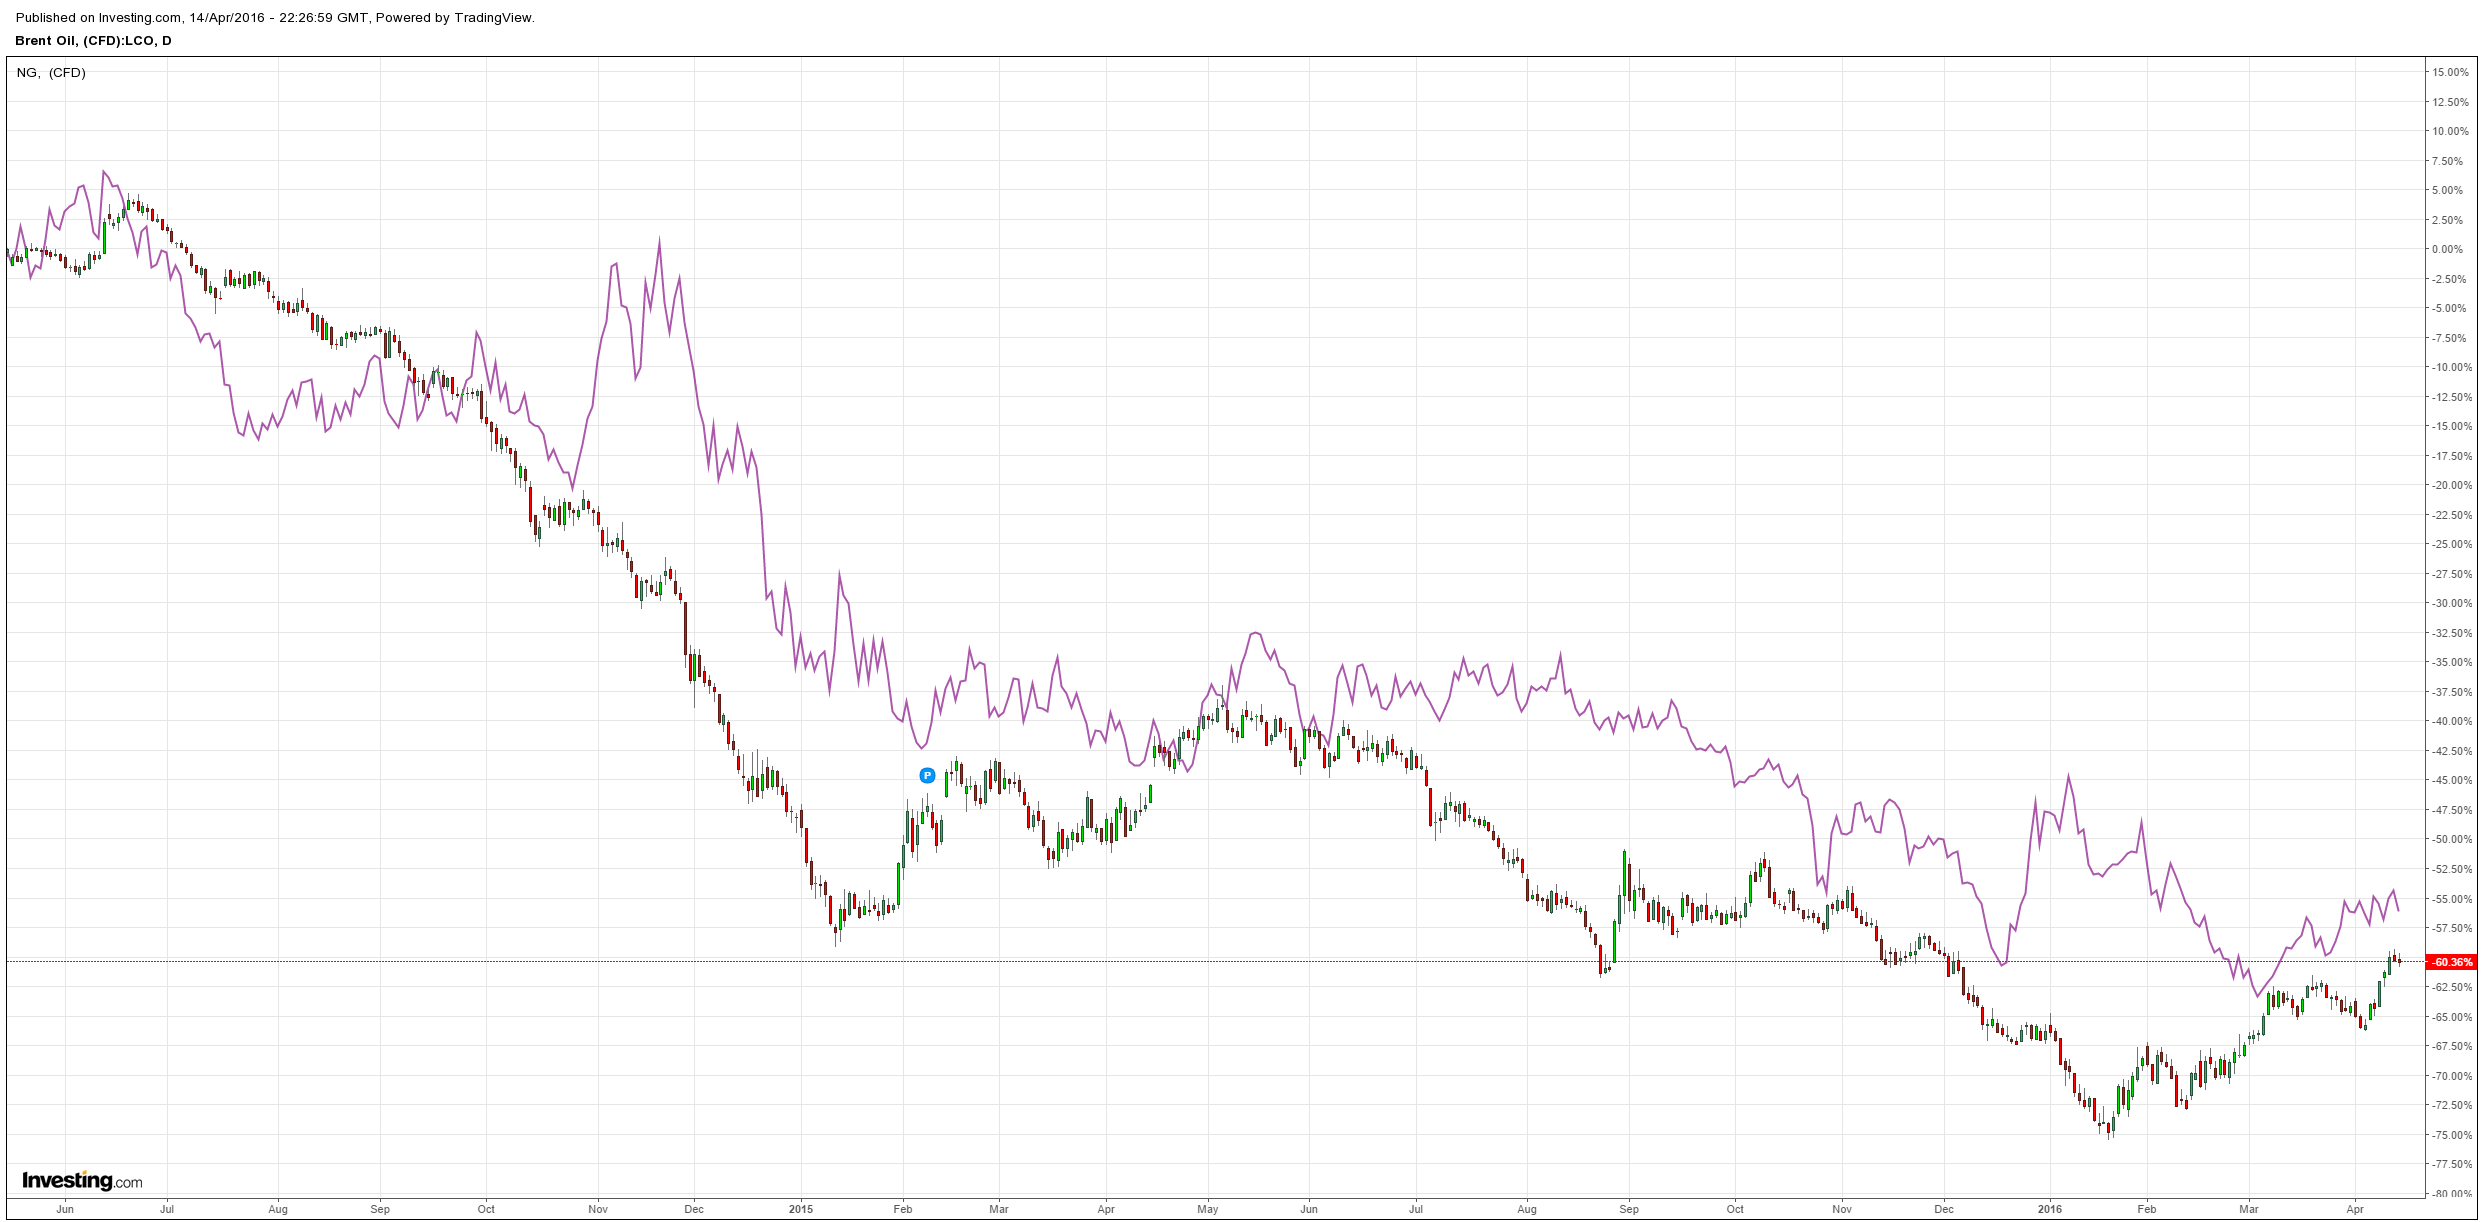
Brent was stable:
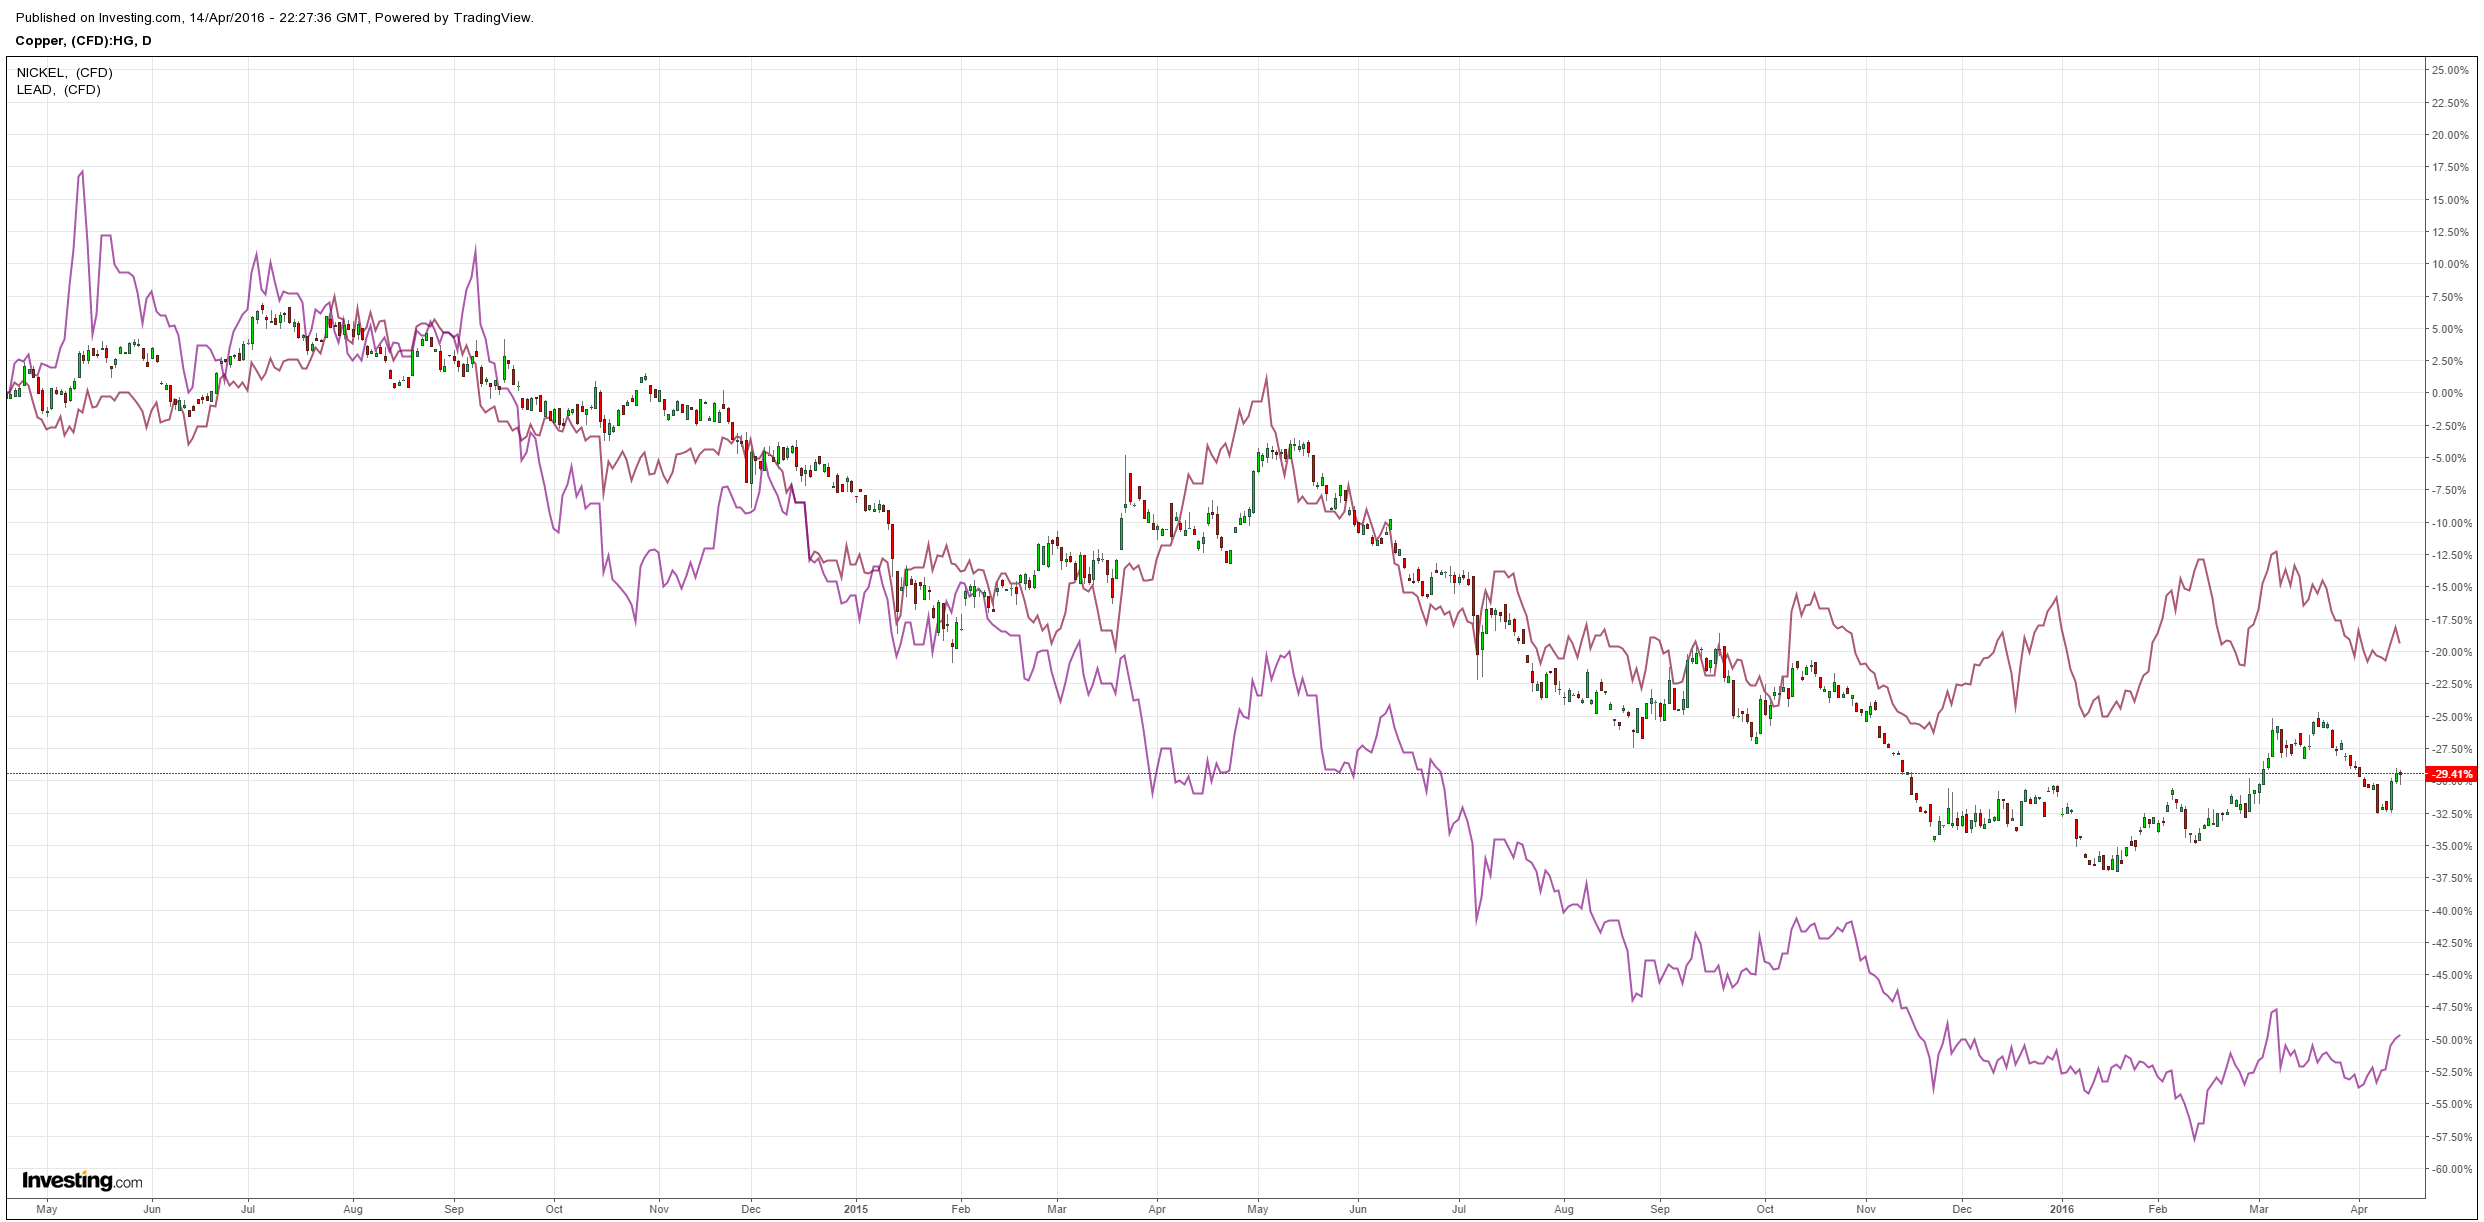
Base metals mixed:
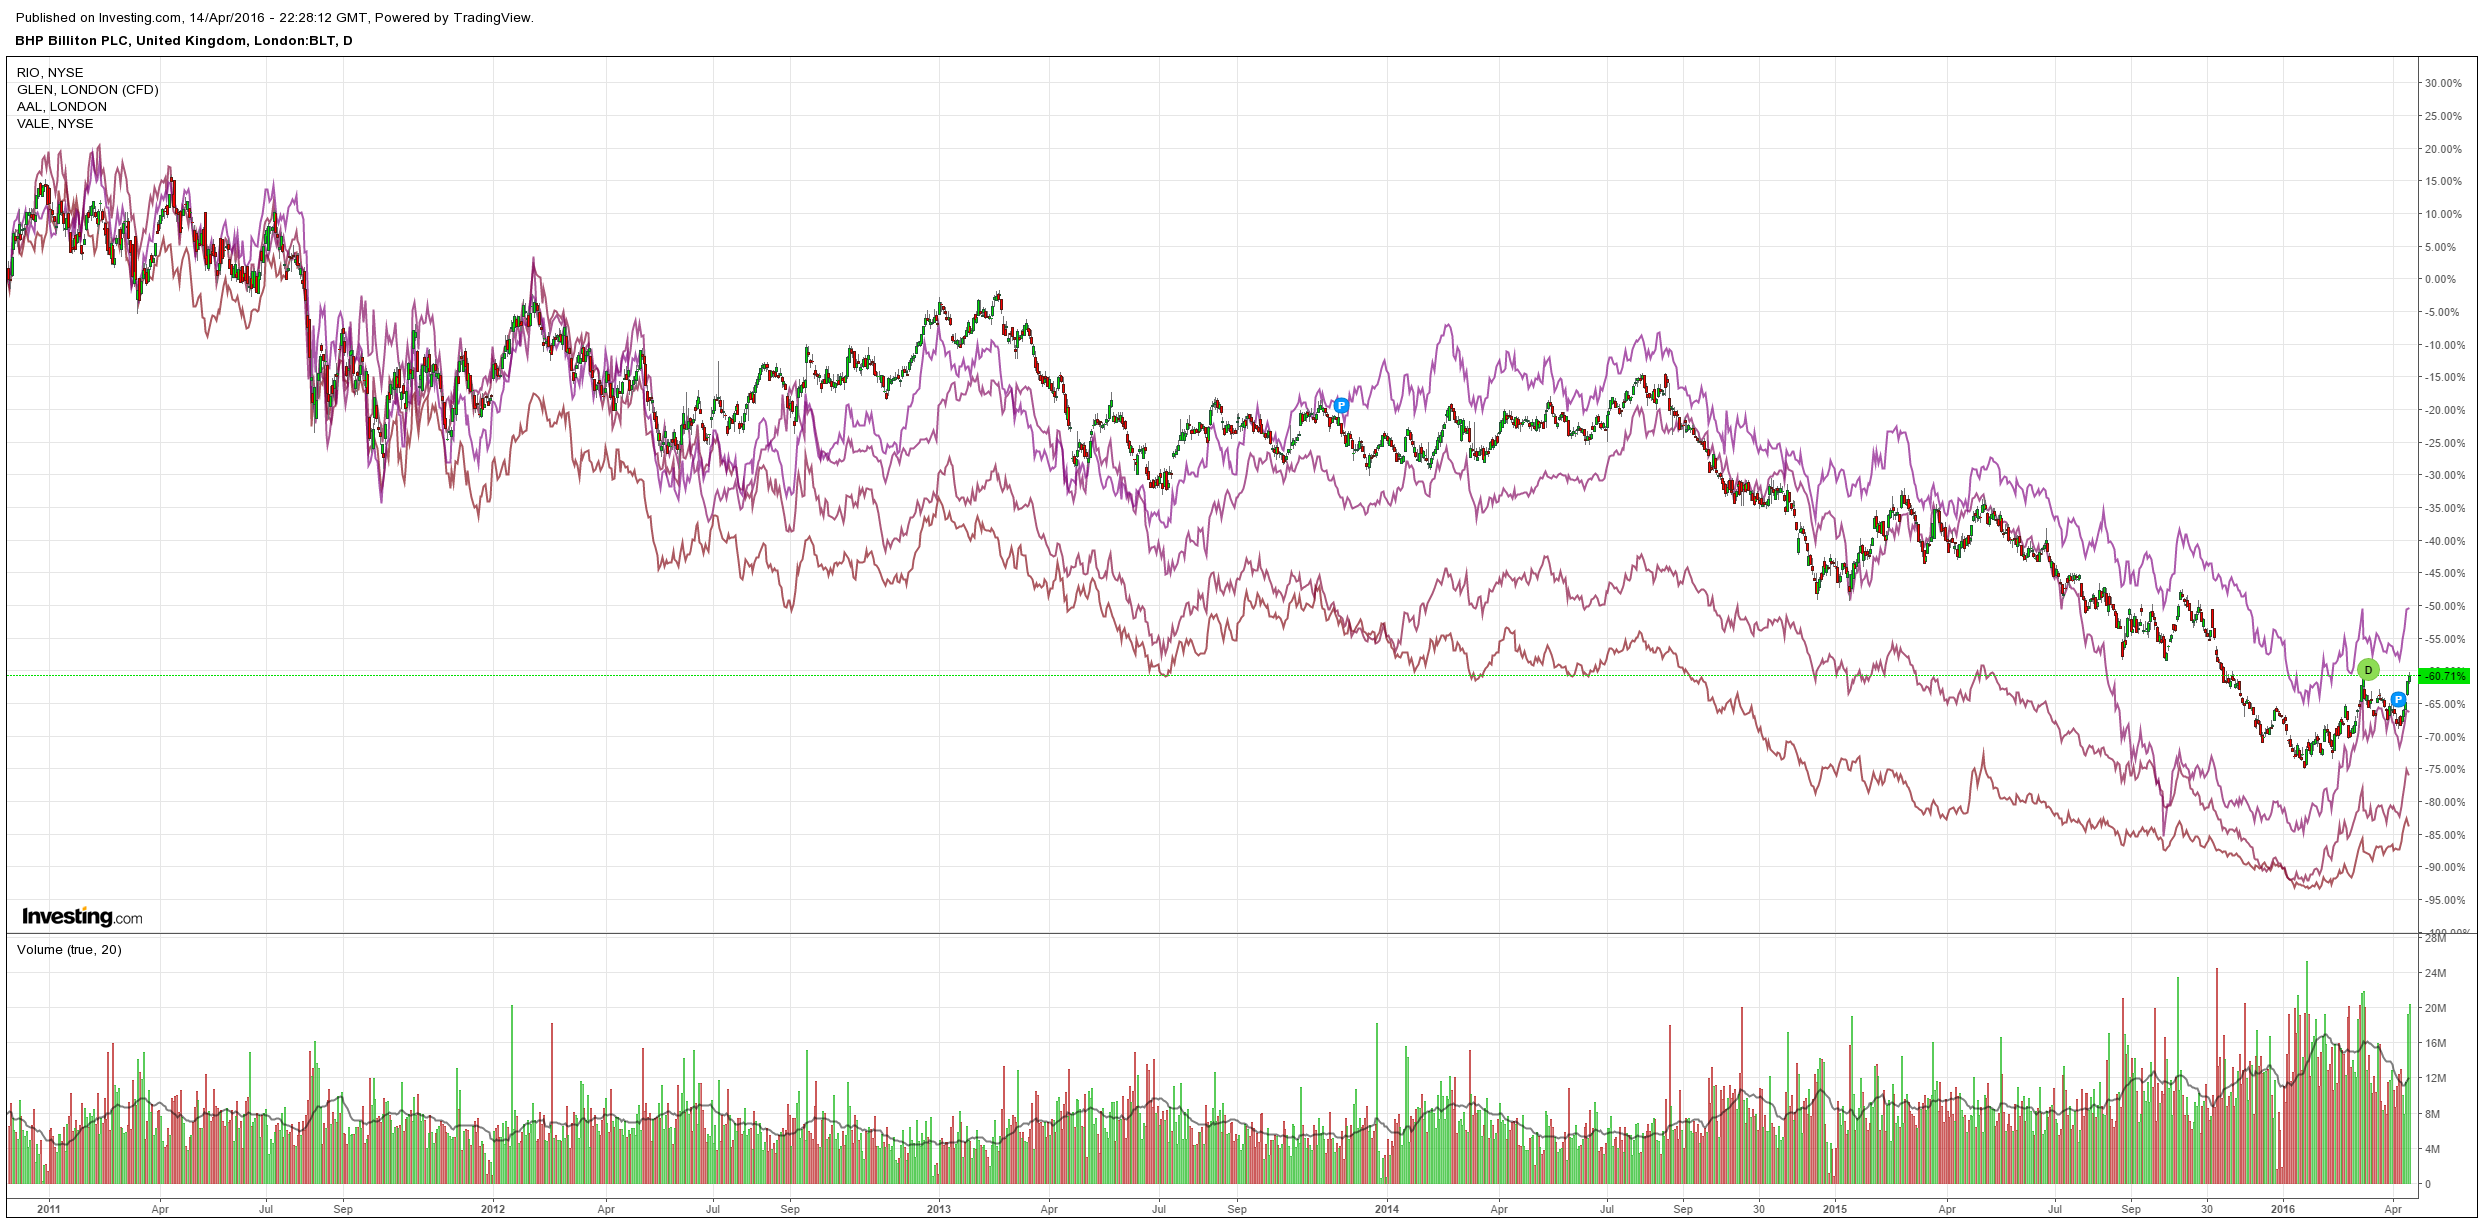
Big miners weakened a little:
Advertisement
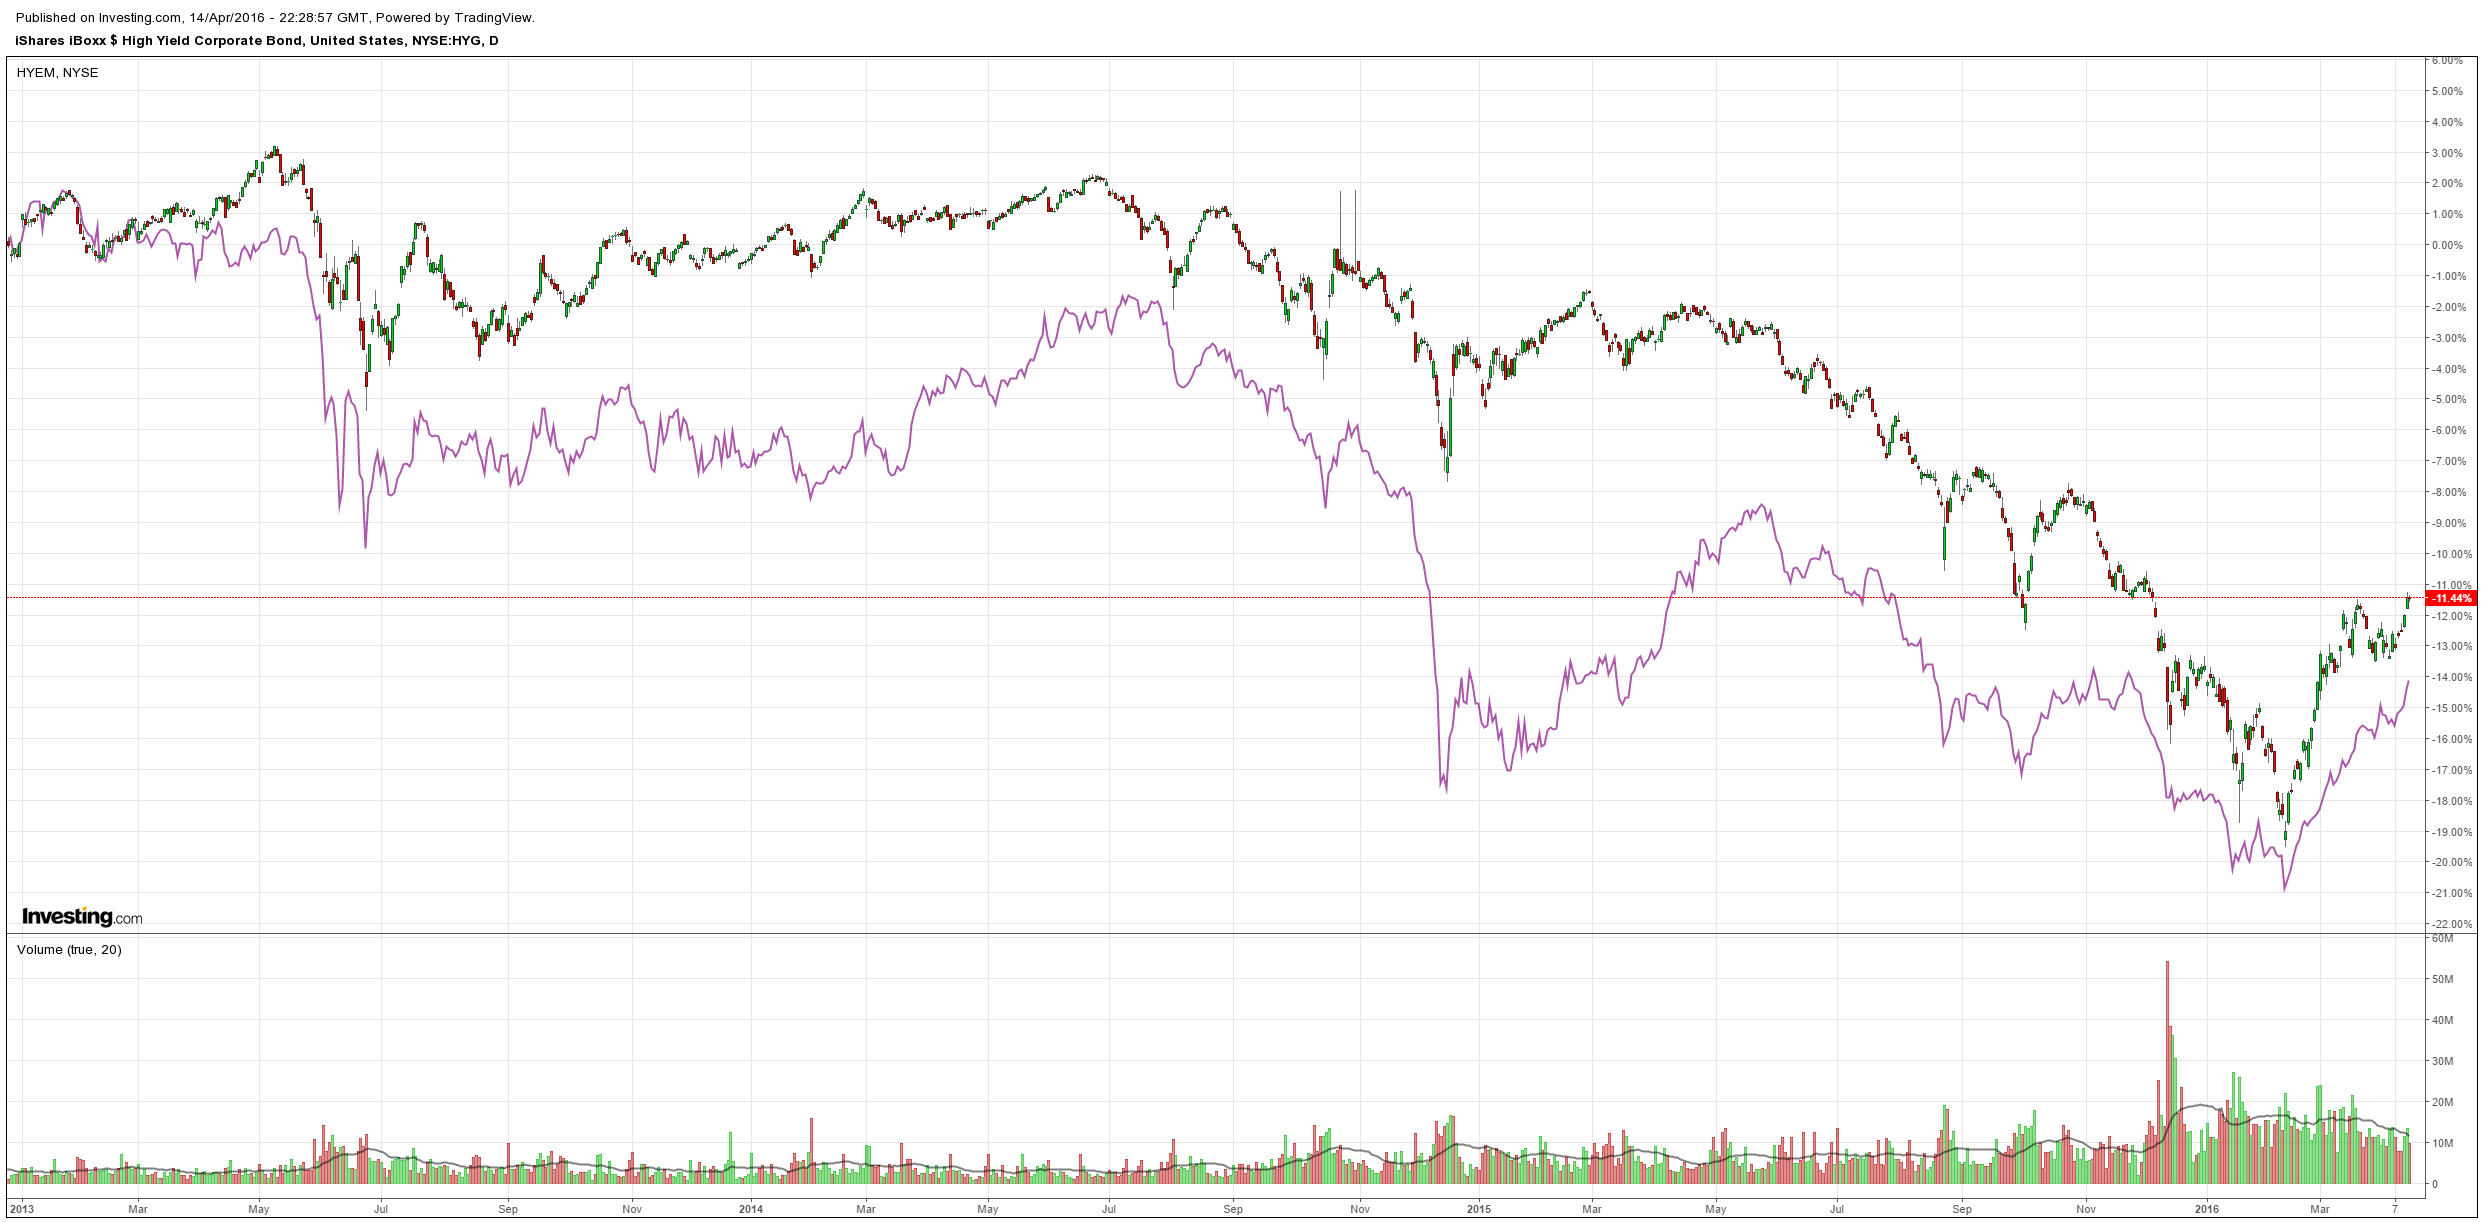
HY in EMs kept flying but stalled in the US:
As we know the Mining GFC is driven by a firming in the US economy, interest rates and dollar versus a weakening in the Chinese economy, interest rates and yuan creating a perfect storm for commodity prices and emerging market economies. For now, global markets are enjoying a Goldilocks moment in which China stabilised enough and the US Fed has backed off enough to restore some hope for growth in EMs and give commodities a reprieve.
Advertisement
However, MB maintains that the US is still going well enough to see more tightening and the Chinese growth pulse will slow relatively quickly as stimulus fades with the half-baked housing recovery. Hence we see another round of (perhaps deeper) instability ahead.
Adding to this perception is Moody’s today with an assessment of the corporate credit cycle:
Corporate Credit Is in Late-Cycle Mode
The composite speculative grade bond yield refuses to sit still. After bottoming at the 6.01% of late April 2015, the speculative grade bond yield would eventually climb all the way up to the 10.17% of February 11, 2016. Thereafter, the yield quickly sank to 8.26% by the middle of March, only to jump up to 8.61% by the end of March. However, by April 13, the spec-grade yield had quickly descended to 8.04%.
Because a continuation of subpar revenue growth is likely, high yield’s latest rally is susceptible to yet another reversal. After reaching Q3-2014’s 5.3%, the yearly increase of core business revenues (which exclude sales of identifiable energy products) slowed in each of the five subsequent quarters to the 1.4% of 2015’s final quarter. Recent data suggest that this metric may have improved to a still mediocre 1.9% annual increase for 2016’s first quarter. Nevertheless, the projected yearly increase by Q1-2016’s core business revenues falls noticeably short of the expected 4.8% yearly increase by private-sector wage and salary income and thus warns of a further narrowing by profit margins.
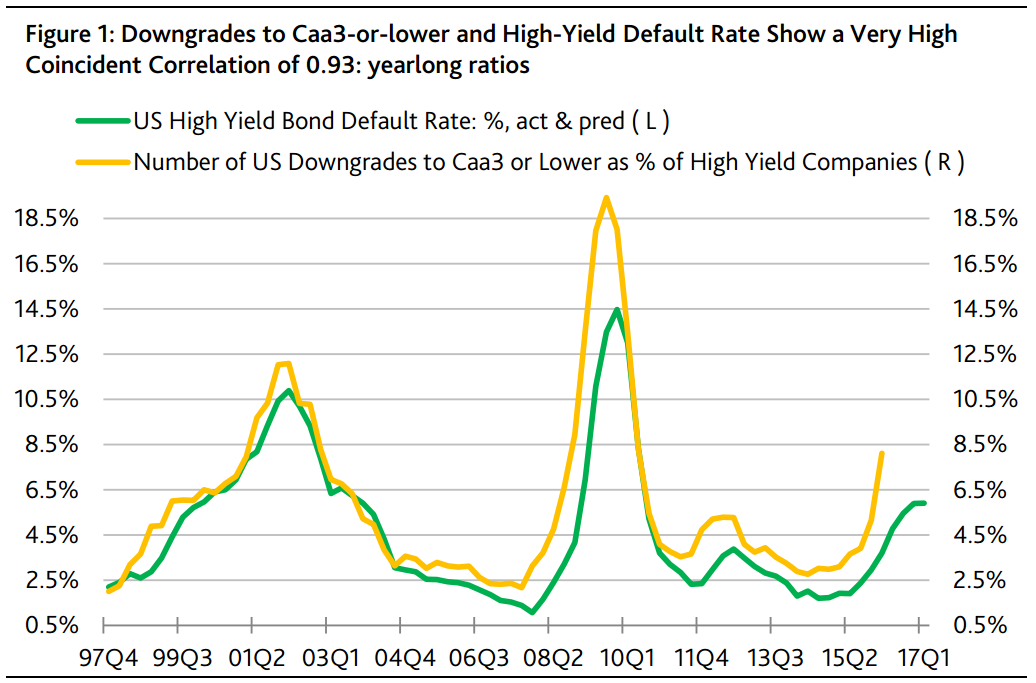
Steepest upswing by downgrades to “Caa3 or lower” since winter of 2008-2009 warns of more defaults
Narrower margins will probably reinforce the now rising trend of high yield defaults. The number of US company credit rating downgrades to the very low high yield rungs of Caa3 or lower jumped up from Q1- 2015’s 12 and Q4-2015’s 33 to 66 in Q1-2016, wherein 35 of Q1-2016’s 66 downgrades stemmed from oil & gas related difficulties. First quarter 2016’s number of downgrades to Caa3 or lower was the most since the 87 of Q2-2009. The number of downgrades to Caa3 or lower previously jumped up to at least 66 in Q1-2009.
The latest surge by downgrades to 66 strongly supports the realization of a roughly 6.0% high yield default rate six to 12 months hence. The correlation between the default rate and the yearlong number of downgrades to “Caa3-or-lower” lagged one quarter is a very strong 0.96. According to the latter relationship, the midpoint for Q3-2016’s expected default rate is now 6.5%. (Figure 1.)
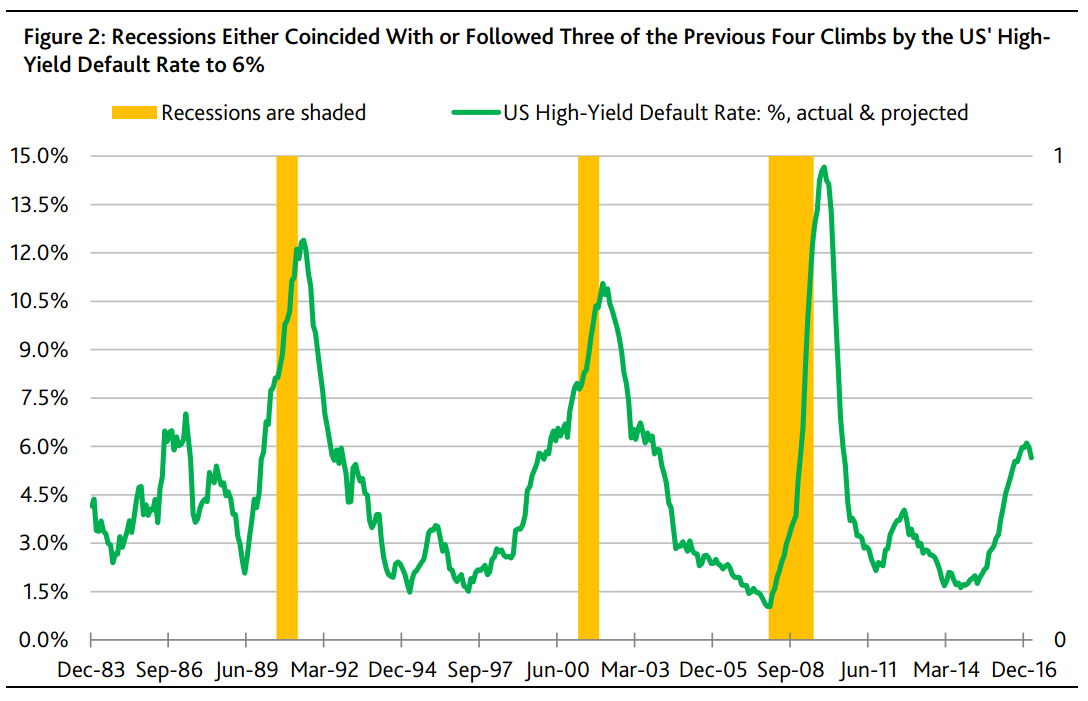
The record shows that the US high yield default rate first reached 6% in April 2009, March 2000, February 1990, and July 1986. Except for July 1986, the other three incidents either coincided with a recession or occurred within one year of a downturn.
Notwithstanding the high yield default rate’s 6.2% average of the year-ended June 1987, a recession did not materialize. Similar to the current situation, yearlong 1986’s average price of crude oil sank by -45% annually and was -60% under 1980’s then peak yearlong average. In addition, yearlong 1986’s average for Moody’s industrial metals price index was -34% under its average of yearlong 1980.
Unlike today, the Fed actively confronted the commodity price deflation of the mid-1980s. A drop in the fed funds rate from late 1985’s 8.0% to late 1986’s 5.88% and a slide by the 10-year Treasury yield’s yearlong average from 1985’s 10.6% to 1986’s 7.7% helped to alleviate the stresses of the mid-1980s. Today’s recent fed funds rate of 0.38% and 1.75% 10-year Treasury underscore the very limited scope for interest rate reductions as a means of rejuvenating stagnant expenditures. (Figure 2.)
Advertisement
A business cycle long in tooth, alright, the only question is how it shakes out, chronic as in the 80s, or acute, like every other cycle.
David Llewellyn-Smith is Chief Strategist at the MB Fund and MB Super. David is the founding publisher and editor of MacroBusiness and was the founding publisher and global economy editor of The Diplomat, the Asia Pacific's leading geo-politics and economics portal.
He is also a former gold trader and economic commentator at The Sydney Morning Herald, The Age, the ABC and Business Spectator. He is the co-author of The Great Crash of 2008 with Ross Garnaut and was the editor of the second Garnaut Climate Change Review.