David Murray warns of 1890s housing crash depression
God bless David Murray. Somehow this goes virtually unreported today:
The chairman of the government’s Financial System Inquiry, former Future Fund chairman David Murray, yesterday sounded a further alarm on the housing boom, saying a crisis on the scale of the 1890s great property collapse could not be ruled out. “What people should do is look at the 1890s, which was caused by a housing land boom,” he told The Australian. “To say it won’t happen and simply ignore it is wrong.”
Half of the nation’s banks closed their doors following the 1890s crash. “Many people say a crisis has a low probability of occurrence, but the problem with that view is that whatever the probability, the severity can be very high if it occurs,” Mr Murray, who is also a former Commonwealth Bank chief executive, said. “It shouldn’t be allowed to grow … it’s too big a risk to take.”
…Mr Murray called for the government to implement the FSI’s recommendation to ban superannuation funds from borrowing. The inquiry saw the ability of self-managed super funds to take on non-recourse loans to invest in residential property as a threat to stability, a view shared by the Reserve. It was the only recommendation from the inquiry rejected by the Abbott government.
Here’s the chart:
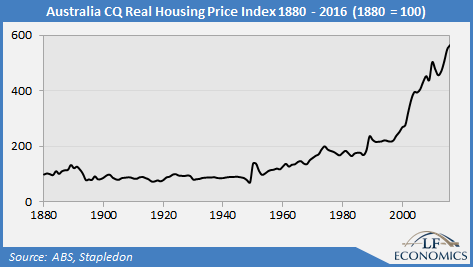
I’ve noted many times the sad truth that if you bought property near the 1890s peak then it took you seventy years to break even. But let’s look as well today at the economic fallout, from the RBA:
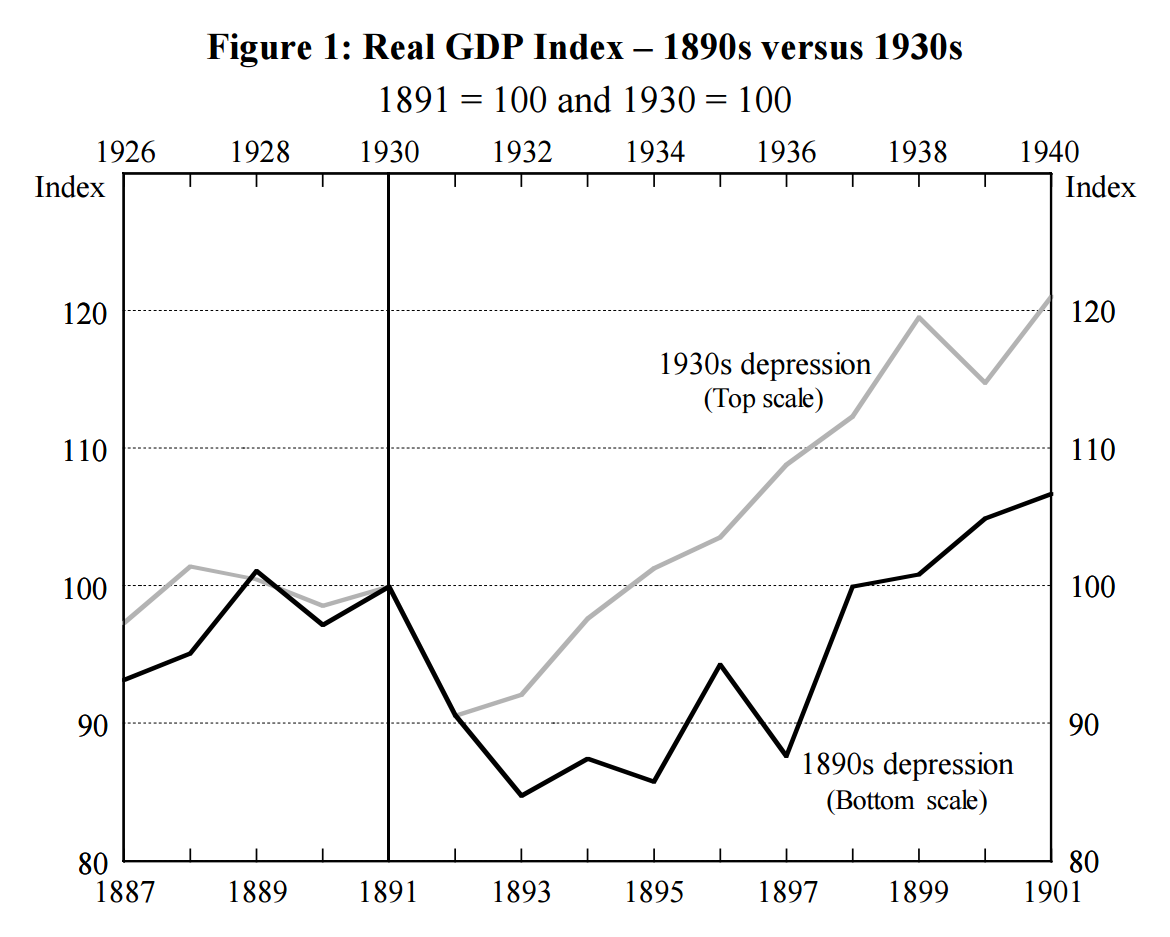
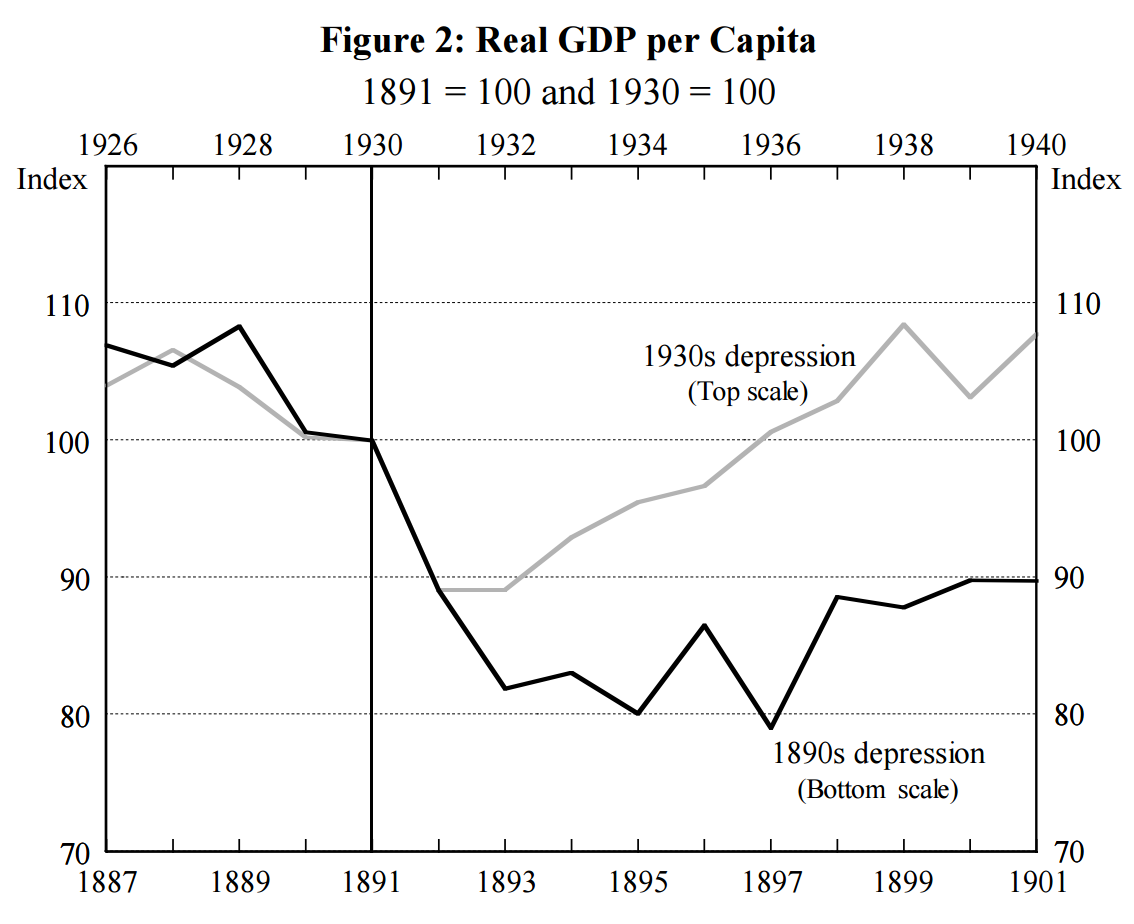
In Australia, real GDP fell by around 10 per cent in the first year of both depressions – that is, 1892 and 1931 respectively.5 However, the depression of the 1890s was substantially deeper and more prolonged than the depression of the 1930s (Figure 1). Real GDP fell by a further 7 per cent in 1893, coinciding with the collapse of the banking system. Growth returned in subsequent years, although it was moderate and erratic. It was not until 1899 that the level of real GDP had surpassed the previous peak set eight years earlier. In contrast, during the 1930s depression, growth resumed in 1932, and by 1934 the level of real GDP had surpassed the previous peak of 1930. Because of the relatively high rate of population growth during the 1890s,6 the 1890s depression was even deeper than the 1930s depression in terms of real GDP per capita (Figure 2). Real GDP per capita fell by around 20 per cent over the 1890s, compared with a fall of only about 10 per cent over the 1930s.
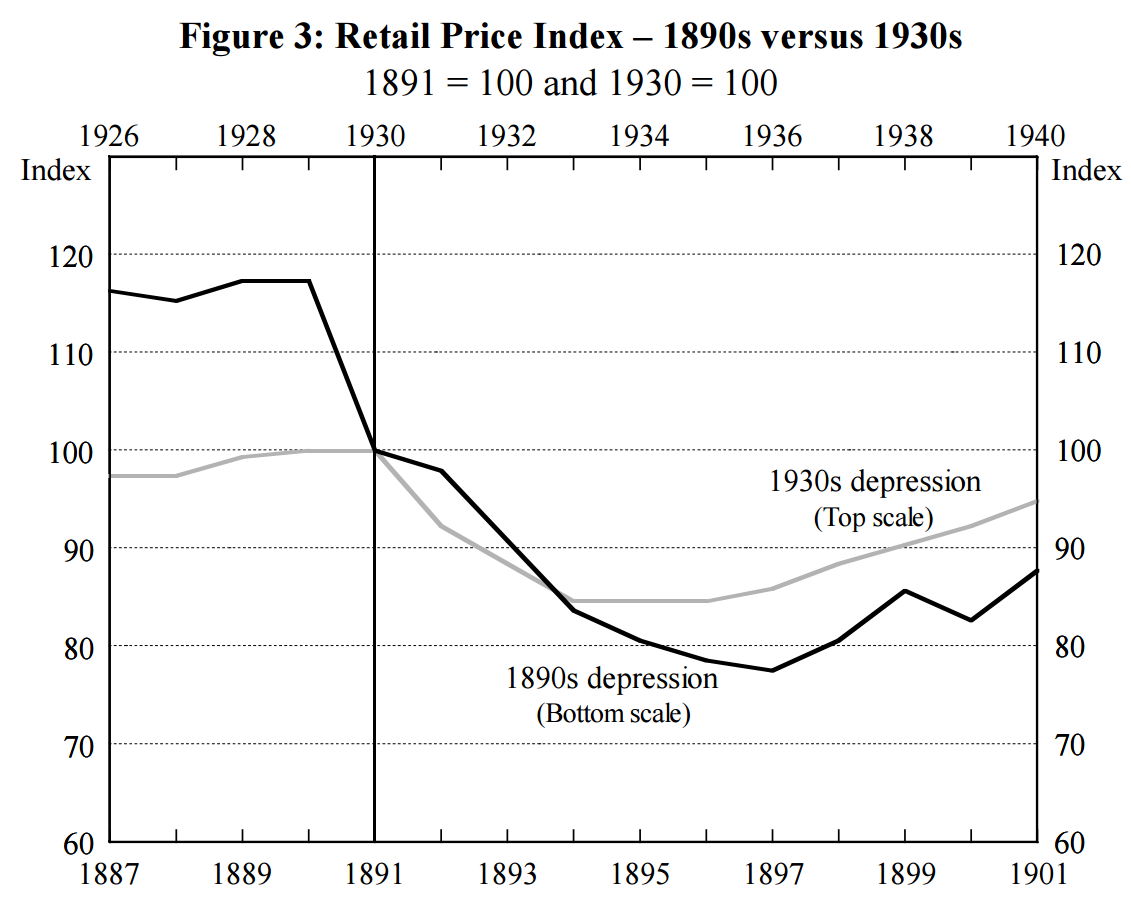
The corollary of a deeper, longer depression is more substantial and sustained deflation. Figure 3 shows that, from 1891 to 1897, retail prices fell by more than 20 per cent. By comparison, the fall in the 1930s episode was smaller at around 15 per cent, and over a shorter period – from 1930 to 1933. Figure 3 also shows that there was a large fall in retail prices from 1890 to 1891, before the downturn in output. This was due almost entirely to falls in house rents which constitute 40 per cent of this retail price index. As we mention in Section 3.2, the property market turned down in the late 1880s and was an important factor leading to the collapse of the financial system.
It seems reasonable to assert that the rise in unemployment and the fall in employment would have been worse during the 1890s than during the 1930s. However, this is difficult to establish because comparable data on unemployment in the 1890s and 1930s depressions are limited. Statistics on the employment status of trade union members indicate that unemployment peaked at almost 30 per cent in 1932; no comparable data exist for the 1890s depression. One series that is available in both periods is the unemployment rate for members of the Amalgamated Society of Engineers, Australia. This indicates that although the peak rate of unemployment was higher in the 1930s depression (almost 26 per cent in 1931 compared with 16 per cent in 1894), unemployment returned to pre-depression levels more rapidly as the economy recovered.
What caused the 1890s boom and bust?
The investment boom of the 1870s and 1880s was driven by a number of factors. Extremely high rates of population growth during the 1870s and 1880s helped to drive rapid real GDP growth – output was expanding rapidly through the application of imported capital and labour to the development of many previously unexploited resources and investment opportunities. However, productivity growth was not especially strong. That is, output per capita grew consistently, though not that rapidly – from 1861 to 1891, GDP per capita grew on average about 1 per cent per annum, compared with an average of almost 3 per cent per annum in the 30 years following the Second World War. A very high demand for housing was driven by population growth and bolstered by wealth accumulated in the agricultural sector and in the gold fields flowing back into the major cities. Underlying these developments in the private sector, governments were increasing spending on infrastructure such as railways and communications.
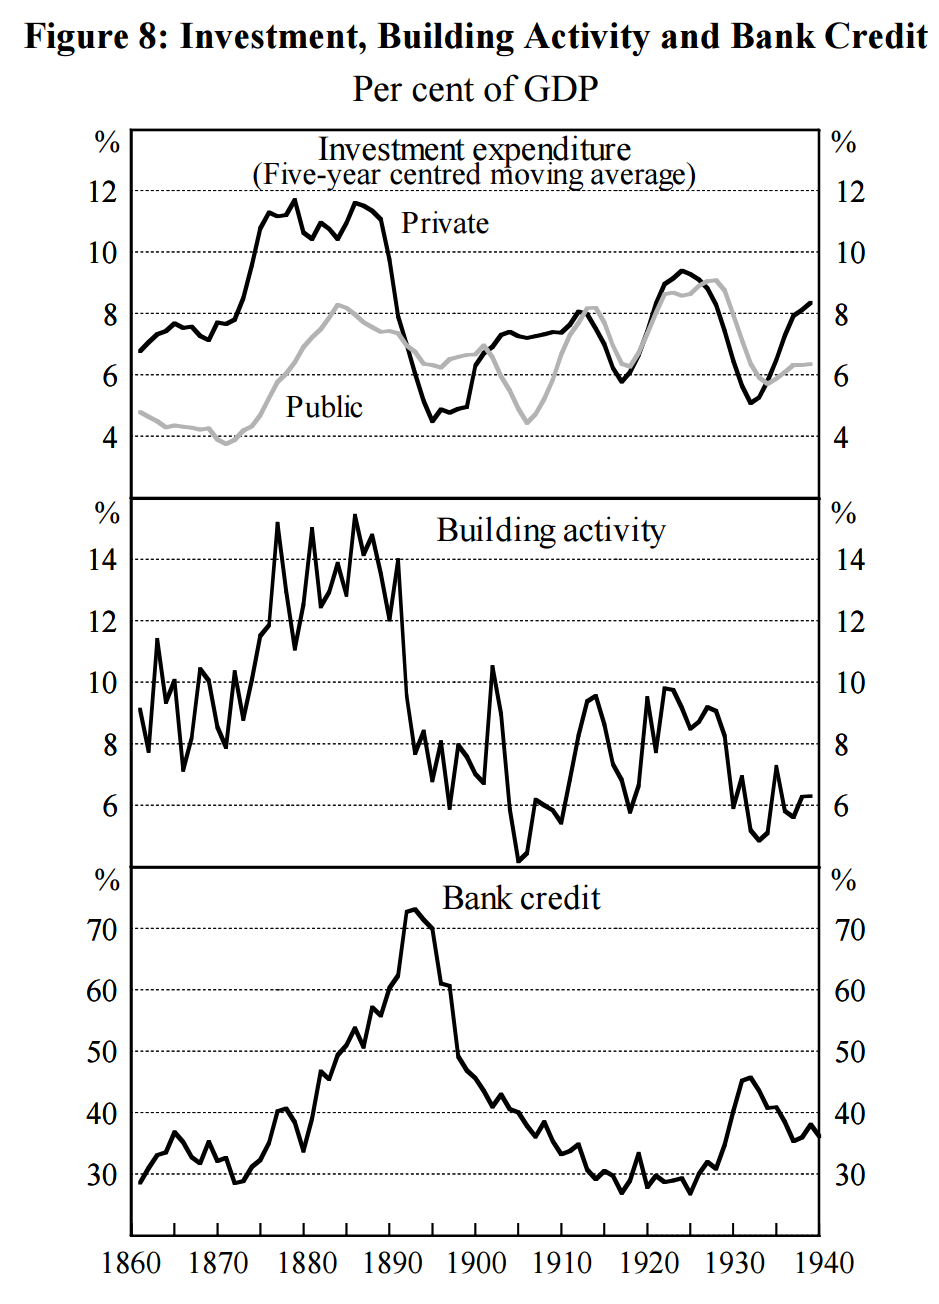
Therefore, it is not surprising that investment in the 1870s and 1880s was dominated by construction activity. The strength of construction over this period cannot be overemphasised since it represented the biggest building boom in Australia’s history (Figure 8). Much of it was concentrated in urban centres, especially Melbourne which was undergoing rapid expansion and was the focal point for speculation in the property market which eventually spread to other colonies (Boehm 1971). From 1875 to 1891, building activity as a share of GDP averaged around 14 per cent, compared with an average of only 9 per cent from 1920 to 1930.28 It would not be an overstatement to claim that this level of activity over the 17 years to 1891 represented the most extravagant of building booms. Even though population growth provided a fundamental reason for the construction boom of the 1870s and 1880s, building activity remained high even after the rate of population growth slowed markedly towards the end of the 1880s.29 This by itself was a source of instability.
That sounds eerily familiar, I know. When the commodities tide went out so did the immigration and foreign-funded debt that fueled the building and the result was calamitous:
In order to provide a rough approximation to movements in property prices we attempted to exploit data on the aggregate capital value of ratable properties in Melbourne and Sydney. Movements in this measure reflect changes in prices, as well as changes in the volume and quality of properties – both of which we would expect to be on an upward trend or at least not likely to decline rapidly. Figure 9 compares aggregate capital values over the two depression episodes for the cities of Melbourne and Sydney.32 Figure 9 suggests that price rises over both boom periods and in both cities were of similar orders of magnitude. However, this finding is at odds with contemporary and historical accounts of the two cycles.
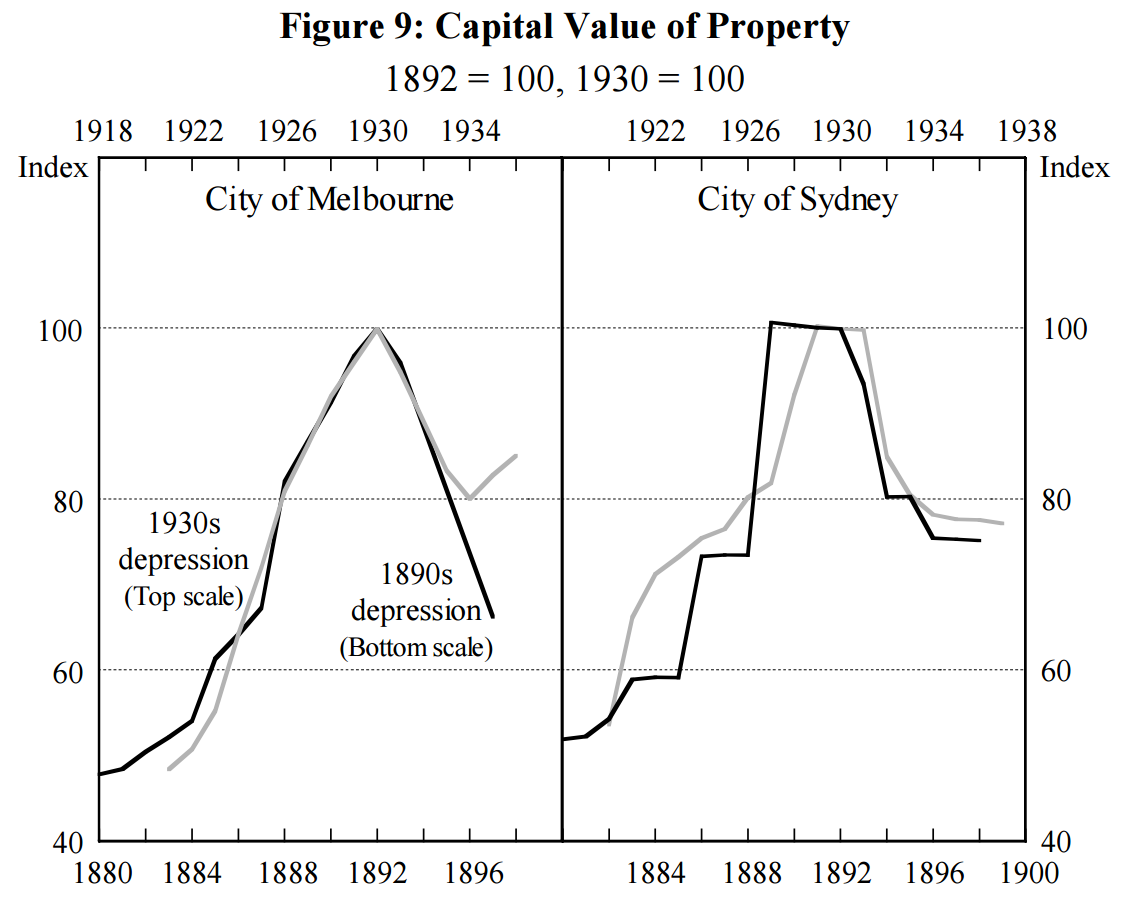
Note that the calamity was bought on by peak-to-trough fall in house prices of only one third.
So, what would be the difference today? Not enough is the answer. In both previous depressions monetary and fiscal policy were constrained as deleveraging seized the country. According to the RBA, the 1890s depression was much worse largely because the damage to the banking system was worse, thanks to its being much less stable:
Although there was a boom of sorts leading up to the 1930s depression, the same factors which led to financial instability during the 1880s were more muted, or operating in the opposite direction during the 1920s. For example, the rise in the share of bank credit to GDP was smaller and started from a lower base; the share of building activity in GDP was much lower, although there was still a sizeable increase in property prices; the ratio of trading bank advances to deposits was rising only slowly from a low base and capital inflows were not sustained at the same levels, nor for as long, as during the 1880s; a greater proportion of bank assets were being held in the form of government securities during the 1920s; and in contrast to the 1880s, trading banks were increasing both capital and retained earnings at a faster rate than their total assets.
It’s a moot point which comparison would make more sense today. Probably 1930s owing to the previous collapse of the non-banking sector in the GFC which has shifted most the debt to more stable savings banks.
The other major difference today is that we have a floating currency versus the gold standard of the past two depressions. The 1930s did see a 30% devaluation of local currency versus the standard which also helped cushion the shock. I put it to you that the fall would be more like 50% from today’s levels.
That means at least some of the shock would be absorbed, or transferred, from nominal to real prices and we would not only see an enormous crash in household wealth but also a gigantic and one off crash in living standards as everything imported literally doubled in price overnight. It is the equivalent of an enormous pay cut as inflation halved household’s purchasing power.
The odds of this happening are much higher than anyone really cares to divulge. In fact, given today’s uber-concentrated external reliance upon China and steel input prices, there is a certain inevitability to it. The major question is what time frame will it happen in? If it transpires over ten years of iron ore and coal deflation then it is possible to manage via a lost decade or two of no growth – which we’ve now seen for five years. But if that external correction comes suddenly, like for instance if China suddenly hit a debt and building brick wall, then it’s on like Donkey Kong as the terms of trade collapse triggers a housing bust and global repricing of Australian risk.
You really should read the full RBA history. And when you’re done start planning how to invest your wealth outside of Australia.
The MB Fund will launch in one month to aid you in that (it is 80% international assets at launch).
Register your interest today (if you have not already).
