
In last year’s Christmas special report, MB forecast four shocks for the Australian economy in 2016, namely:
- the continued global shakeout in commodity prices;
- the continued unwinding of the mining investment boom;
- falling housing construction and prices, which we forecast would commence from mid-2016; and
- the closure of the Australian car manufacturing industry – which would begin in October 2016 with the closure of Ford’s assembly operations, before worsening in 2017 as both Holden and Toyota shut down.
As it turned out, calendar year 2016 saw the Australian economy clock-up a quarter century of uninterrupted economic growth though at a lousy pace of just 1.7% (to Q3 and probably worse when Q4 is out). Given population growth was 1.42% to mid-year we’d say that was a pretty poor performance.
Even so, the economy probably performed better than we were expecting this time last year, thanks to two unexpected events. The housing market caught a second wind, as well as the arrival of an unexpected commodity price mini-boom, which saw renewed Chinese stimulus and a huge policy error by China’s authorities that cut coal production and drove strong iron ore and coal price rebounds, adding much needed (but temporary) support to Australia’s terms-of-trade and national income.
Perhaps the most remarkable story of 2016 is that we performed so poorly despite these unexpected tailwinds.
In this special report, we revisit the major themes driving the Australian economy and outline our case as to why Australia’s economic adjustment has been delayed rather than avoided.
The global context:
When we penned last year’s Christmas special report, the US economy was in moderate shape, China was slowing fast, emerging markets were in deepening crisis as the US Federal Reserve tightened and Europe was in recovery. Commodity prices were in free fall. The two coals – coking and thermal – had fallen by around 40% and 20% apiece over the year. Iron ore had roughly halved. The price of contract LNG had crashed about 60%. And base metals and soft commodities had also been drawn into the carnage.
Reflecting the above, the RBA’s Index of Commodity Prices had sunk by 23% over the year to be down 54% since peak.
We had expected the long bust to intensify in 2016 and end in a crisis washout that we dubbed the “Mining GFC” which we supposed would drive excess supply from the market in a balance sheet reckoning for major producers. As it happened, markets entered crisis much more quickly than we expected across the New Year as emerging market debt, oil and iron ore all crashed and base metals sank as well.
This crisis triggered three major commodity-related responses. First in the US, the Federal Reserve backed away from tightening which drove down the US dollar. Second, China unleashed a moderate fiscal stimulus driven by property and infrastructure spending. Third and a little later, OPEC capitulated on its market share strategy and drove up the oil price.
Good fortune then kicked in in Q4 when Donald Trump was elected to the US presidency and markets immediately priced fiscal stimulus that drove another up-leg in commodity prices.
Reflecting the above, the RBA’s Index of Commodity Prices has rebounded strongly, surging by 32% in the year to November 2016:
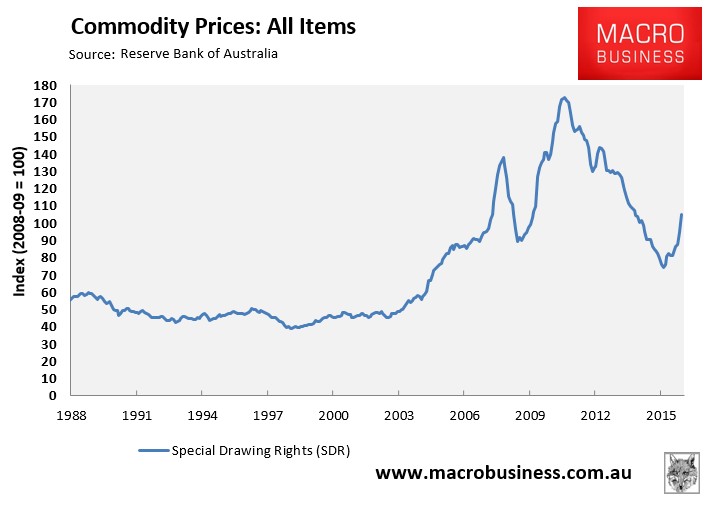
The RBA’s Index of Commodity Prices is now nearly double the pre-boom average, although it remains some 40% below the 2011 peak.
Yet we in no way see this as a sustainable rebound for Australia’s key bulk commodities. There are three reasons.
First, China has reversed its coal policy error and the two coals have already begun to deflate. As well, Chinese authorities are clearly impatient with their own stimulus now and are engineering a whole range of tightening measures to limit property prices, construction and runaway futures markets. We expect infrastructure spending to persist so there will still be some solid support.
Second, the election of Donald Trump and the shift within OPEC to supply restraint has materially upgraded the medium term outlook for the US economy and its interest rate structure, driven by fiscal spending and a renewed shale oil boom. That has triggered a renewed USD bull market and we expect that to be the dominant global story of 2017, augmented by slowness to tighten in Japan, a falling Chinese yuan and a broken European Union. Global financial conditions are already tightening fast, as they do whenever the US dollar rises materially, especially in emerging markets and China in particular via its currency peg. It is emerging markets that produce and consume most commodities so that slowing will impact global commodity demand growth despite the US uplift.
Third, supply is still coming on stream for the major commodities, even more so with such high prices in 2016 and falling commodity currencies in 2017.
There is a risk that this process turns unruly. The US outlook is so strong relative to other developed economies – owing to monetary and fiscal stimulus plus a renewed shale oil boom – that the USD may rise very quickly and trigger disorderly outflows from EMs, specifically China. This would be dramatically exacerbated in the event of Trump trade sanctions aimed at China. It’s a tail risk but a real one.
Moving to specific commodities, for iron ore:
- 2016 Chinese steel output ended 2016 up roughly 10mt on 2015. This is nowhere near enough to justify the doubling of the price that has transpired.
- That can be explained largely by the role of forex speculators hedging a falling yuan in Chinese metal futures markets and by rising inventories.
- Chinese authorities have fought but lost against this hot money flow all year. We expect them to win next year as a tilt in the supply balance turns to their aid.
- On the demand side, we expect Chinese steel output to reverse some or all of the 10mt growth as its housing market slows (though infrastructure will remain strong).
- On the supply side, iron ore will see 50mt of low cost new supply in 2017 from Roy Hill, Vale and Sino. It’s possible that 19mt will return from Samarco later in the year.
- Any time that iron ore is above $50 it can also stimulate far flung supply from Africa, India, South America and internally in China. We have seen roughly 50mt return this year already and more will come in H1 2017 if prices stay high.
- By Q3 we expect iron ore to return to $50 and below. By Q4, we will know if Xi Jinping is serious about resuming reform, which is still probable, so we see iron ore ending the year even more weak.
For the two coals the story is similar:
- China has reversed its supply side coal policy error and supply is responding.
- Its inventories are rebuilt.
- We see coking coal at $120 per tonne and thermal at $60 by year end 2017.
For LNG, the story is perhaps more promising but not much. The new oil order is quite clear. OPEC cuts will trigger a renewed boom in US shale that will cap the Brent rebound below $60. This is an improvement but is still far short of a price that would justify the construction of Australia’s enormous LNG white elephant plants today. They will produce no tax revenue, little in new volumes until late in 2017 when Wheatstone and Ichthys come on stream, and oil and gas are roughly trade neutral for Australia anyway. Meanwhile they continue to shed labour as they shift from construction to production.
The other major contributor to Australian income is gold. We see it as weak and getting more so in 2017 as the USD bull market weighs.
The upshot for Australia’s terms-of-trade, which measures the ratio of export prices to import prices, is that the big 2016 rebound is at already past its peak and bound for a steep reversal next year:
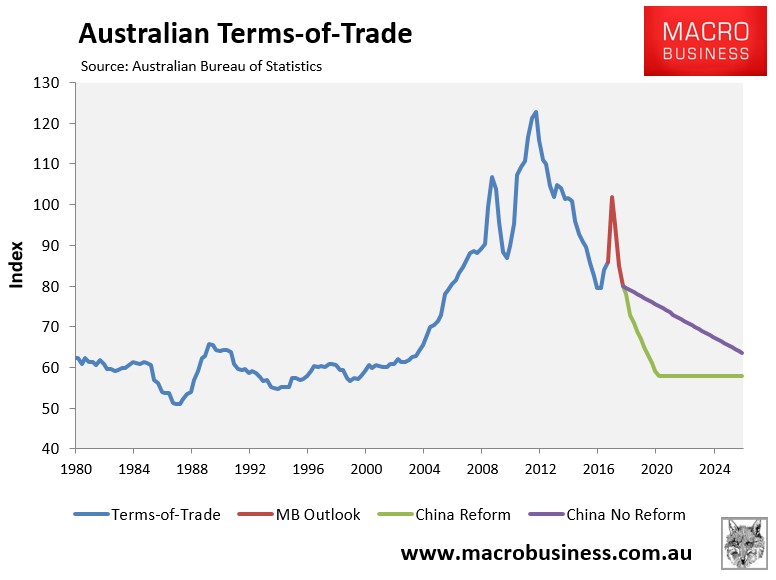
Beyond that, the next phase of historical mean reversion in commodity prices will be determined by the pace of Chinese reforms efforts. In the final days of 2016, Chinese President Xi Jinping sent a major signal that his intention was to press on with reform, via Bloomberg:
President Xi Jinping isn’t wedded to China’s 6.5 percent economic growth objective due to concerns about rising debt and an uncertain global environment after Donald Trump’s election win in the U.S., according to a person familiar with the situation.
Xi told a meeting of the Communist Party’s financial and economic leading group this week that China doesn’t need to meet the objective if doing so creates too much risk, said the person, who asked not to be named because the discussions were private. Leaders at the gathering agreed that the $11 trillion economy would remain stable with slower growth as long as employment stays firm, the person said.
Australia’s income shock forestalled:
Turning now to the Australian economy, the first major impact of the above rebound in commodity prices and the terms-of-trade has been to halt Australia’s income recession.
As shown in the next chart, real national disposable income (NDI) per capita rebounded in the year to September 2016, rising by 1.7% in trend terms:
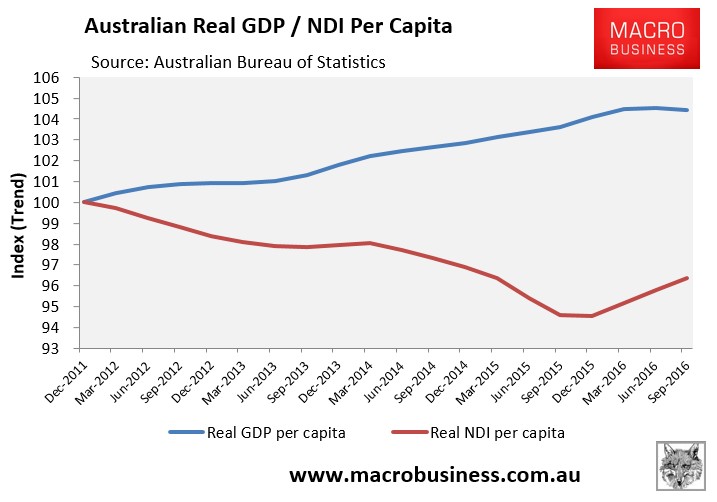
Essentially, after growing at almost twice the pace of output, as measured by GDP, between September 2003 and December 2011, the blue line (real GDP per capita) and red line (real NDI per capita) all but converged in the next chart. However, over the past three quarters, these measures have diverged once more due to the resurgent mini-boom in commodity prices and the terms-of-trade:
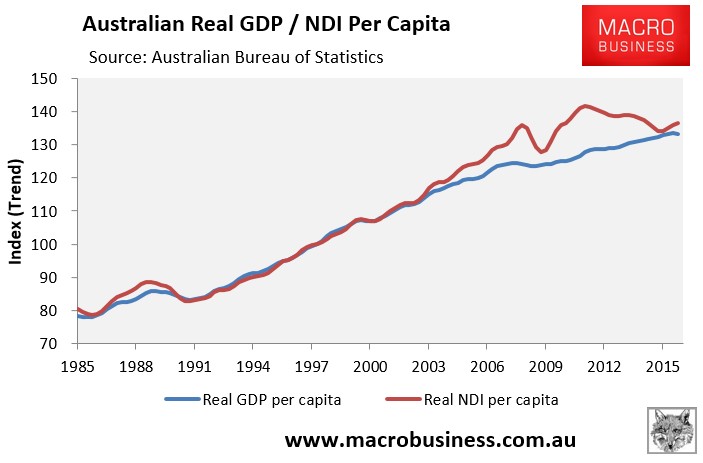
When the mini-boom in commodity prices reverses – likely from mid-2017 – the national income shock that has besieged Australia for almost five years will reassert itself, with the rot unlikely to stop until the terms-of-trade has bottomed.
While national income rebounded over 2016, household incomes remain under acute pressure.
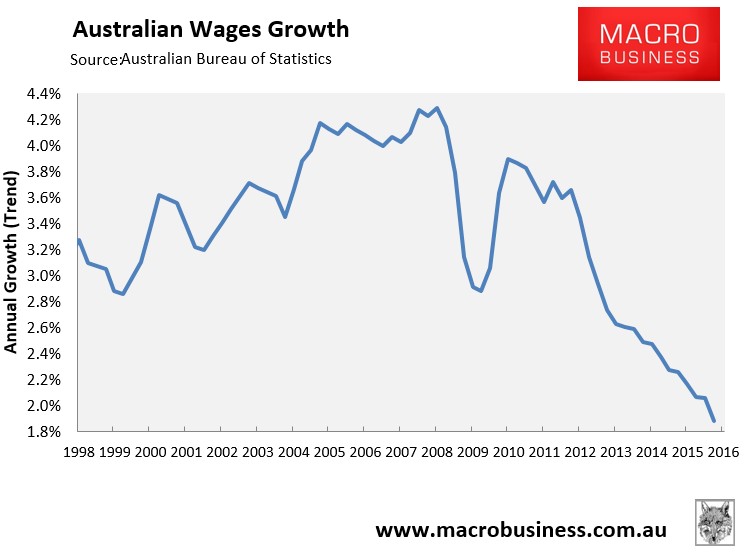
The Australian Bureau of Statistics’ (ABS) labour price index for the September quarter revealed that wages growth is running at the lowest level on record (1997), with wages nationally increasing by just 1.9% in the year to September 2016:
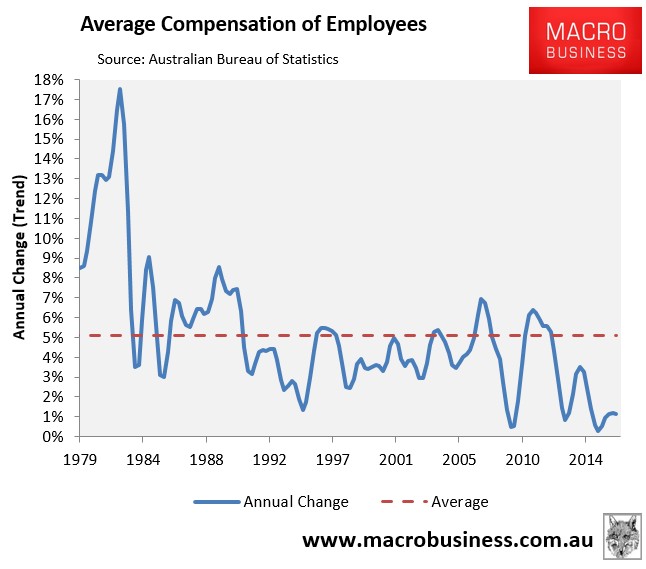
Whereas the average compensation of employees was tracking at an anaemic 1.1% in the year to September 2016:
Part of the reason for the slump in actual earnings is due to the rotation from high paying jobs (e.g. mining-related) into low paying jobs (e.g. services-related), as well as the casualisation of the workforce.
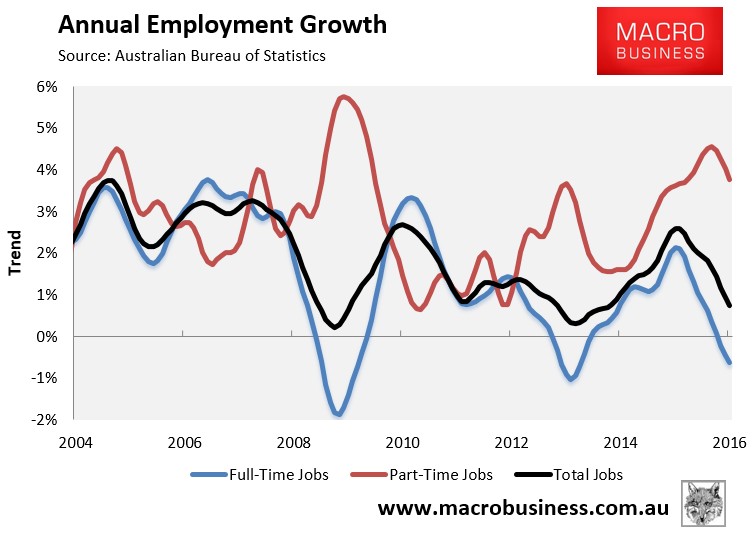
As shown in the next chart, trend annual employment growth weakened considerably in 2016, with full-time jobs actually falling by 0.6% in the year to November, offset by 3.8% growth for part-time jobs:
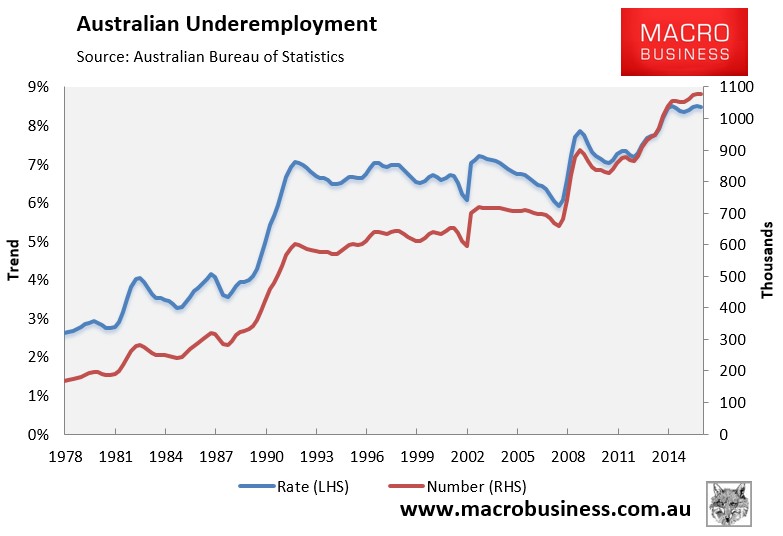
Reflecting the casualisation of the Australian workforce, underemployment was also at a record high 1.1 million people (8.5%) as at November 2016:
Mining investment bust rolls on:
Unfortunately, the rotation into lower paying jobs is likely to roll-on, which will continue to undermine household incomes.
By our calculations, Australian mining investment is less than two-thirds of the way through its adjustment, as shown in the next chart:
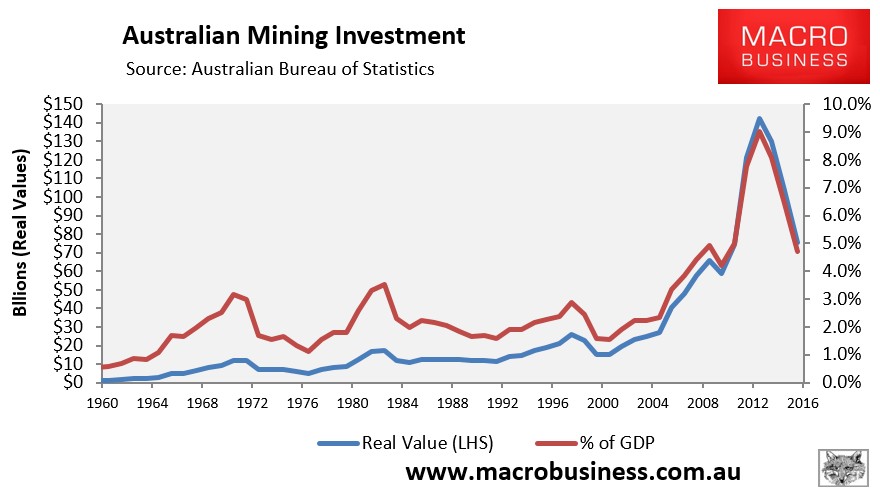
From a long-run average of around 2% of GDP, mining investment hit a peak of 9.0% of GDP in June 2013, and was tracking at 4.7% of GDP as at June 2015.
Our forecast remains that mining investment will retreat to around 1.5% of GDP once the current pipeline of projects are all but exhausted in 2018. This is around the level reached after previous (albeit smaller) booms. There is a clear risk, however, that mining investment could undershoot the long-run average and retrace to around 1% of GDP, as was the case after the 1970s commodity boom.
While output (GDP) will be supported as rising commodity exports offset reduced investment, the implications for employment are highly unfavourable.
To get a sense of the employment shift taking place, as well as the likely impact on mining communities, one only has to consider the outline of jobs at Western Australia’s two LNG projects, which are still under construction:
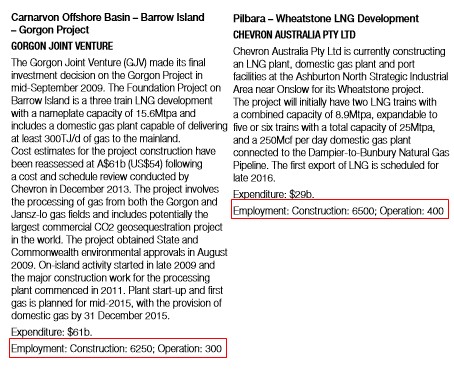
As shown above, the construction phase of an LNG project is some 20-times larger than during the operational phase. Add indirect employment – services in and around the projects, off sight mining services and engineering, and the like – and the employment impacts multiply.
Whatever the case, over 2017 and 2018, thousands more workers in mining-related industries will be made redundant and forced either onto the unemployment queue or into lower paying jobs in the services sector, many on a part-time basis.
Housing “rebalancing” on its last legs:
Along with the unexpected commodity price rebound, Australia’s housing market is the other area that surprised on the upside in 2016.
When we penned last year’s Christmas special report, Sydney’s auction clearance rate had collapsed to around 50%. Values nationally had also recorded the biggest quarterly decline since December 2012. And investor demand was falling following the Australian Prudential Regulatory Authority’s (APRA) introduction of a 10% ‘speed limit’ on investor loan growth. In short, there were clear signs that the housing market was turning the corner.
The same goes for dwelling construction. At the time of last year’s Christmas special report, dwelling approvals had trended down for eight consecutive months after peaking in March 2016. This led us to believe that actual construction would begin to turn down sometime around mid-2016.
Clearly, we were wrong on both counts. Instead of deflating from mid-2016, both prices and construction have surged new record highs.
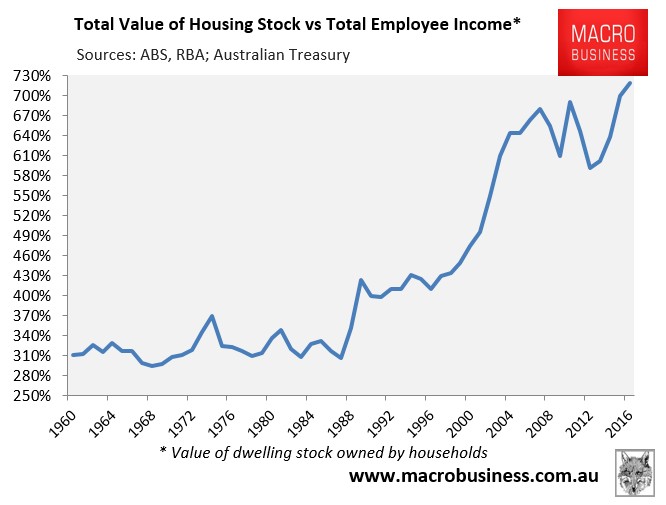
The total value of Australia’s dwelling stock was an all-time high 7.2 times incomes as at September 2016, up from 7.0 times incomes the year prior:
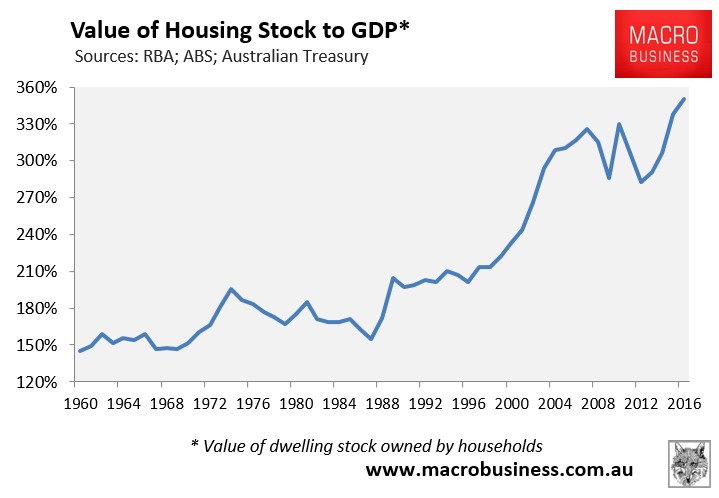
Similarly, the ratio of dwelling values against Australian GDP hit a record 3.5 times as at September 2016, up from 3.4 times GDP the year prior:
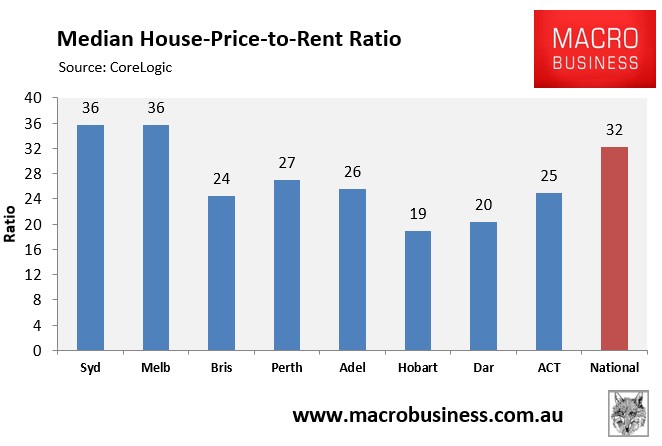
Australia’s capital city house prices also rose to a record high 32-times times rents as at November 2016, up from 29-times rents in November 2015, according to CoreLogic.
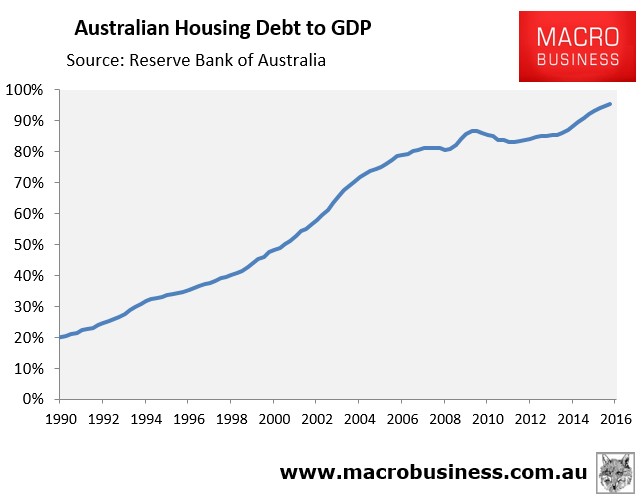
Meanwhile, the mortgage debt supporting Australian housing hit an all-time high 96% of GDP as at September 2016, up from 92% of GDP a year earlier:
However, the cracks are widening under the surface of Australian housing market following four-and-a-half years of strong growth.
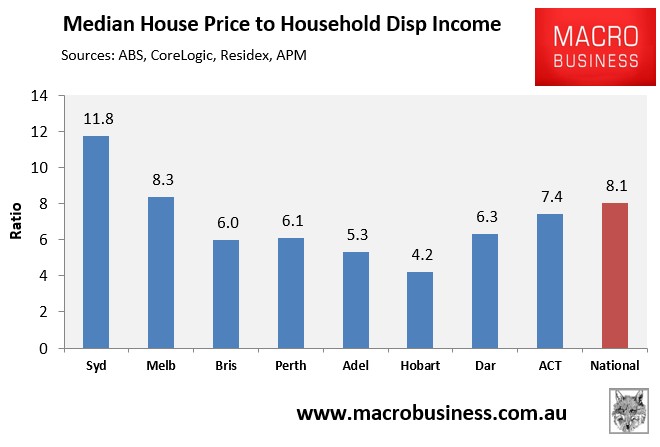
The boom has become increasingly narrow – concentrated in just Sydney and Melbourne – where valuations are extreme:
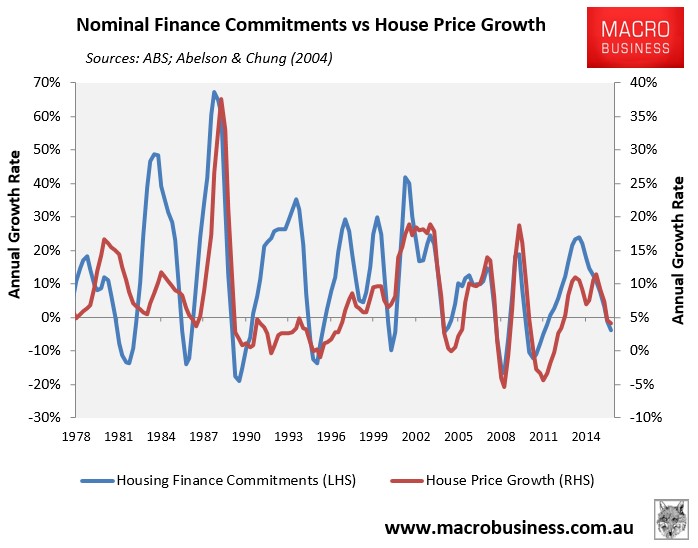
The ongoing rise in house prices has also occurred against the backdrop falling housing finance commitments, which historically have tracked price growth closely:
Meanwhile, transaction volumes have contracted sharply, suggesting a situation whereby housing prices have risen so much that the number of people able to participate in the market – both buyers and sellers – has shrunk:
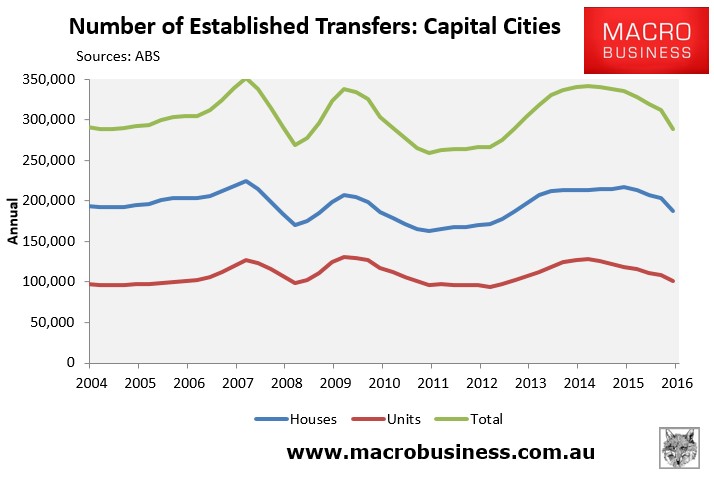
Transaction volumes have also historically tracked dwelling prices closely, suggesting softening price growth in the year ahead:

Dwelling construction also received a second wind in 2016, thus helping to support jobs and growth across the East Coast capitals.
As shown in the next chart, dwelling approvals surged through the first half of 2016, hitting a double-top in June, before retracing sharply over the following four months to October:
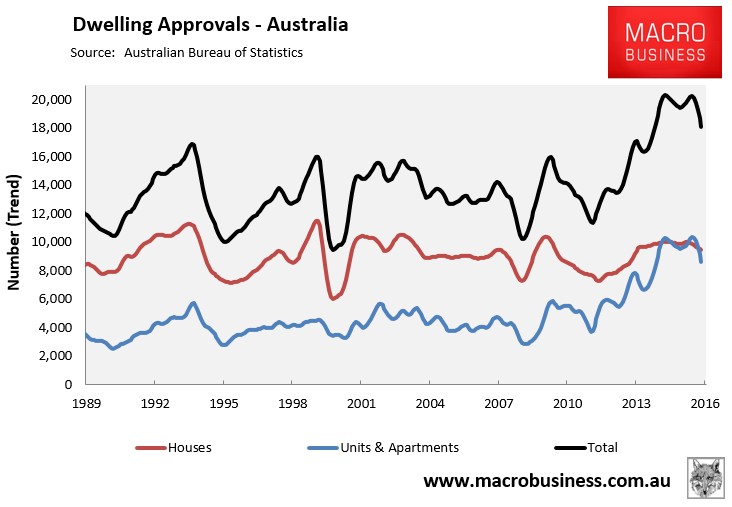
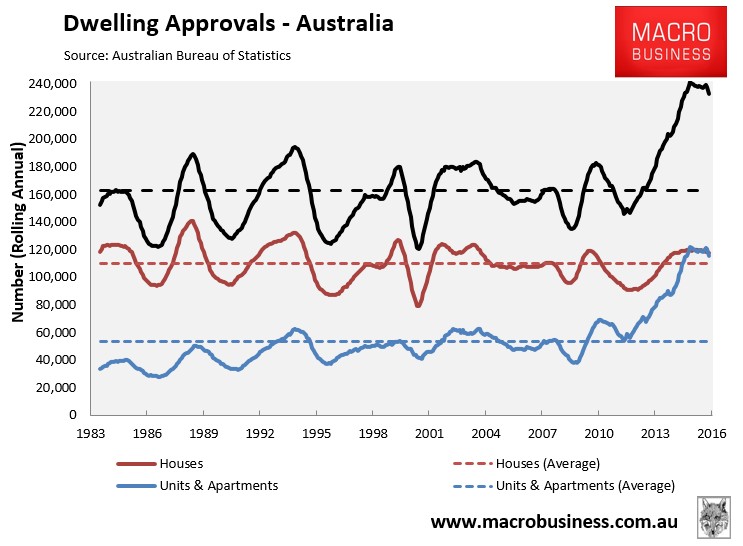
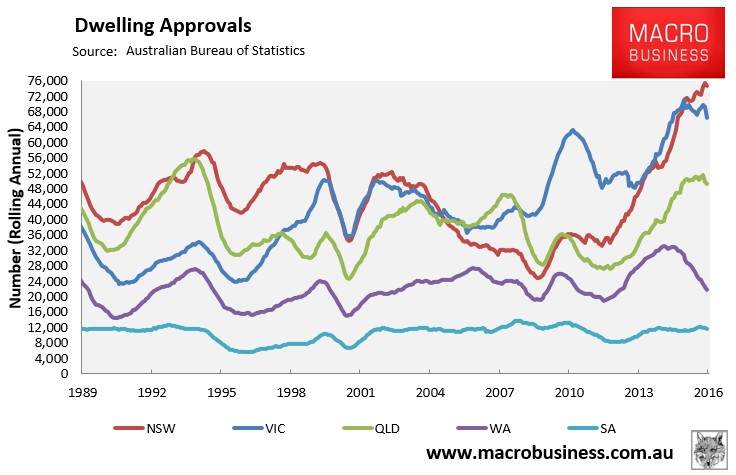
Nevertheless, annual approvals are stuck just below record highs:
Driven entirely by the East Coast capitals:
And primarily by an unprecedented boom in high-rise apartments:
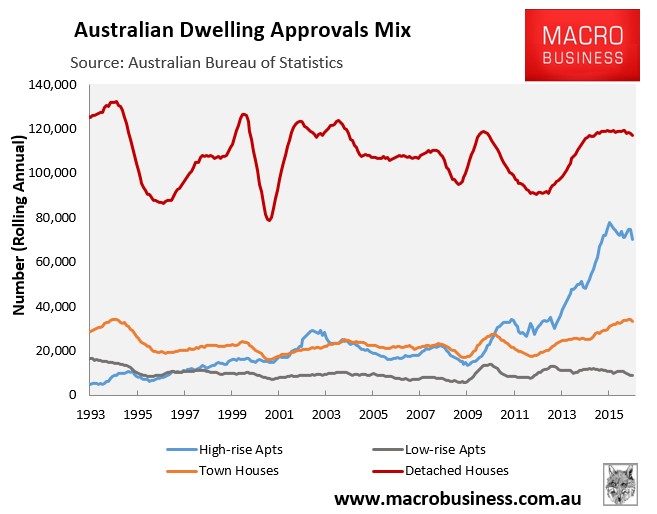
As shown in the next chart, the lag between dwelling approvals and commencements has typically been around one quarter only, whereas there is typically a six quarter lag between when high-rise apartments are commenced and completed, according to the ABS:
Thus, it takes the better part of two-years to run a high-rise apartment project from approval to completion, which reflects the scale and complexity of the construction involved.
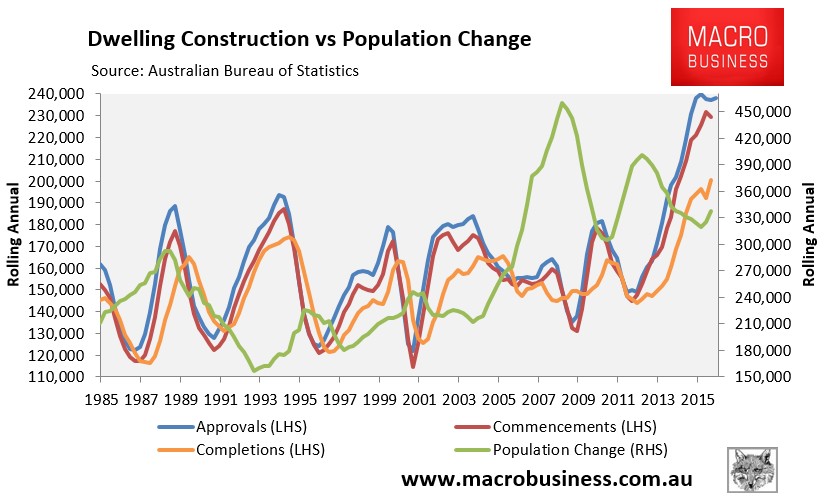
The volume of Australian dwelling completions are running way behind commencements, suggesting a huge volume of stock will hit the market in 2017, before actual dwelling construction activity first peaks and then begins to unwind either late 2017 or early 2018.
According to Westpac, there were 115,000 high-rise apartment dwellings under construction as at October 2016, which is likely beyond the capacity of the market to absorb, given current population growth (see above chart).
Concerns about a budding apartment glut have been voiced from numerous quarters, including the RBA, CoreLogic, BIS Shrapnel, and Australia’s banks (among others), who have warned of settlement risks and the potential for developers going bust.
There are two main implications for the housing market and economy.
First, the impending flood of supply across Sydney, Melbourne and Brisbane is likely to weigh on housing valuations which, in the case of Sydney and Melbourne, are already at extreme levels. Lower price growth – or outright falls – will also weigh on consumption spending, which has been the key driver of the economy since the the end of the mining boom.
Second, once the construction cycle turns, it will weigh heavily on employment. There are currently nearly 1.1 million Australians (9% of the workforce) employed directly in the construction sector, which has increased from around 700,000 at the beginning of the mining boom:
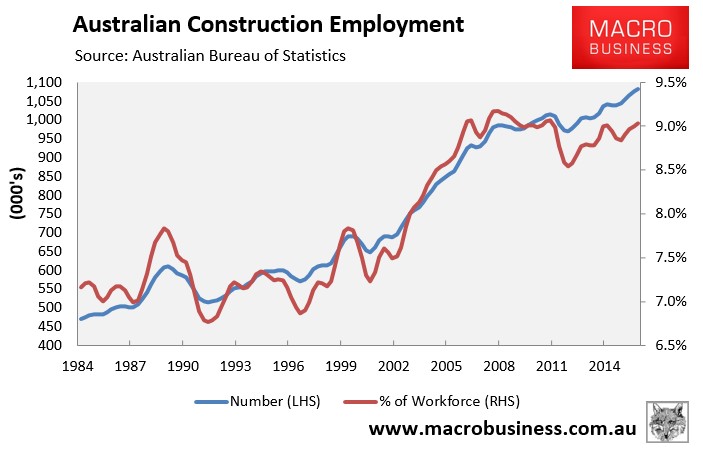
To date, the the dwelling construction boom has offset the decline in mining investment. However, by the end of 2017, we are likely to see employment activity in the housing construction industry finally begin to unwind, dragging on jobs growth in unison with the cratering of mining investment.
More broadly, the monster-sized boom in Sydney and Melbourne dwelling construction and prices has tilted Australia’s economic activity towards these jurisdictions.
The annual state accounts showed that New South Wales and Victoria were the key drivers of Australian GDP in the year to June 2016, growing by 3.5% and 3.3% respectively; albeit driven to a significant extent by strong population growth:
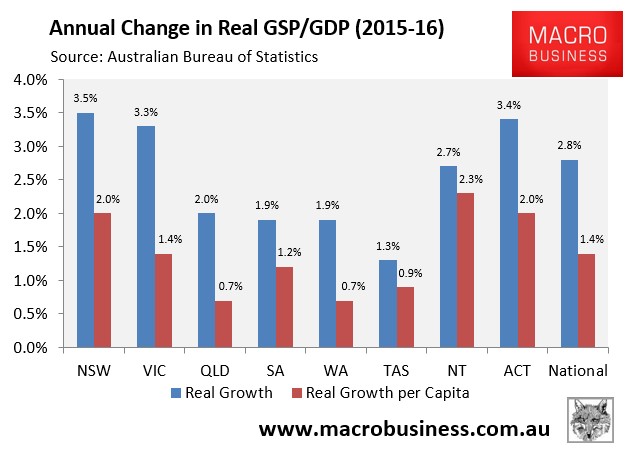
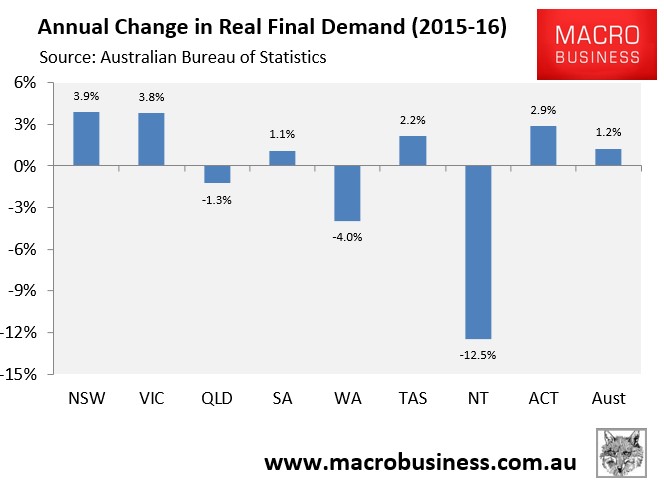
Excluding net exports, their contributions to the nation’s economy was even greater, with New South Wales’ final demand growing by 3.9% in the year to June 2016 and Victoria’s growing by 3.8% – more than offsetting weakness across most other jurisdictions:
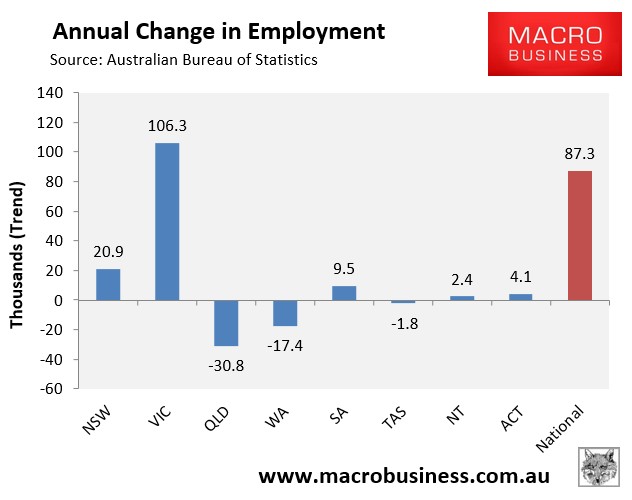
Their impacts on employment growth was greater again. In the year to November 2016, employment in New South Wales and Victoria grew by 127,200 combined, more than offsetting a 34,100 contraction in employment across the rest of Australia:
It is clear from the above that Australia’s economy has become increasingly unbalanced, hinging on one sector (housing) in two states (New South Wales and Victoria) to deliver both employment and growth.
With another mining boom unlikely to return for decades, given the massive supply capacity already built, the obvious question is: what will drive employment and growth across the Australian economy once the bubble in both prices and apartments inevitably unwinds?
We posed the same question in last year’s Christmas special report, and the main thing to change since then is the day of reckoning for the housing market was pushed-out another year or so. The upshot is that the Australian economy now faces an even larger correction once the housing market inevitably turns, given the greater overvaluations in Sydney and Melbourne, higher debt loads, as well as the bigger pending oversupply of apartments.
Services won’t save us:
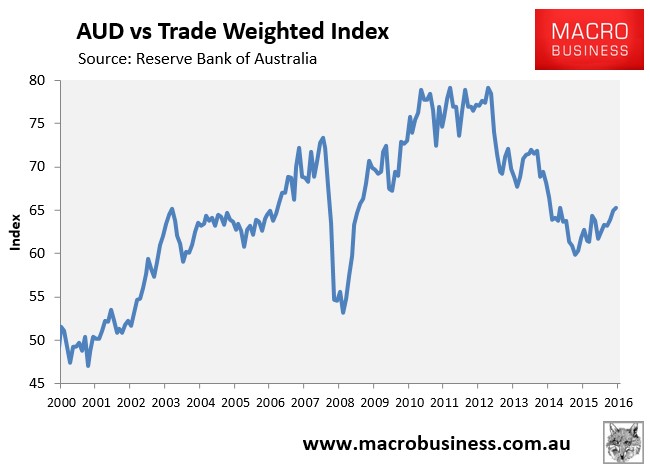
The high Australian dollar (AUD) continues to impede Australia’s non-mining tradeable economy. Since bottoming-out in September 2015, the Australian dollar has rebounded by 9% against the trade-weighted index:
The elevated AUD for more than a decade has caused both import-competing and export industries to be hollowed-out.
The most obvious example of the impact from the high AUD is the closure of Australia’s automotive assembly industry. In October 2016, Ford closed, and Australia’s last remaining vehicle assemblers – Toyota and Holden – are scheduled to shutter in 2017, thus ending nearly a century of production.
Estimates of the employment impacts from the car industry’s closure vary widely, but range from 40,000 jobs lost to 200,000, with most of these in Victoria and South Australia. A lot will depend on the ability of Australia’s parts makers to transition into other products, which again will require a much lower AUD.
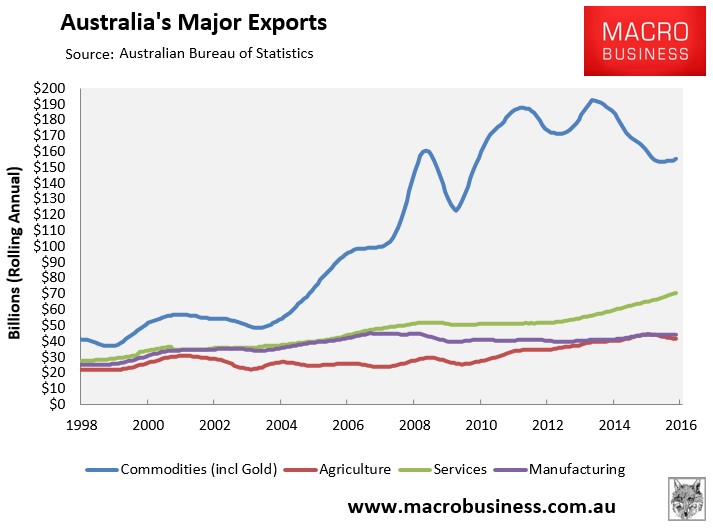
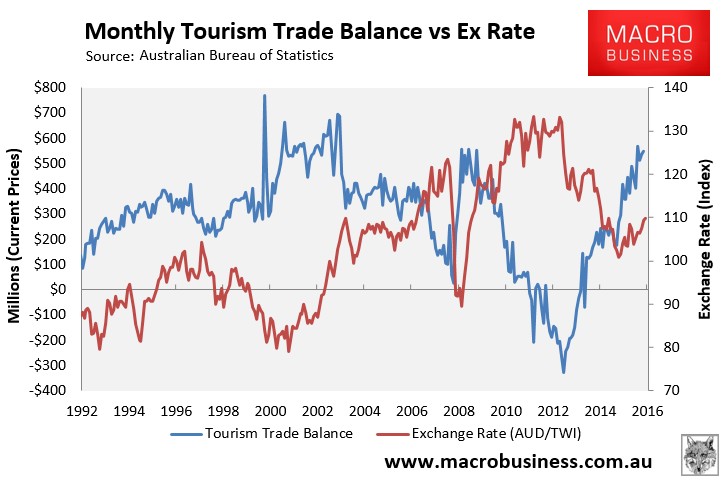
Outside of housing, Australia’s services sector has been designated the saviour of Australia’s rebalancing. And there is some evidence of this occurring with services exports offsetting to some degree the fall in Australia’s major resource exports:
Driven largely by a rebound of net tourism exports, brought about by the lower AUD over the past four years:
Nevertheless, despite the improvement, Australia’s services trade remains in deficit to the tune of $7.4 billion in the year ended October 2016:
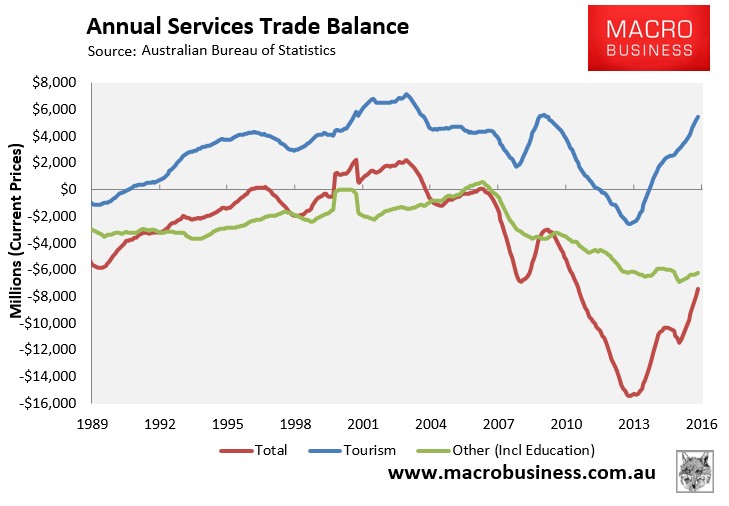
In fact, the last time Australia recorded a services trade surplus was briefly in 2007 and before that between 2000 and 2004 – in both cases when the AUD was at lower levels than currently.
Clearly, a much lower AUD is required if Australia is to regain non-mining competitiveness and drive a sustainable rebalancing away from both mining and housing. And even then it will be very time consuming and costly to rebuild the industries that have been gutted over the past 12 years.
Policy ammunition is nearly exhausted:
Since last year’s Christmas special report, the RBA has cut the official cash rate (OCR) by another 0.5% to an historical low of 1.5%. However, the fall in the OCR has not translated into variable mortgage rates, with banks only passing on a fraction of the rate cuts.
As shown in the next chart, the average discount variable mortgage rate applying to owner-occupiers has fallen only 0.15% since July 2015, whereas for investors it has actually risen by 0.1%, due to action by the Australian Prudential Regulatory Authority (APRA), which forced an increase in investor mortgage rates from August 2015 (green line below):
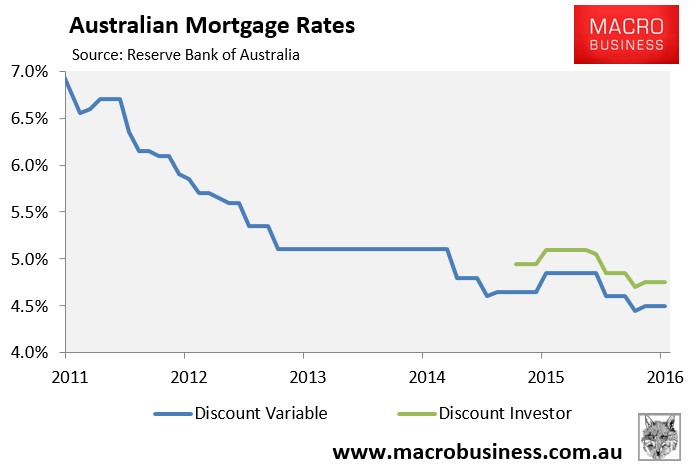
Moreover, just this month the major banks announced that they would again raise investor and/or interest-only mortgage rates independently from both the OCR and owner-occupiers.
By our estimation, the RBA has only around 100bps of cuts to the OCR left in the chamber (we can’t go to zero owing to the current account deficit), and there is every likelihood that the banks will keep at least half of the cuts owing to ongoing regulatory action, as well as potential rising bank funding costs. We see one two more rate cuts coming in 2017.
Fiscal stimulus is also likely to remain scarce in 2017. Australia’s AAA sovereign rating depends upon the government demonstrating a clear path to surplus across the cycle. That is what reduces the public debt stock to GDP ratio, which is the measure that the rating agencies monitor for balance sheet strength.
Despite the unexpected rebound in commodity prices in 2016, the Budget black hole continues to deepen on the back of weaker than anticipated wages growth. Once the latest commodity mini-boom reverses, as we expect from mid-2017, the terms-of-trade will again weigh on national income, nominal GDP and Budget revenues.
These headwinds have not been lost on the ratings agencies, with Standards & Poors in November reiterating that Australia is on negative ratings watch and stating that it “will continue to monitor, over the next six to 12 months, the success or otherwise of the new government’s ability to pass revenue and expenditure measures through both houses of Parliament”.
In short, Australia’s sovereign AAA-rating is skating on very thin ice and is a whisker away from being lost. This will impede the federal government from raising spending any further to support demand.
Moreover, because the government’s balance sheet guarantees the major banks’ offshore funding, they too will be downgraded when the inevitable sovereign downgrade arrives.
While the Australian banks use of offshore funding to underpin mortgage growth has moderated slightly over the past year, it remains at an extraordinary 53% of GDP as at September 2016, easily above the pre-GFC peak (51%):
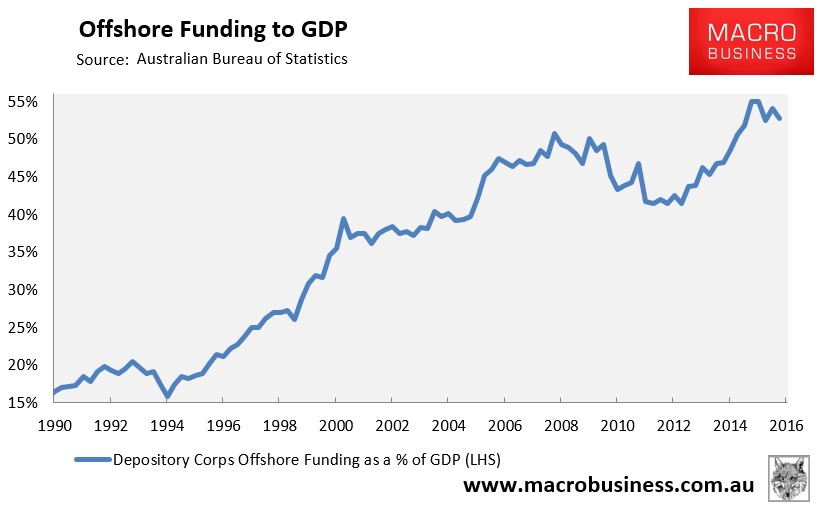
The ever-present danger is that the banks’ ability to continue borrowing from offshore rests with foreigners’ willingness to continue extending them credit. This willingness will be tested when Australia’s sovereign credit rating is downgraded (automatically downgrading the banks’ credit ratings), there is a global shock, or a sharp deterioration in the Australian economy (raising Australia’s risk premia).
Conclusions for Australia:
2016 was a year of ‘extend and pretend’ for the Australia, with the mini-boom in commodity and the housing second-wind riding to the economy’s rescue and forestalling the inevitable adjustment. The tail end of that “can kick” will persist through Q1 2017.
However, the mini-boom in commodity prices is expected to unwind all year as China slows at the margin, global commodity supply continues to expand, and the speculative bubble in commodity prices ends. These trends will be driven by both Chinese policy and a stronger US and its dollar.
The boom in housing construction will plateau through the year and likely be withdrawing from growth by Q4 2017 or early 2018 as the epic pipeline of apartments under construction empties and new supply hits the market en masse. This presents an entirely new “capex cliff” for the economy to absorb, along with yet more labour market slack, weak incomes and stalled property prices, with no obvious offset.
These two events will collide with the ongoing decline in mining investment – which won’t bottom-out until 2019 – along with the closure of Australia’s last two automotive manufacturers – Holden and Toyota – late in the year.
There will be some more support for GDP from LNG volumes near the end of the year and policy support in the form of falling interest rates and larger Budget deficits, but these will be insufficient given the risk to Australia’s AAA credit rating (which is surely lost next year), rising bank funding costs, as well as potential prudential action from APRA and/or the banks. Thus we see the last of Australia’s monetary ammunition being drained and the dollar becoming ever more weak.
We were too early last year calling the great dwelling construction unwind, and China caught us on the hop regarding commodity markets. But the fundamentals have not changed. If anything, they have gotten worse given that housing values, dwelling construction, and debt levels (both private and public) are even more elevated than at the same time last year, as well as the growing geopolitical risks globally.
2017 looks like another year of barely hidden pain for the Australian economy, becoming more obvious as the year progresses, with more rate cuts and a falling Australian dollar, as we head ever deeper into our 100 year adjustment.