Mining GFC reversal catapults Australian dollar
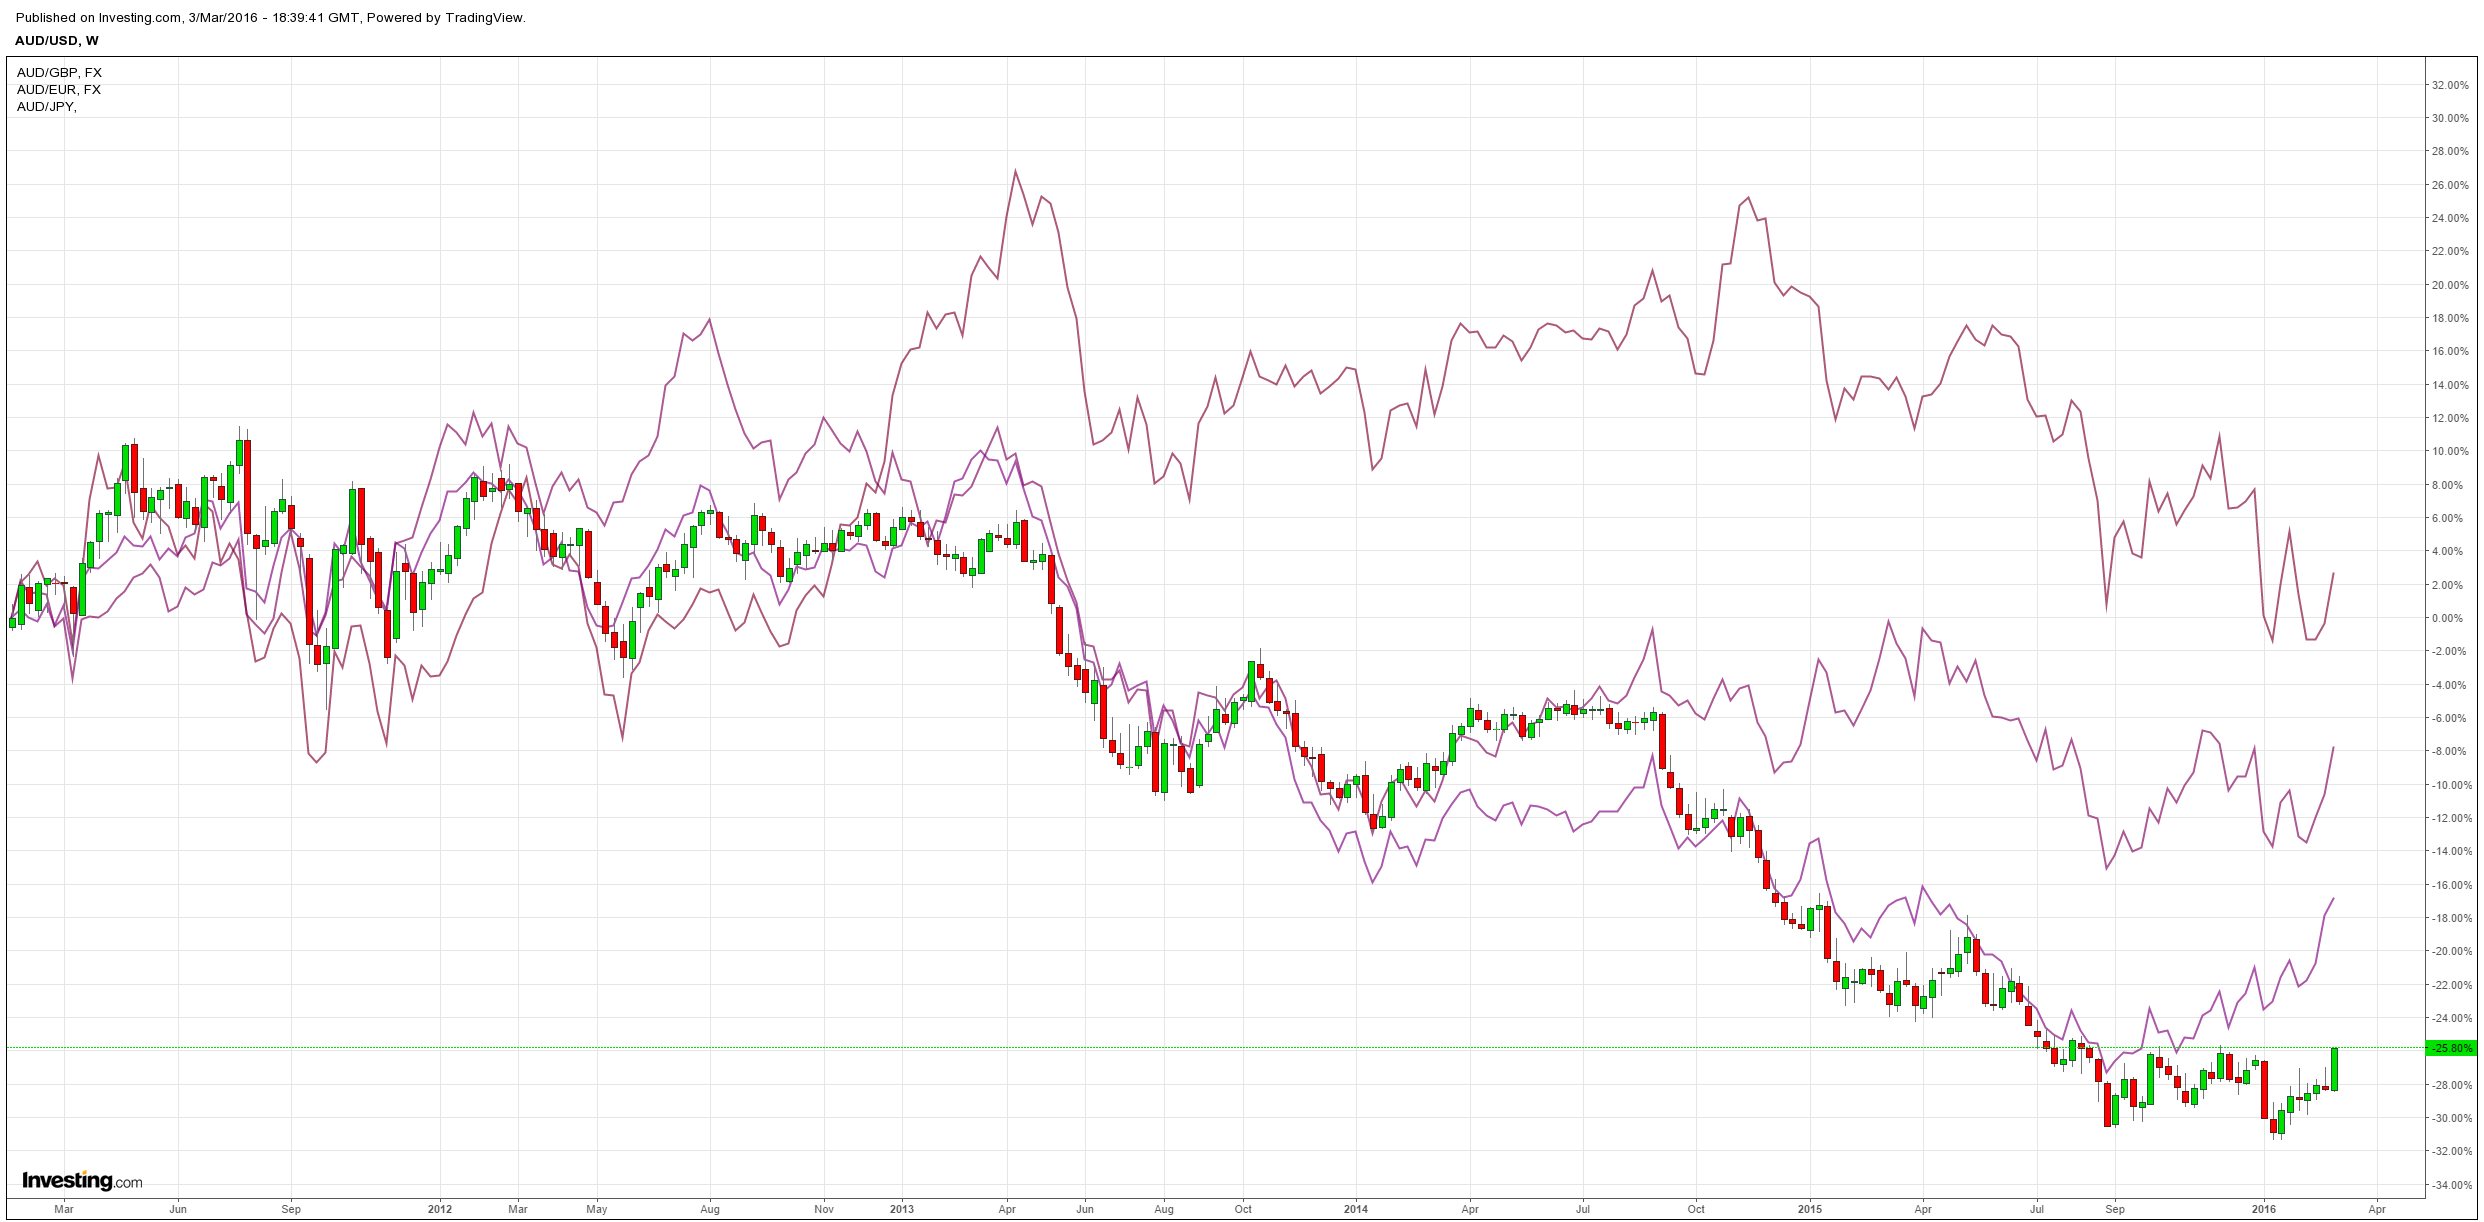
The Australian dollar is ripping higher, especially against the US dollar and pound:
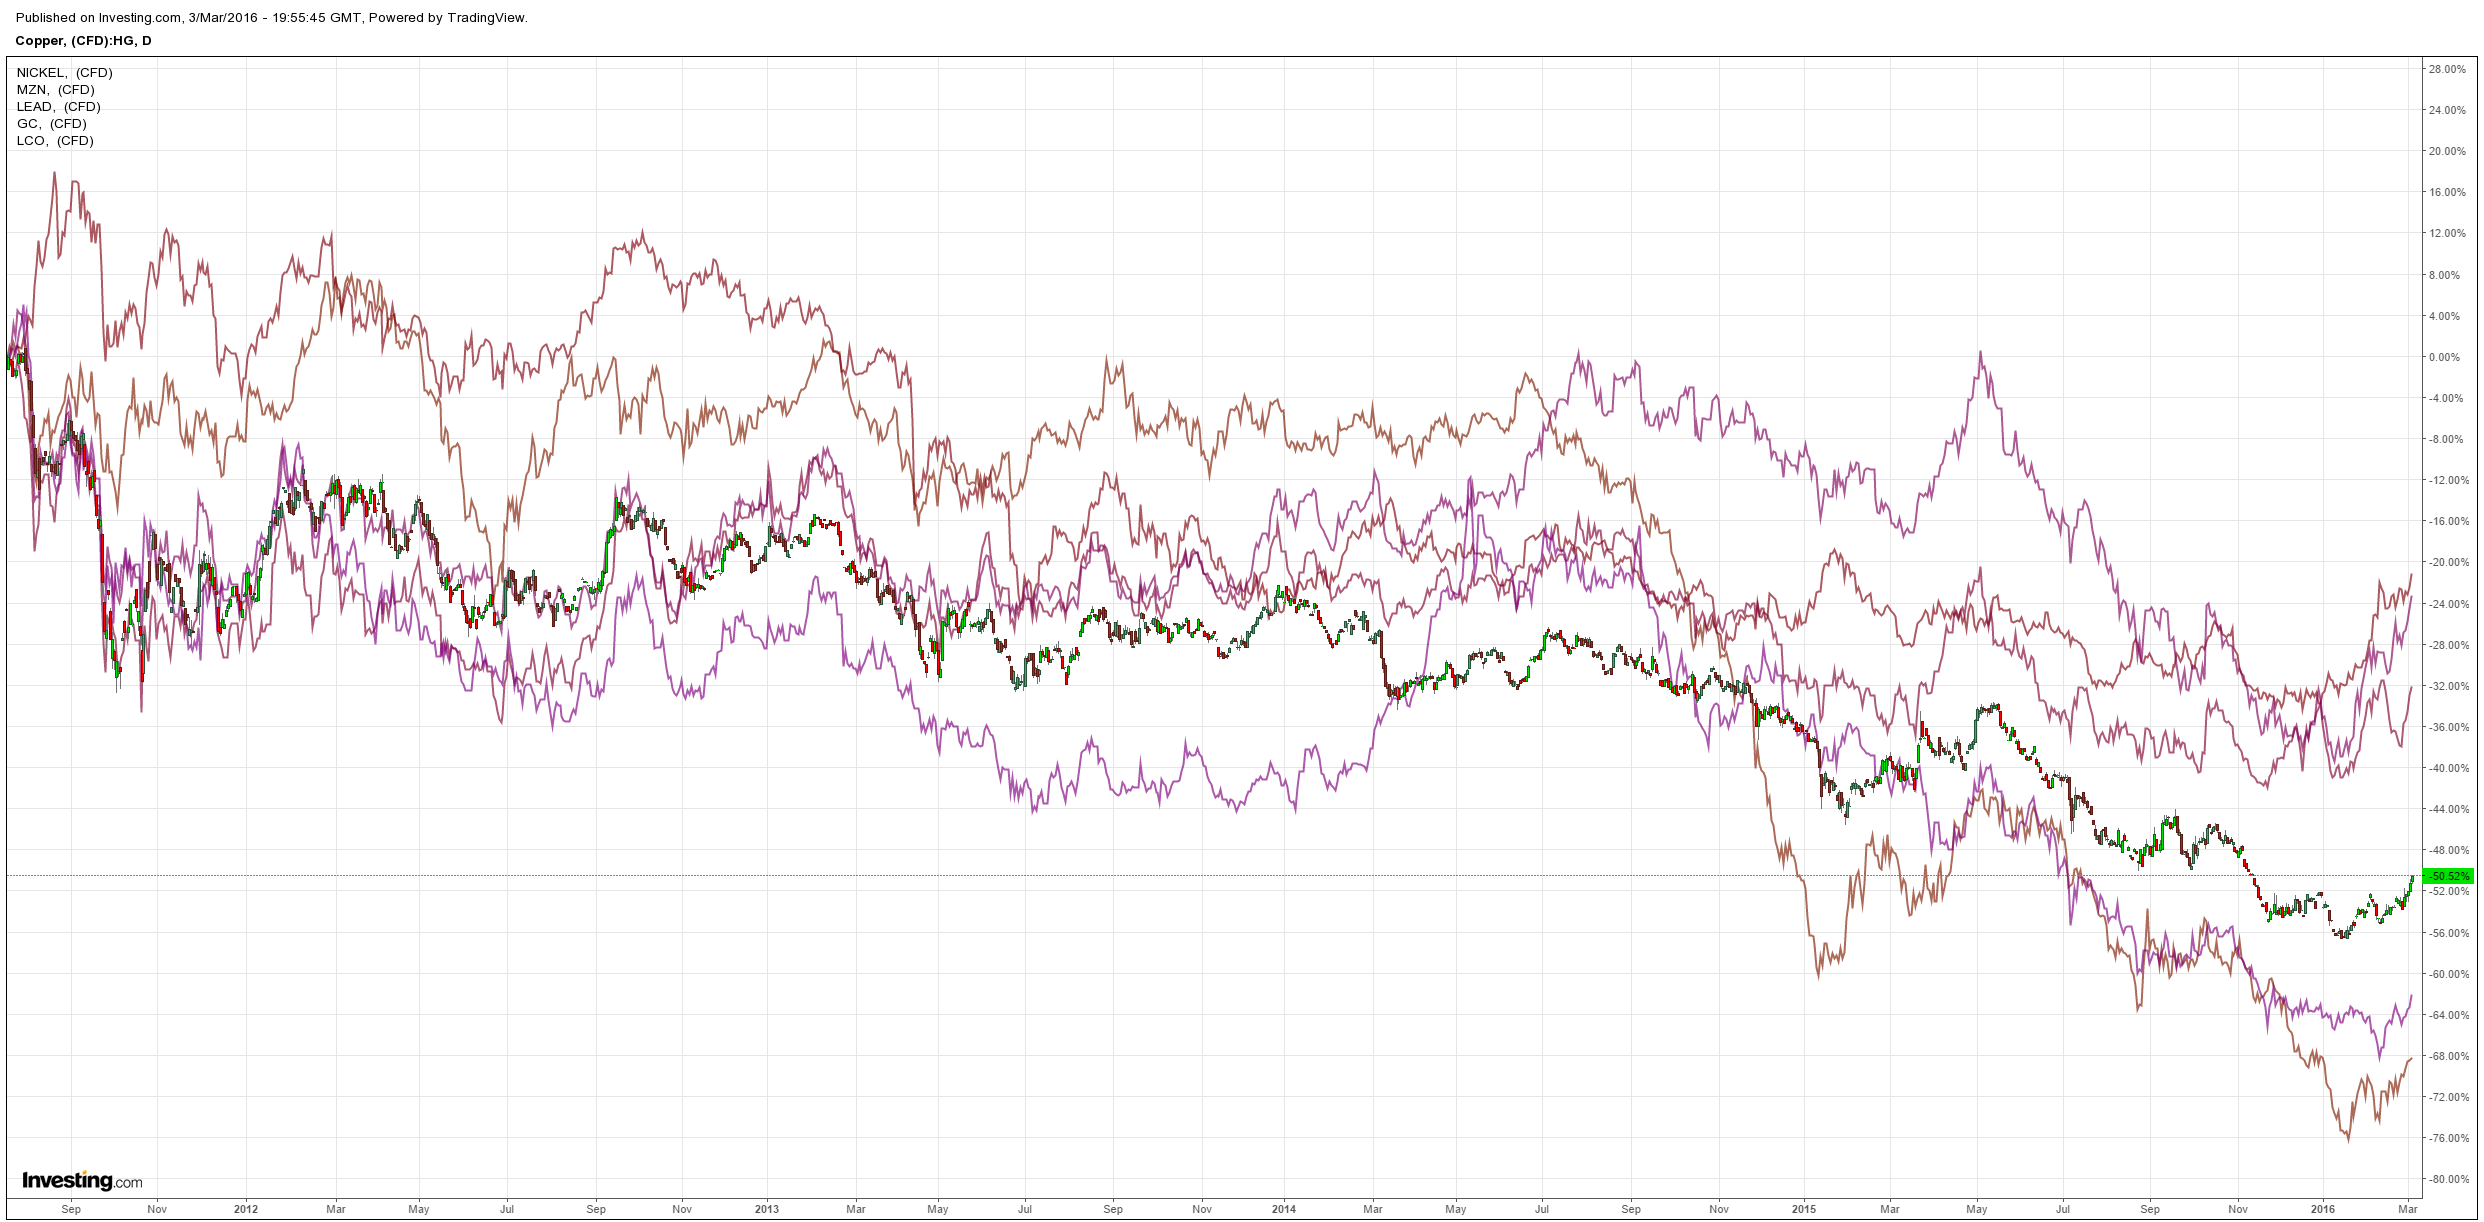
There are three main reasons. The Mining GFC set up of a weakening China and yuan and strengthening US and dollar is under challenge as Chinese stimulus, such as it is, has commodity prices ripping in iron ore, base metals, oil and gold:
Second, markets are questioning what the US Fed will do next vis tightening, especially in light of the approach of the February employment report, from Calculated Risk:
On Friday at 8:30 AM ET, the BLS will release the employment report for February. The consensus, according to Bloomberg, is for an increase of 190,000 non-farm payroll jobs in February (with a range of estimates between 168,000 to 217,000), and for the unemployment rate to be unchanged at 4.9%.
The BLS reported 151,000 jobs added in January.
Here is a summary of recent data:
• The ADP employment report showed an increase of 214,000 private sector payroll jobs in February. This was above expectations of 185,000 private sector payroll jobs added. The ADP report hasn’t been very useful in predicting the BLS report for any one month, but in general, this suggests employment growth above expectations.
• The ISM manufacturing employment index increased in February to 48.5%. A historical correlation between the ISM manufacturing employment index and the BLS employment report for manufacturing, suggests that private sector BLS manufacturing payroll jobs decreased about 25,000 in February. The ADP report indicated 9,000 fewer manufacturing jobs. Note: Recently the ADP has been a better predictor for BLS reported manufacturing employment than the ISM survey.
The ISM non-manufacturing employment index decreased in February to 49.7%. A historical correlation between the ISM non-manufacturing employment index and the BLS employment report for non-manufacturing, suggests that private sector BLS non-manufacturing payroll jobs increased about 65,000 in February.
Combined, the ISM indexes suggests employment gains of 40,000. This suggests employment growth way below expectations.
• Initial weekly unemployment claims averaged close to 270,000 in February, down from 283,000 in January. For the BLS reference week (includes the 12th of the month), initial claims were at 262,000, down from 294,000 during the reference week in January.
The decrease during the reference suggests fewer layoffs in February as compared to January.
• The final February University of Michigan consumer sentiment index decreased to 91.7 from the January reading of 92.0. Sentiment is frequently coincident with changes in the labor market, but there are other factors too – like lower gasoline prices.
• “TrimTabs Investment Research estimates based on real-time income tax withholdings that the U.S. economy added between 55,000 and 85,000 jobs in February, the lowest monthly job growth since July 2013.”
• Conclusion: Unfortunately none of the indicators above is very good at predicting the initial BLS employment report. The ADP report and unemployment claims suggest job growth in the 200 thousand plus range.
However the ISM surveys and tax withholdings suggest a report way below consensus.
The signals are mixed, but my guess is employment will be below consensus in February.
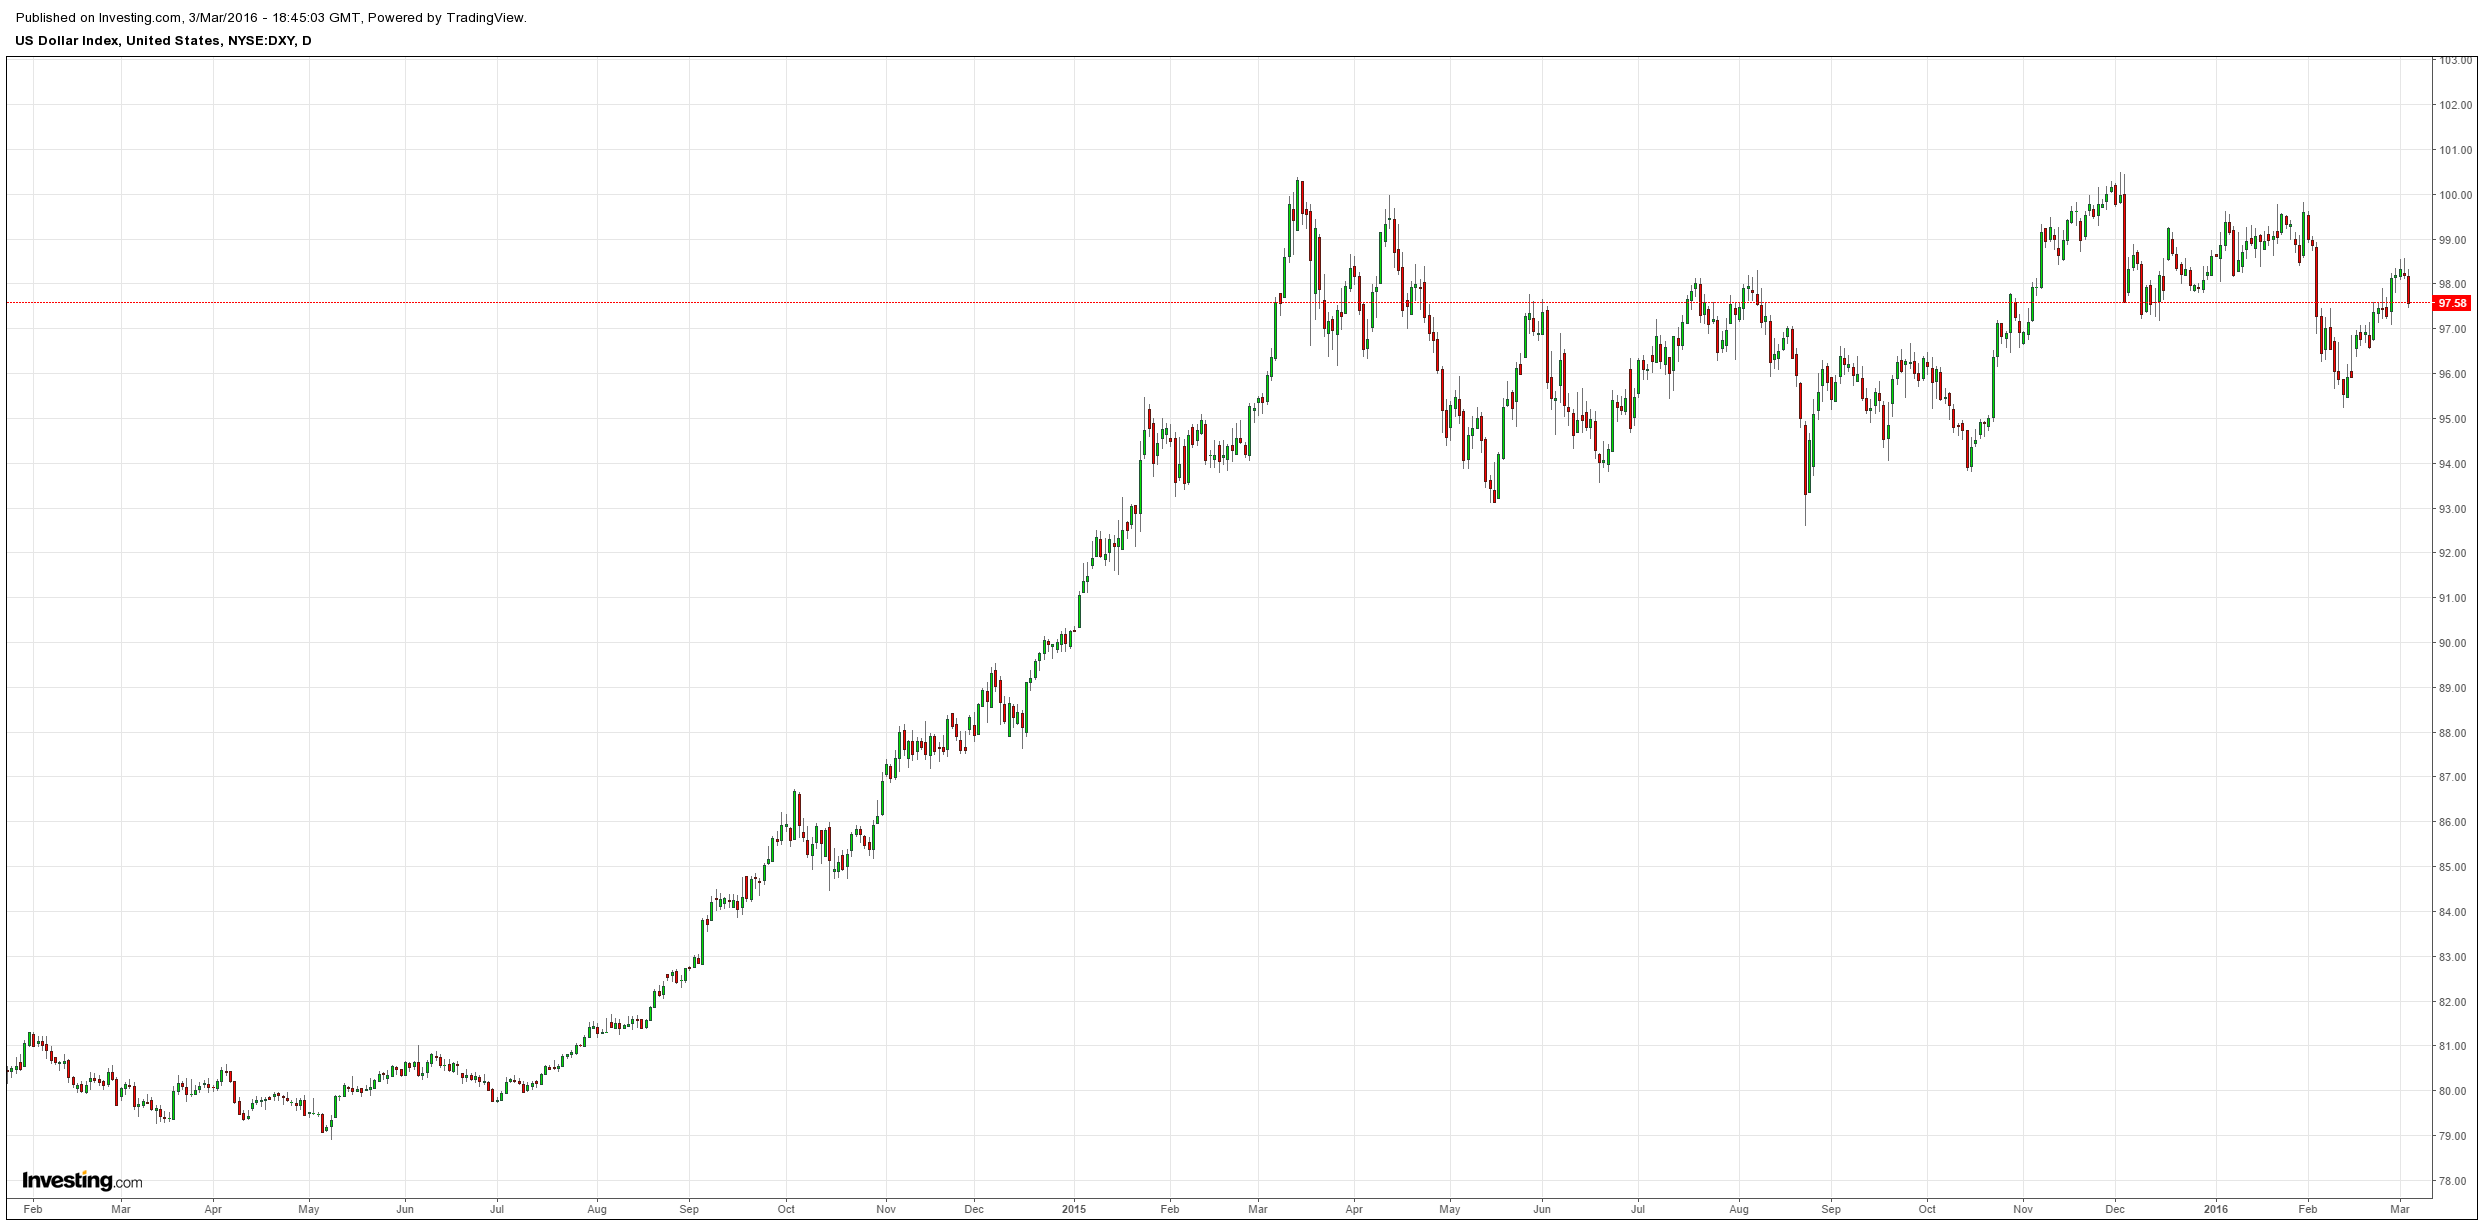
That has the US dollar under pressure again:
Third, Australia’s bubble GDP out-performance has ignited inflows.
So, have we already passed through the Mining GFC and come out the other side setting up a sustained run for the Aussie higher? No, this is a hiatus:
- Chinese stimulus cannot fire up bulk commodity growth while its manufacturing and residential housing sectors are contracting. Together they constitute 75% of steel consumption and structural change in the former and oversupply in the latter mean new credit is flowing into top tier city property prices where an outrageous bubble is building. This may support consumption but not commodities;
- the US economy is challenged by the shale bust but its consumer, housing and car sectors are still solid. Unemployment is not as low as it appears but it’s low enough to generate some wage gains. The Fed may pause but is not likely to backtrack unless things get materially worse meaning that the BOJ, ECB and BOE are all likely to ease more than the Fed;
- moreover, all commodities – especially Australia’s iron ore, coals and LNG – remain in states of extreme oversupply.
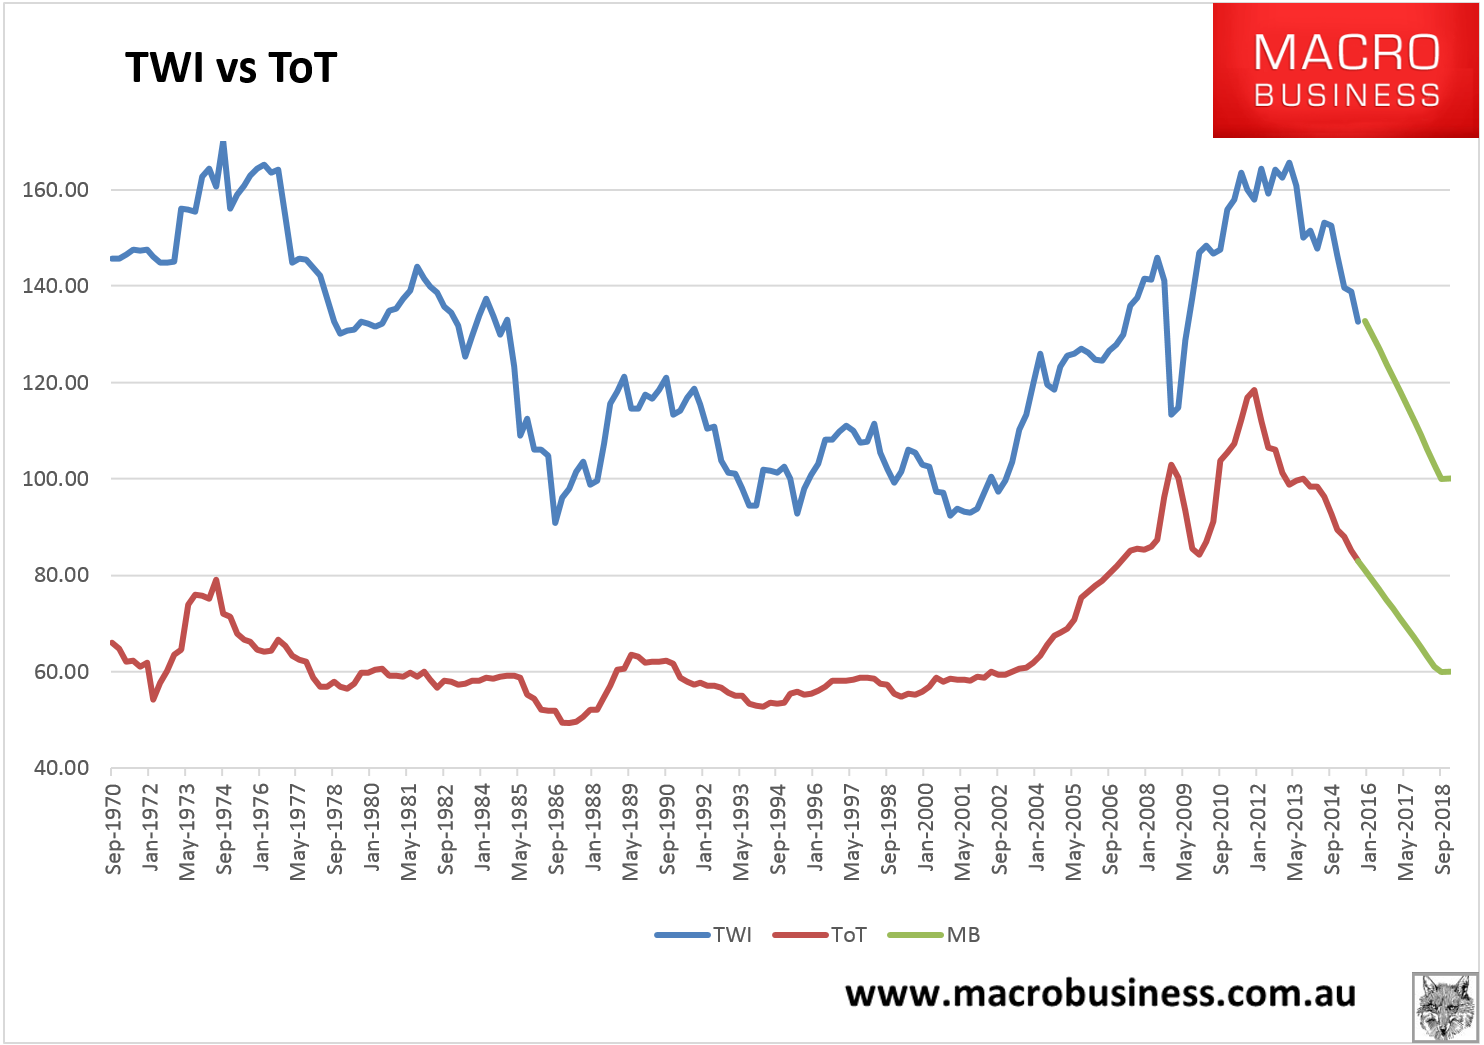
The mining bust is not over. Australia’s terms of trade will keep falling (reverting to mean) and so long as that happens any Australian dollar rally is temporary:
As for how long any rally lasts, note the two long pauses in the sell-off in 2012 and 2014 in the top chart.
