
After 24 years without an official recession, the Australian economy faces its sternest test in 2016-17. What is most apparent about the outlook for next year and beyond is the number of deleterious ‘known knowns’ and ‘known unknowns’, let alone ‘unknown unknowns’.
The first of these known shocks – the unwinding of the biggest mining investment boom in 150 years – is already underway, but will likely accelerate over the next two years, taking with it many thousands of mining-related jobs.
The second shock – falling housing construction and prices – will likely manifest from mid-2016 as the record boom in dwelling construction and prices unwinds, led by the bubble epicentres of Sydney and Melbourne.
The third shock – the closure of the Australian car manufacturing industry – will begin in October 2016 with the closure of Ford’s assembly operations, before worsening in 2017 as both Holden and Toyota shut down.
The greatest of the known unknowns, and perhaps the greatest shock of them all, is the convergence of a weakening Chinese economy and strengthening US economy, which this year dragged commodity price down very fast as both fundamental demand evaporated and a monetary headwind developed for prices in the rising US dollar. This shakeout has the potential to mushroom into a full blown global debt crisis around commodity producers, both private and sovereign.
This time last year, MacroBusiness released its Christmas special report entitled Australia in the super-cycle unwind, which examined the headwinds converging on Australia and predicted that the economy would undergo a deep structural adjustment that would reach its apex in 2017.
In this special report, we revisit these themes and discover that we have very likely been too bullish.
The Commodity Price Bust
It was thought by many Australian officials, miners and markets that this commodity “super cycle” was a permanently high plateau for prices. This argument was based on the notion that China had decades yet to urbanise and so elites urged the nation to embrace “structural change” in the economy to a higher resources dependency.
That has proven to be a fateful mistake as the world moves into the second phase of post-GFC recovery.
China’s post-GFC growth was driven in some large part by capital mis-allocation, resulting in phenomenal oversupply in areas of real estate, very high risk growth in shadow banking, a collapse in productivity growth, and now a push by authorities to rebalance the economic structure away from building towards innovation, consumption and services, to prevent a debt crisis. The days of China’s super-charged GDP growth are unexpectedly over.
The result is that global capitalism has responded to towering commodity prices with a massive supply surge just as China has slowed and will continue to do so, especially in those areas of the economy that are commodity-intensive. In turn, massive oversupply has appeared in coal, iron ore, oil and base metals.
Prices are still falling in all commodities and the two most important – iron ore and LNG – are both headed for much greater falls yet as oversupply has only just arrived and will get much worse.
In the 11 months since last year’s report, Australian commodity prices have continued tumbling, falling by 19% according to the RBA’s Index of Commodity Prices:
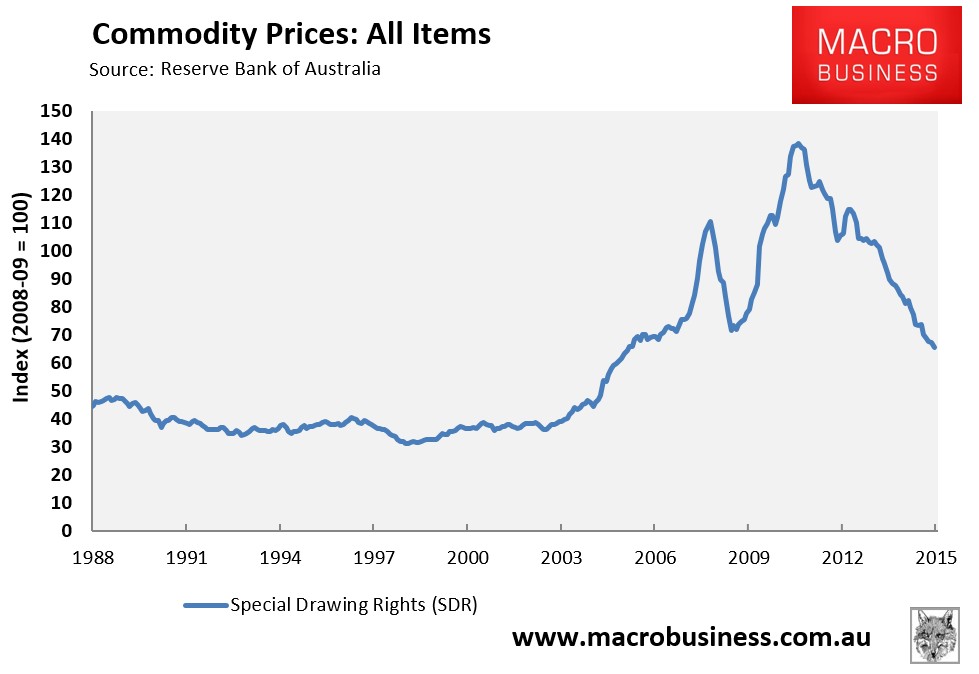
Since July 2011, when the commodity price index peaked, commodity prices have fallen by 53%. Yet, despite these hefty falls, the commodity price index remains around one-third above its pre-boom level, suggesting further falls are in store for the terms-of-trade.
Below is MacroBusiness’ revised forecast for the terms-of-trade, which is lower than last year’s forecast due to the faster than anticipated downturn in iron ore prices:
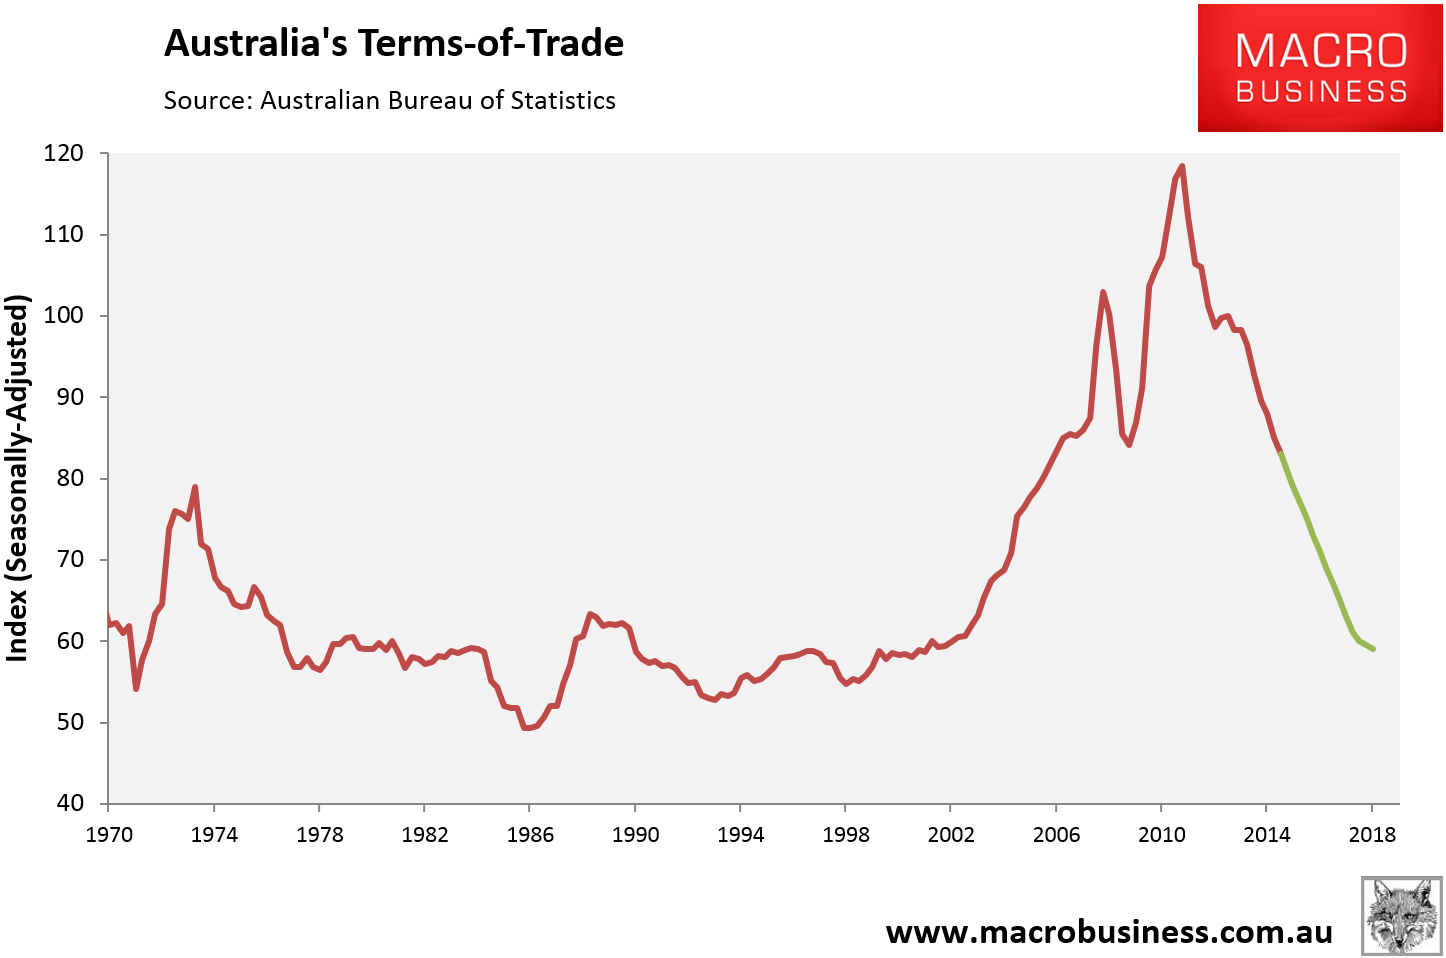
Since last year’s report, the price of Australia’s four major exports have ignominiously collapsed. The two coals – coking and thermal – have fallen 40% and 20% apiece. Iron ore has roughly halved. The price of contract LNG has crashed 60%. Base metals and soft commodities have also been drawn into the carnage.
It may seem like the magnitude of such falls are enough to consider a bottom to be near. Alas, MacroBusiness can draw no such conclusion. For four reasons, more steep falls are ahead:
First, China is still slowing and changing and there is no sign of improvement as its housing market recovers only partially and construction, which constitutes 40-50% of steel consumption is falling fast:
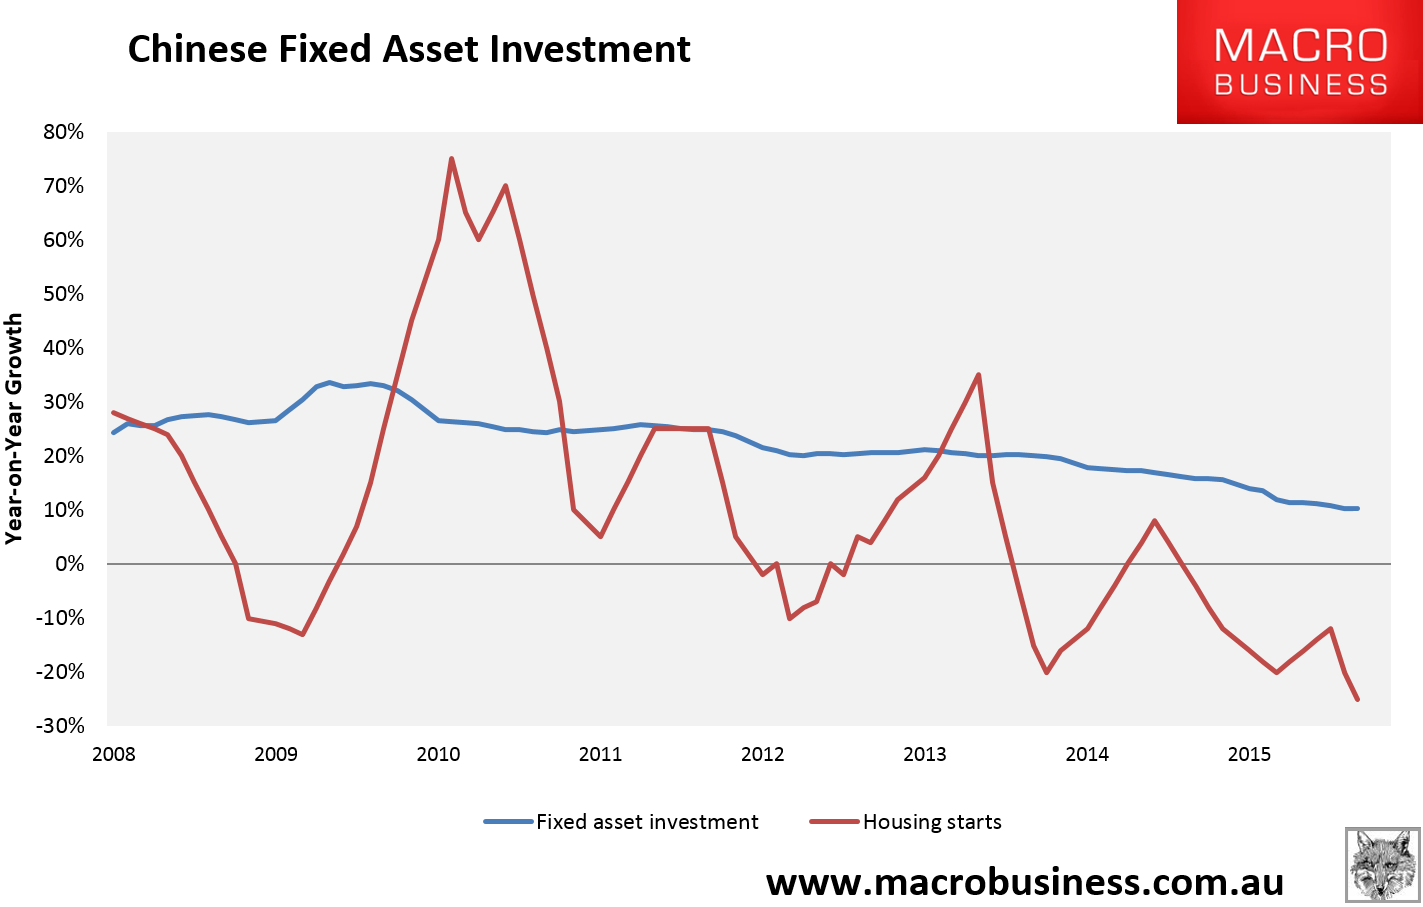
MB really has no idea if China’s rebalancing from investment to consumption will result in a “hard landing” or a more drawn out slowdown, but for Australian investors the question is immaterial. The slowing in Chinese commodity demand will be swift whether it succeeds or fails in its rebalancing effort.
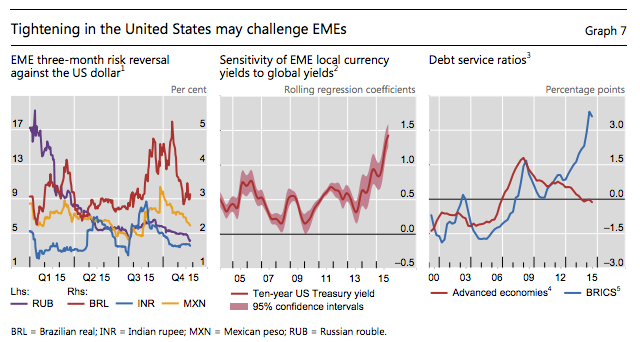
Second, the US dollar bull market forecast last year is intact and running:

Because commodities are priced in US dollars, the more it rises the more they fall. With the US Federal Reserve tightening monetary policy next year in some measure (not much), and the European and Japanese central banks embarking on more stimulus, the US dollar ought to continue to rise, at least until such a point that markets sense that the Fed has overdone it.
Third, all major commodity producers have seen large currency falls and this has offset some of the above two forces in native currencies, helping to keep production profitable. We also expect this to continue, but it is largely only serving to devalue all commodities as supply is caught in a race to the bottom for costs. The same can be said for the private firms that produce them. There is no available figure to capture the degree of cost-out deflation in total, but taking one simple example in Fortescue Metals Group, it has reduced its costs by two thirds yet still can’t make money.
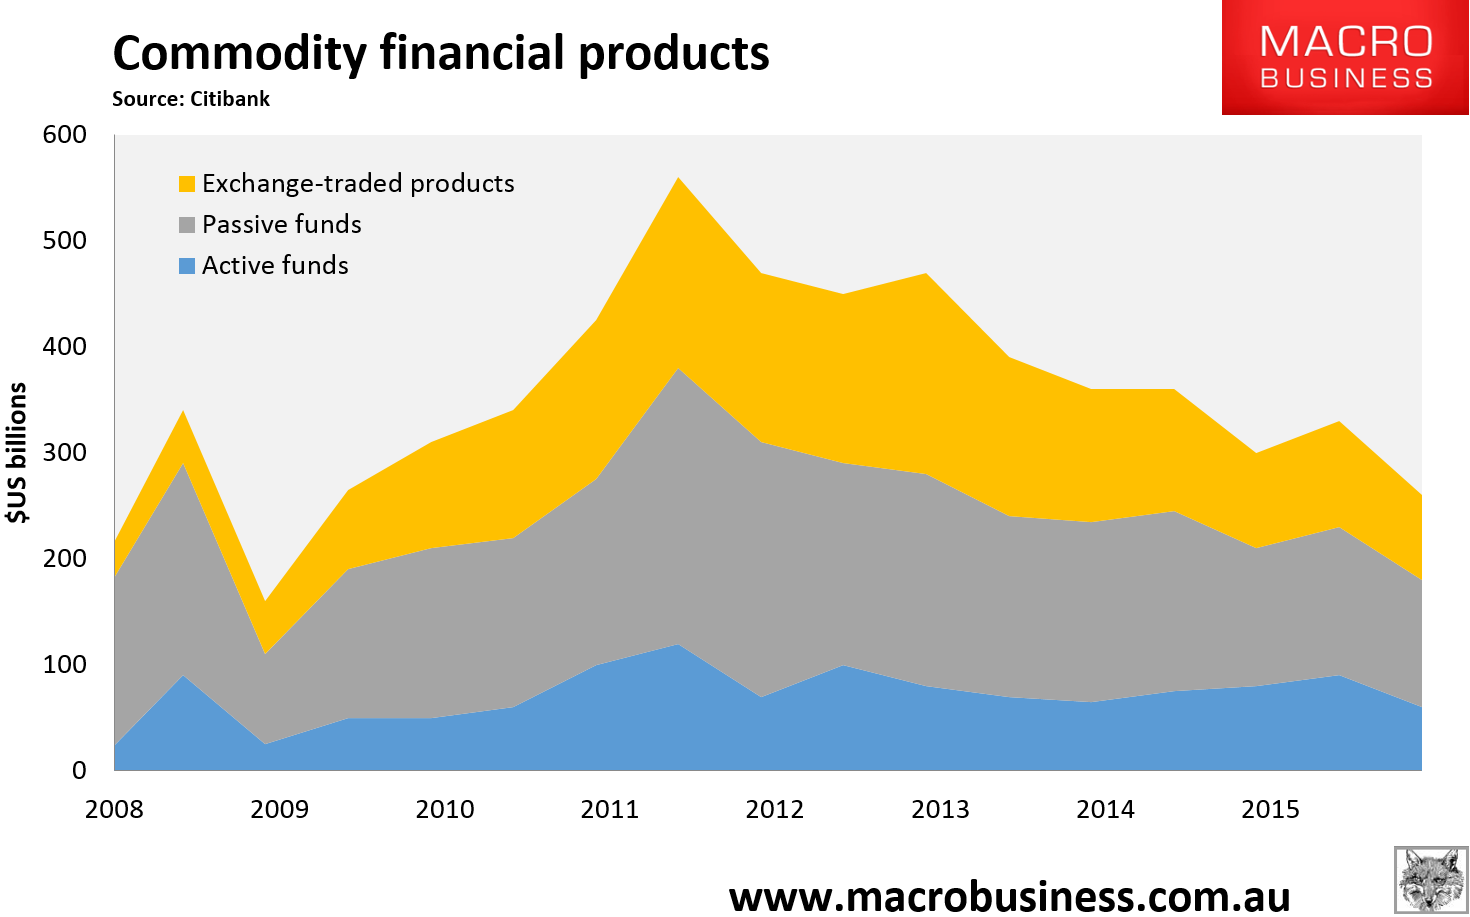
Finally, although commodity market destocking has occurred to a degree, markets remain convinced that a commodities turn is just around the corner, and so we are yet to see a complete flushing out of hoarding. This is particularly the case for oil, which is threatening to run out of global storage space, but is also the case for iron ore and copper, not least in China where large stockpiles are still in evidence. Then there are the multitude of commodity ETFs, specialist hedge and manged funds which are still destocking:
Double Trouble
To put more precise forecasts upon the two most important commodities for Australia – iron ore and LNG – we need to take a look at those markets in more detail.
Two forces are coming to bear on the iron ore market and neither is positive. The first is ongoing supply expansion and second is faltering Chinese demand.
Supply is expanding much as forecast last year with the major Australian miners now largely finished with their ramp ups. At this stage, MacroBusiness estimates surplus capacity at around 110 million tonnes (mt) or more worldwide (which includes the removal of Samarco production following the Brazilian disaster):
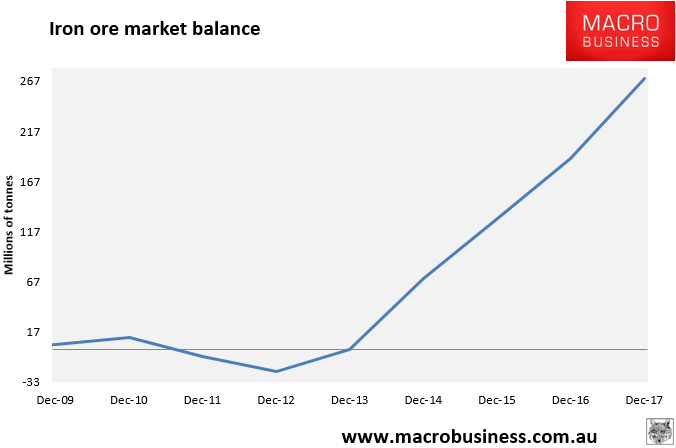
Over the next year another 40mt will come to market from Roy Hill and Sino Iron in the Pilabra, as well Indian Goa and Minas Rio in Brazil.
By the end of next year, Samarco will probably return along with Vale’s big ramp up of S11D, it’s super low cost 90mt new mine complex. 2017 will thus see an even larger ramp up of production than next year.
Turning to demand, we find that Chinese steel output is on track to shrink by 3% this year to 797mt. That’s 40mt of iron ore not needed this year from last. There is also little prospect of any offset from other nations. Indeed, the rest of the world is currently shrinking steel output also at 3%, meaning 80mt of demand is going missing every year. We expect a repeat next year with the risks being to the downside as export markets close to Chinese steel mills. Chinese iron ore production falls might shut-in enough production to cover half of this.
So, even with Samarco gone and further falls in Chinese production, the iron ore surplus will expand 40mt next year. More supply must be rationalised and next on the cost curve is the roughly 40mt in the Pilbara juniors – Atlas, Cliffs, BC Iron and others. Each of these have breakevens between $40 and $50, so we need to be in the mid $30s to knock them out. That will be the story of 2016.
By year’s end, the next up leg in supply begins and the majors will have to start battling each other for market share dropping the price deep into the $20s in 2017.
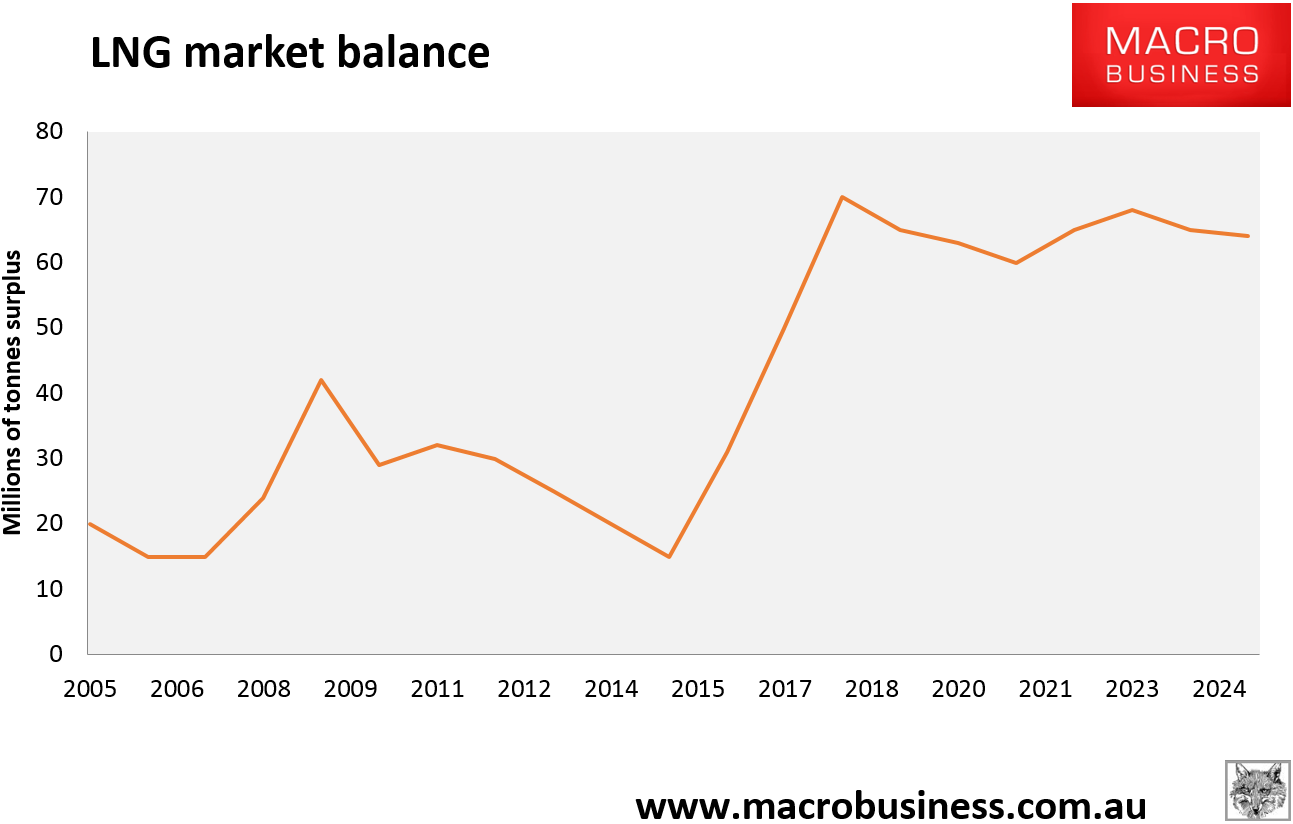
The story for LNG is similar with it riding a wave of global supply growth for gas, coming from the US, Russia, Africa and Australia:
Last year’s forecast of deeper price falls proved true. Oil is notoriously difficult to predict, not least owing to the geopolitics of it. Nevertheless, all things equal, we still see more downside for Brent next year as Iranian oil returns to global markets and US shale stubbornly refuses to capitulate. $40 seems a decent pivot point but we see it lower at times.
Though most LNG is sold on oil-linked contracts, that is unlikely to provide much protection. The huge supply surge coming online in 2016-17 is combining again with weak Chinese (and North Asian) demand, which is down 5% this year, to put immense pressure on “take or pay” contracts held by Australian producers. These can be expected to continue to fray and in some cases break. They already have to the extent that restrictions on the reselling of contract volumes into spot markets have been lifted for a number of customers.
That is the key point given these volumes end up back on the spot markets where the price will keep falling, encouraging more customers to dump contracts as the spot price undershoots oil-linkages.
Over the course of the next two years, supply will expand by 120mt (about one third) as the US and Australia enter a market share battle similar to iron ore. There is a distinct danger that this will end in production cuts for both, though probably not in the next year.
We expect that by year’s end, we will be seeing LNG contracts with a $5 handle and spot trading with a $4 handle.
The Mining GFC
The four factors driving commodity prices lower leads MacroBusiness to conclude that what lies ahead is, in fact, worse than that which we forecast last year. As demand falls or China grows more slowly and supply keeps coming, the only way that commodity markets can rebalance is for prices to keep falling to such a point that even the most robust of miners is shaken to its foundations. What is at risk now is an accelerating balance sheet reckoning for the entire commodities complex – nations, producers and finance – and a mass global bankruptcy of malinvestment made over the super-cycle. We saw the first manifestation of this earlier in the year with the Glencore panic in August and we will see much more ahead.
To imagine how large this event could be, one has to fathom just how enormous commodity supply chain investment has been over the past five years. For the globe, non-financial bond issuance for oil, gas and mining sectors has been US$1.91 trillion dollars, or 18.2% of total issuance. MacroBusiness believes that this investment is so large that is has itself inflated commodity demand in a virtuous feedback loop. Given the commodity supply chain is itself commodity intensive in the investment phase – building trains, trucks, ships, buildings, processors, roads, rail, bridges etc – this has perhaps duped producers into thinking that demand is more structural than it really is. As the cycle turns and commodity investment winds down fast, it is also accelerating the decline of demand for its own product.
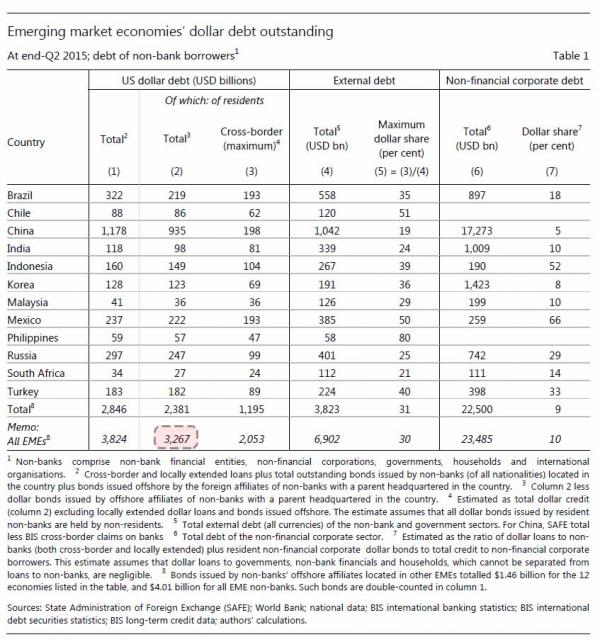
The second point to make is to note just how large emerging market bond issuance has been into commodity production – some US$834 billion, or one quarter of total non-financial issuance:
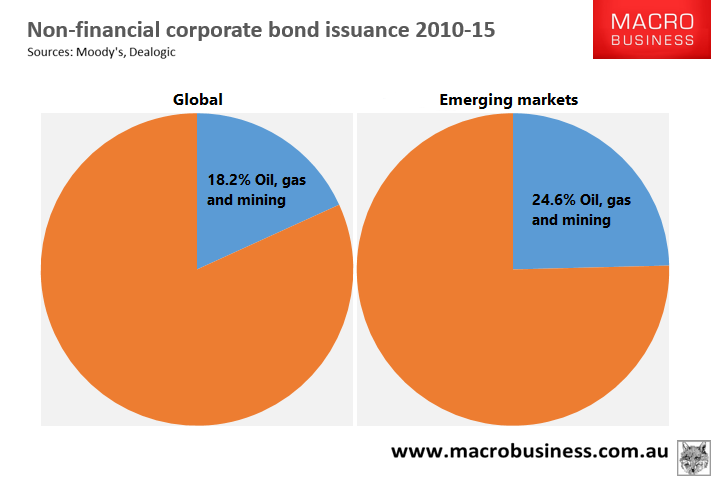
This places emerging markets on the front line of any commodity debt shakeout. Moreover, it is made even more onerous by the likely shifts in the relationship between Chinese and US growth. The first will see its rebalancing project require further monetary easing which will, in turn, push the yuan to depreciate. That will place even more pressure on its commodity imports as China’s own production become more competitive. For the US, tightening will push the US dollar higher and because many of these self-same emerging markets have borrowed in US dollars to fund their great expansions – some $7 trillion since the GFC according to BIS – debt servicing costs will also increase.
It is not too much to say that emerging market’s business model is broken and, therefore, so too is Australia’s freshly minted resources-led economy.
The leading edge, and driver, of this credit deterioration is already apparent in highly leveraged miners and, more to the point, the $200 billion in junk bonds issued to US shale which has distress mounting in the US high yield debt market:
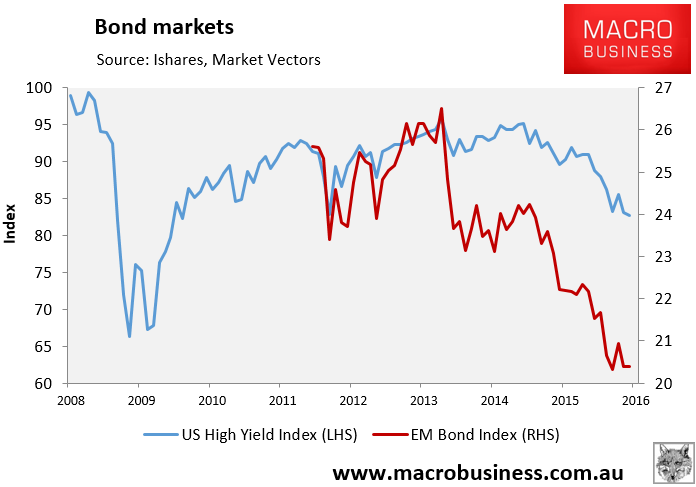
Contagion is underway for both private and sovereign commodity producers, but so far it is relatively contained to specific problems areas such as US shale or Brazil.
We suspect that it is not going to remain that way for very much longer. Using a Global Financial Crisis analogy, the Minsky moment – when borrowing suddenly fails to cover its own costs – occurred in August 2007 when French bank BNP Paribas declared ‘the complete evaporation of liquidity in certain market segments of the US securitisation market has made it impossible to value certain assets fairly regardless of their quality or credit rating’.
This time around it will not be banks that are at the heart of the debt freeze but bond markets. The good news is that it probably won’t literally be a “freeze”, rather a steady rise in marginal bond rates until all miners and emerging markets alike are feeling the pain regardless of ratings or credit quality. We expect that at various points in this process we will see both major private and public defaults.
As the contagion spreads, the risk is that the $7 trillion or so in emerging market US dollar denominated borrowings begins to unravel at the margin, and we see a self-fulfilling dash for US dollars as everyone seeks to repatriate greenback debt simultaneously. If so, we will enter a self-fulfilling crisis of US dollar rises blowing up more US denominated debt in un-dollarised economies as the world finds itself acutely short of dollars.
It’s not another GFC but it is, in effect, the Asian Financial Crisis gone global for commodity producers.
Australia’s Income Shock
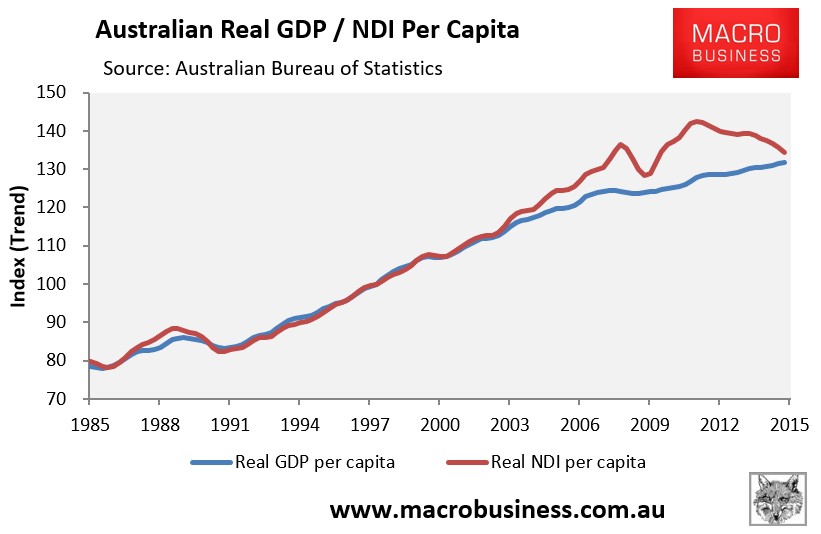
Turning now to the Australian economy, the first major impact of the above to date has been the national income shock. As predicted in last year’s report, the significant fall in the terms-of-trade since late-2011 has continued to weigh heavily on national disposable income (NDI), which has been declining in the face of rising GDP:
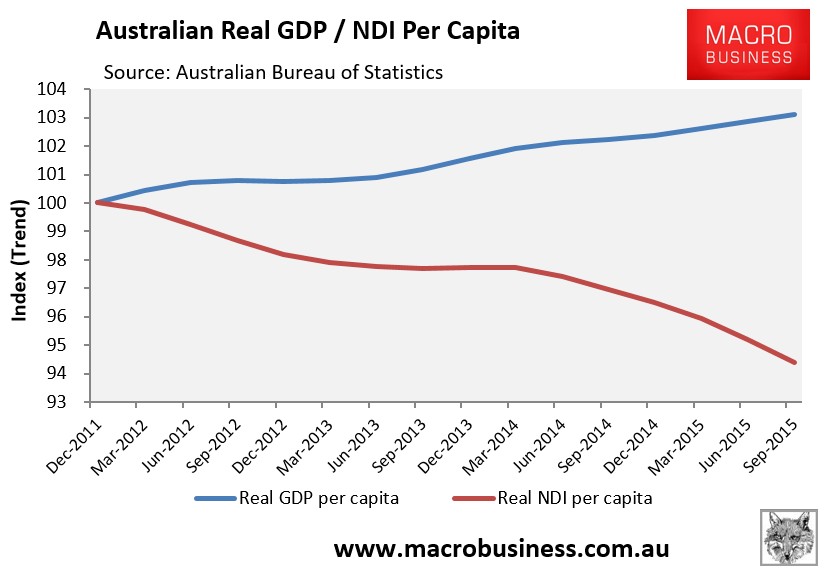
Essentially, after growing at nearly twice the pace of output, as measured by GDP, between September 2003 and December 2011, the blue line (real GDP per capita) and red line (real NDI per capita) below continue to converge:
While real GDP per capita has risen by 3.1% since December 2011 thanks to rising commodity export volumes, because these exports have been sold at much lower prices, profits have been crushed, leading to a fall in real NDI per capita of 5.6% over the same period. Essentially, Australia has been selling more goods, boosting real GDP, but has received less in return, lowering national income.
The rot is unlikely to stop until the terms-of-trade has stopped falling, which means a further period of anaemic (if any) income growth for the Australian economy.
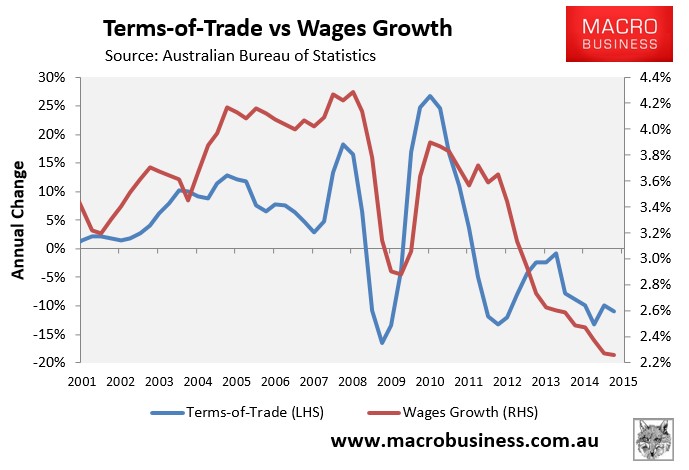
Australian households, too, are feeling the pinch from the terms-of-trade crash. The Australian Bureau of Statistics’ (ABS) labour price index revealed that wages growth is running at the lowest level on record (1997), with wages nationally increasing by just 2.26% in the year to September 2015, and real wages experiencing essentially zero growth over the past seven quarters.
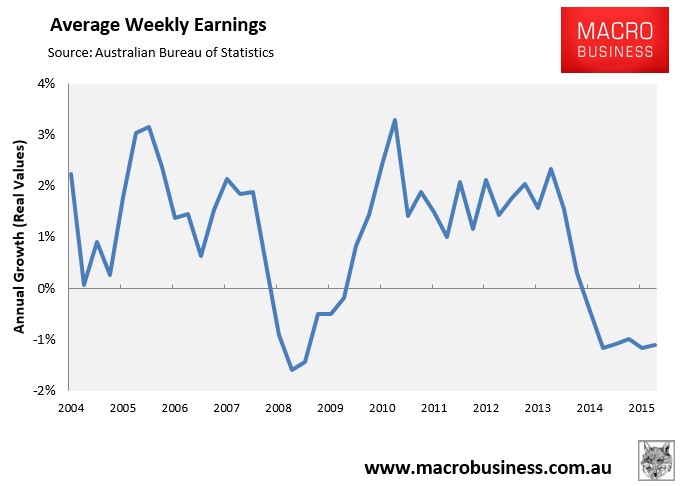
The story is worse when average weekly earnings are assessed. Due also to the rotation from high paying jobs (e.g. mining-related) into low paying jobs (e.g. services-related), real average weekly earnings have fallen for eight consecutive quarters, down by 1.1% over the most recent year:
The Mining Investment Bust
Unfortunately, rotation into lower paying jobs is likely to continue, which will lower real average weekly earnings. Mining investment is only around one-third of the way through its adjustment, as shown in the next chart:
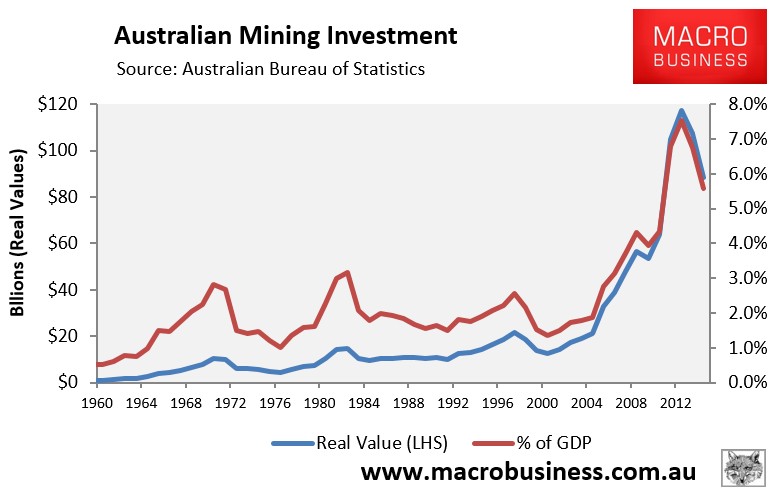
This means that over the next few years, there will be many thousands of redundant (formerly highly paid) workers in mining-related industries looking for lower paid jobs in the services sector.
The second major impact from the commodities crash is the loss of mining-related jobs as mining investment retreats to long-run norms. As shown in the above chart, the surge in mining investment from the mid-2000s was unprecedented, dwarfing the 1970s and 1980s booms. From a long-run average of around 2% of GDP, mining investment hit a peak of 7.5% of GDP in June 2013, and was tracking at 5.6% of GDP as at June 2015. Moreover, around half of this investment spike occurred in the three years to June 2013.
In last year’s special report, we derided the now defunct Bureau of Resource and Energy Economics’ projected pipeline of major Australian resource projects as being fanciful. Below is an update of this chart from the Department of Industry, Innovation and Science:
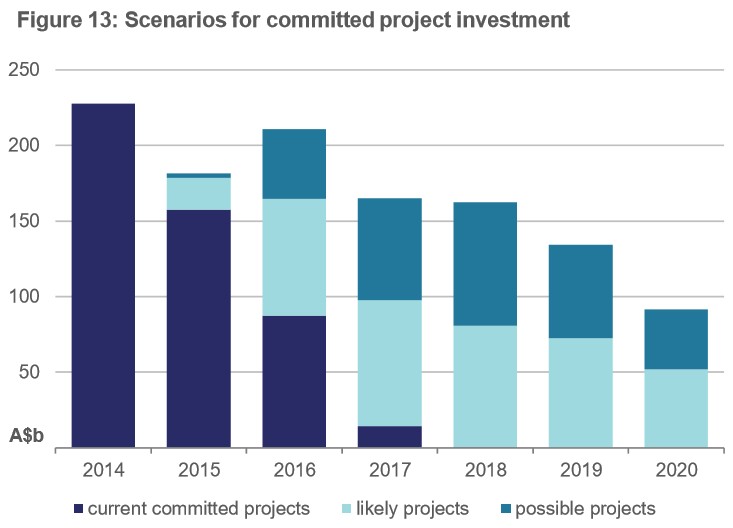
In MacroBusiness’ view, most of the projects labelled as “likely” and “possible” are in fact “heroic” and “a nice idea”. After all, how many resources companies are likely to commit new money amid gluts and falling prices for iron ore, coal and petroleum (gas)?
All that matters to Australians is the purple bars. The crash in investment is massive and relentless for another two years. There are only two major projects with a slim hope – Galilee Coal and Gorgon’s fourth train – everything else is off the agenda, including Browse LNG.
Sure, there will be investment in maintenance and productivity and the odd new little project, but that is all. After the flood comes the drought and this one will be historic.
Indeed, our forecast is that mining investment will retreat to around 1.5% of GDP once the current pipeline of projects are all but exhausted in 2018. This is around the level reached after previous (albeit smaller) booms. There is a clear risk, however, that mining investment could undershoot the long-run average and retrace to around 1% of GDP, as was the case after the 1970s commodity boom.
While output (GDP) will be supported as rising commodity exports offset reduced investment, the implications for employment are highly unfavourable.
According to Reserve Bank estimates, the mining sector accounted for nearly 10% of Australian employment in 2011, with two-thirds of these jobs in areas directly related to mining capital investment, such as construction workers, engineers, and other mining services. As resources projects are completed, much of the labour utilised during the construction phase will no longer be required, leading to a material increase in unemployment unless other areas of the economy continue to expand sufficiently to fill the void.
To get a sense of the employment shift taking place, as well as the likely impact on mining communities, one only needs to consider the outline of jobs at Western Australia’s two LNG projects, which are currently under construction (similar outlines have been provided for the three Gladstone LNG projects):
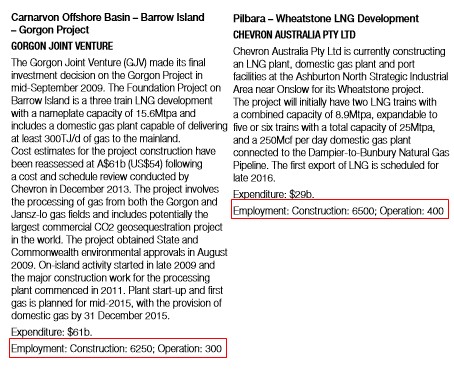
As shown above, the construction phase of an LNG project is some 20-times larger than during the operational phase. Add indirect employment – services in an around the projects, off sight mining services and engineering, and the like – and the employment impacts would likely multiply.
A Hamstrung Rebalancing
Normally, such a mining bust would be accompanied by a major rebalancing of growth drivers in the economy, as both interest rates and the currency fall.
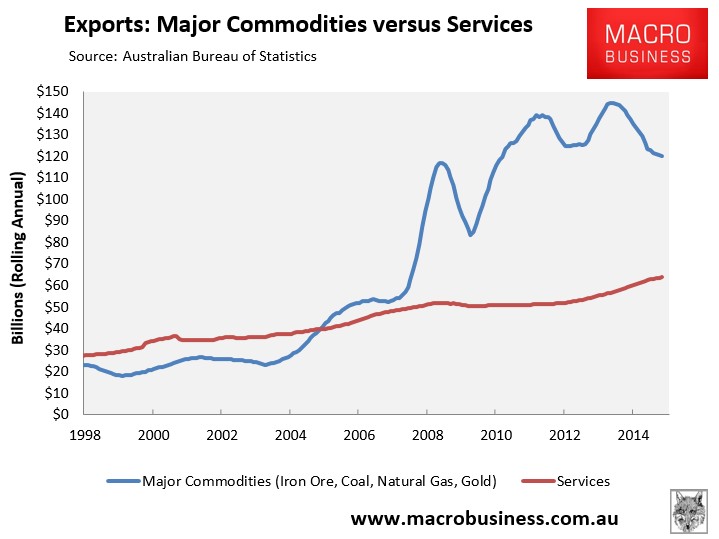
There is some evidence of this rebalancing this time around, with services exports offsetting to some degree the fall in Australia’s major resource exports:
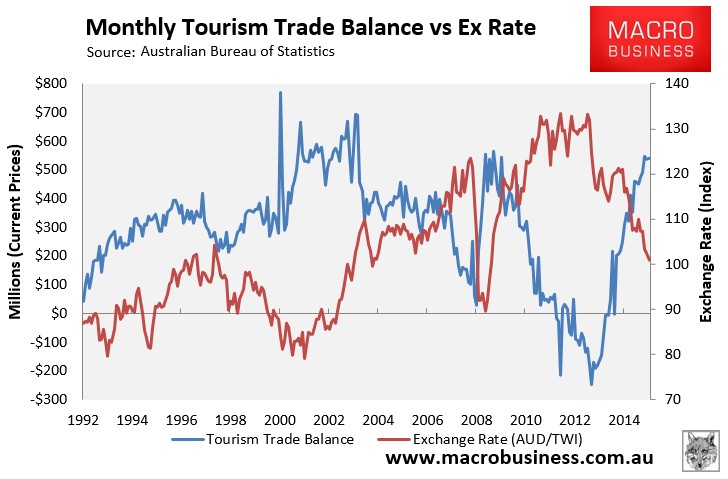
This growth in services exports has been driven by a rebound of net tourism exports:
However, there are two major inhibitors to a successful rebalancing in this cycle which have not been present before.
The first is that the high Australian dollar has weighed very heavily for a long time on non-mining tradable sectors. Both import-competing and export industries have been hollowed-out. It will be very time consuming and costly to rebuild them.
The most obvious example of this is the closure of Australia’s automotive assembly industry, whereby all three major car makers have scheduled to exit the country, starting with Ford in October 2016 followed by Toyota and Holden in 2017.
Estimates of the employment impacts from the car industry’s closure vary, but are nonetheless alarming.
On the rosy side sits the Productivity Commission (PC) and the Allen Consulting Group (ACG). The PC estimated that the car industry’s closure would cost up to 40,000 jobs, mostly in Victoria and South Australia, whereas ACG’s modelling, which used economic analysis from Monash University, estimated that the closure would cost around 33,000 jobs in Melbourne and around 6,600 jobs in Adelaide by 2018.
Both studies were arguably overly optimistic, given they assumed that a high proportion of component manufacturers would move into exports and/or the after-sales parts market, which are already crowded and highly competitive. The PC also assumed that two thirds of the expected 40,000 retrenched auto workers will find another job – an assumption that seems heroic given the lack of other manufacturing industries in Australia and the sheer size of the employment shock.
On the pessimistic side sits the University of Adelaide researchers, Lance Worrall and John Spoehr, who estimate that the car industry’s closure could cost up to 200,000 jobs once employment multipliers are added into the mix.
Irrespective, the impact of the car industry’s closure will be large and represent a big hit to the economy, particularly in South Australia and Victoria. Manufacturing remains an important source of full-time jobs in both states, accounting for around 12% of total full-time employment in Victoria and 11% in South Australia.
The timing of the car industry’s closure is also particularly poor, since these job losses are set to coincide with the unwinding of the mining investment boom, discussed above.
The second important inhibitor to rebalancing is the Australian housing market, which is exhibiting all the hallmarks of a major bubble.
The Reserve Bank has sought to “rebalance” the economy away from mining via engineering a housing “boom” – essentially increasing housing construction and consumer spending via the “wealth effect” from rising home values.
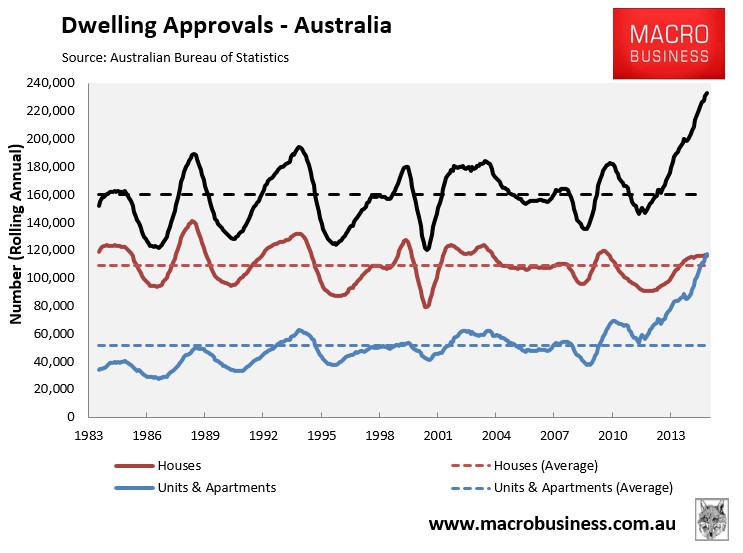
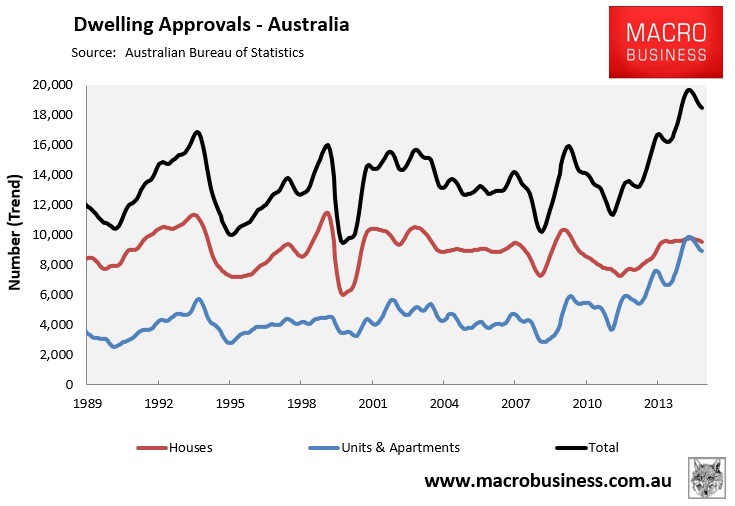
To date, this housing-led rebalancing has worked reasonably well – certainly better than we anticipated in last year’s special report. Dwelling construction has responded better than expected, with approvals running at all-time highs, albeit concentrated in apartments:
Retail sales and new car sales have also grown solidly, albeit concentrated in the housing bubble epicentres of Sydney and Melbourne.
But deep cracks are beginning to emerge which will likely stall the housing-led rebalancing next year.
First, dwelling construction is booming just as population growth nationally is stalling, leading to increasing concerns about a budding oversupply of homes, particularly in the apartment space:
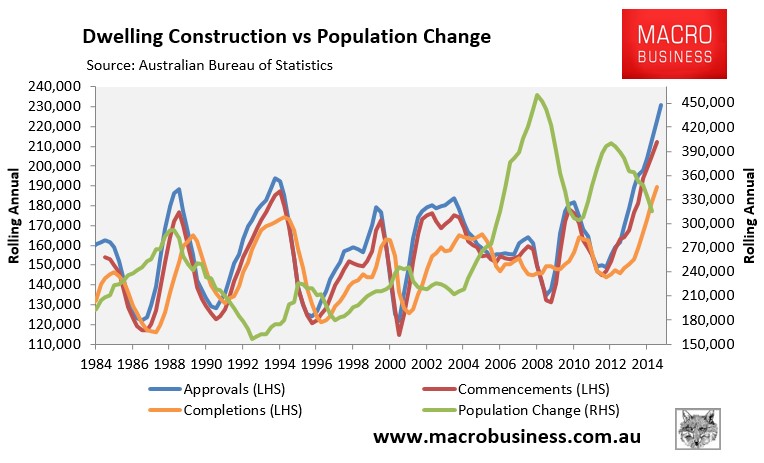
Dwelling approvals also peaked in March 2015, and given the 12 to 18 month lag between approvals and completions, suggests that dwelling construction will begin to turn down from around mid-2016:
Dwelling construction, therefore, represents a third employment shock that is likely to hit Australia from mid-2016, compounding the loss of jobs from falling mining investment and the closure of the car industry.
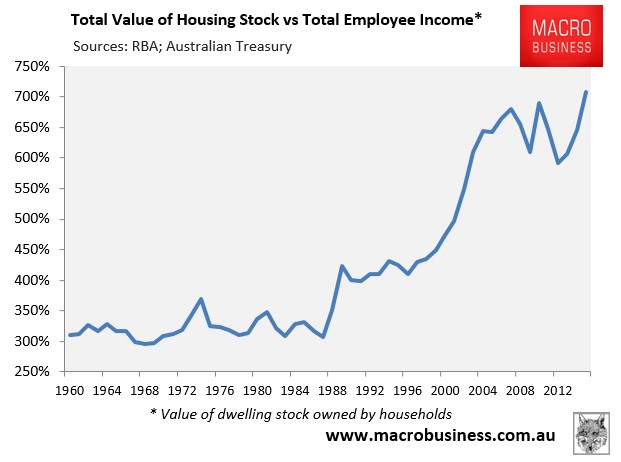
The situation is made worse by the bubble in Australian house prices, where values are at all time highs against incomes:
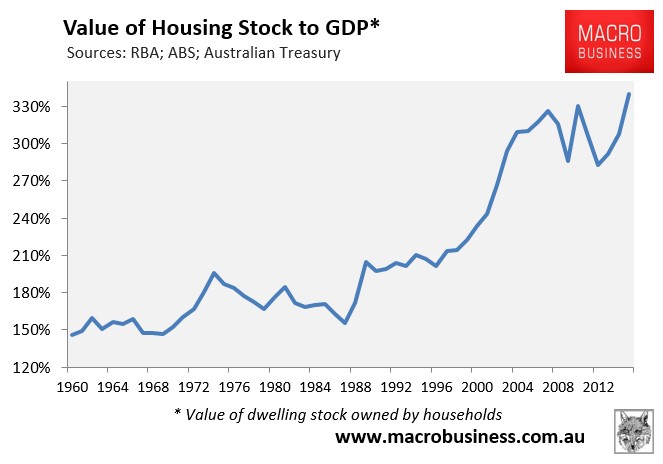
And GDP:
Australia’s capital city house prices were also nearly 30 times annual gross rents as at end-November 2015, according to RP Data, which is just under October’s all time high.
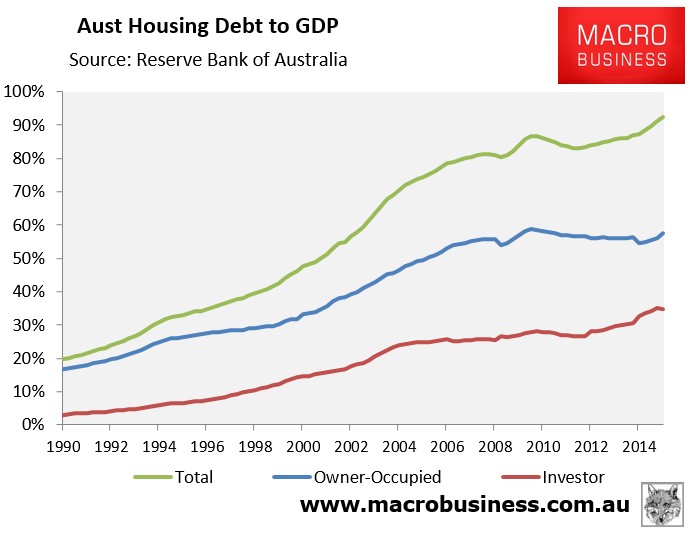
Finally, the mortgage debt supporting Australian housing is also at an all-time high 92.5% of GDP:
The boom in dwelling values has also been driven by unprecedented participation from investors – both domestic and foreign – which has prompted a belated response from Australia’s regulators.
Earlier this year, the Australian Prudential Regulatory Authority (APRA) introduced a 10% ‘speed limit’ on investor loan growth. APRA also boosted bank serviceability requirements such that an interest rate ‘buffer’ of at least 2% above the loan rate must be applied, with a minimum ‘floor’ assessment rate of at least 7%.
Australia’s lenders have since responded by tightening borrowing serviceability criterion on investor loans, lowering loan-to-value ratios on investor loans, limiting interest-only lending, and/or increasing interest rates on their investor housing loans.
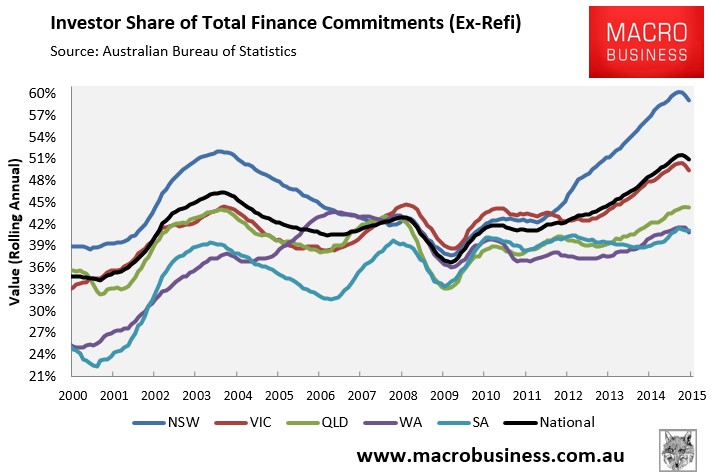
The impact on investor lending is beginning to show, with the share of total housing loans going to investors falling for two consecutive months, led by New South Wales (read Sydney) and Victoria (read Melbourne):
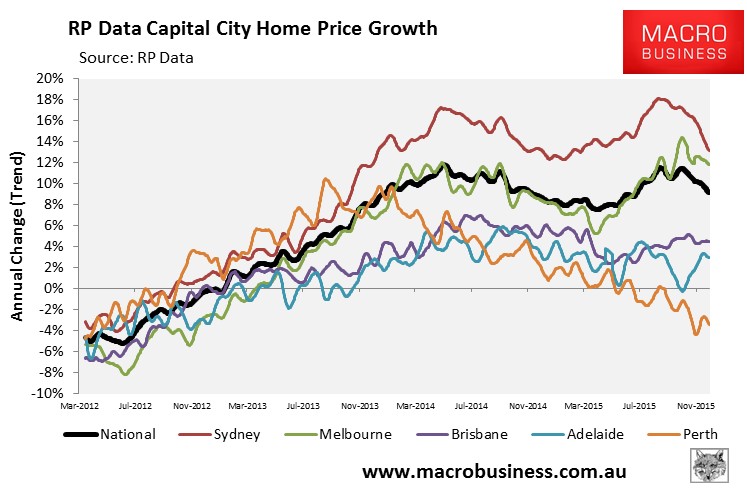
Auction clearance rates and price growth is also falling, led by Sydney:
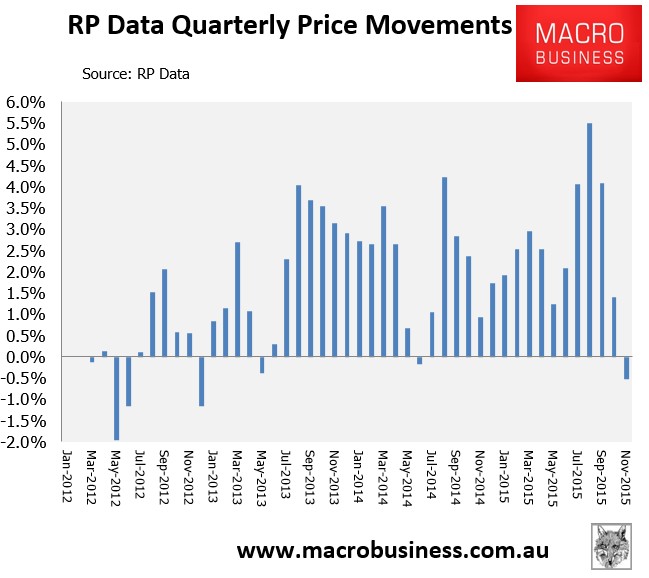
Moreover, November recorded the biggest quarterly decline in national capital city dwelling values since December 2012:
The screw will continue to be tightened next year.
APRA has announced an increase in capital requirements for Australian residential mortgage exposures under the Internal Ratings-Based (IRB) approach used by the big four banks and Macquarie. From mid-2016, the average risk weight of residential mortgage exposures using the IRB approach will increase to at least 25% from an average of around 17% currently, effectively reducing the amount the big banks can lend towards housing.
Moreover, on 1 December 2015, new penalties came into force affecting illegal foreign buyers of Australian residential real estate, along with third parties that assist them.
Australia’s foreign investment rules explicitly prohibit non-residents from purchasing established dwellings unless it is for the purpose of re-developing the site, usually by replacing one dwelling with two new dwellings.
Despite these prohibitions, foreign buyers have been actively purchasing established homes, which has helped create acute price pressures in places like Melbourne and Sydney, in particular:
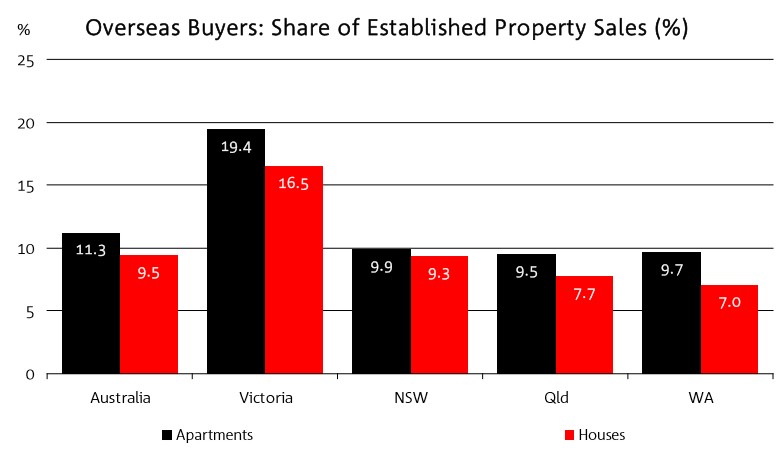
Under the new rules, which have just come into force, a foreign national that is found to have purchased an established dwelling without prior Foreign Investment Review Board (FIRB) approval, or has failed to dispose of a property once they have left Australia (in the case of temporary residents), faces increased penalties, including:
- Criminal penalty of $135,000 or 3 years imprisonment; or
- Civil penalty of the capital gain made on divestment of the property or 25% of the purchase price or market value of the property (whichever is greater).
For the first time, third parties that knowingly assist foreigners to illegally purchase Australian homes, such as real estate agents, lawyers, migration agents and accountants, will also face penalties of $45,000 individually or $225,000 for a company.
To help enforce the new rules, enforcement responsibilities have been shifted from FIRB to the Australian Taxation Office (ATO), with 50 enforcement officers now on the beat, armed with sophisticated systems and detailed data matching capabilities. Already, the ATO is actively investigating 532 cases of alleged illegal activity, with those numbers certain to escalate.
The new enforcement regime is likely to knock the wind out of foreign demand, removing another key pillar of support for Australian house prices.
Policy Ammunition Running Out
During past housing downturns, the RBA responded by slashing the cash rate and lowering mortgage costs, which led to a rebound in housing demand. During the millennial global recession, Australian mortgage rates fell 2%. During the GFC, Australian mortgage rates fell by 3.5%.
This time around, the RBA has less ammunition at its disposal. The cash rate is already at historic lows (2%), and as we approach the end of the business cycle the RBA likely has only around 150bps of cuts left in the chamber (we can’t go to zero owing to the current account deficit). However, rising bank funding costs on the back of the global commodity bust, along with higher capital requirements, means that real mortgage rates have very little room to fall as banks widen margins. Households will be lucky to get 0.5% of mortgage relief during the next crisis.
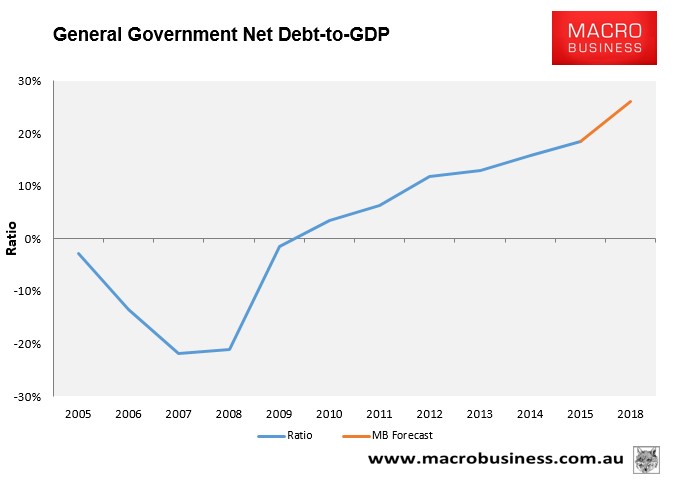
Fiscal stimulus is also likely to remain scarce. Australia’s AAA sovereign rating depends upon the government demonstrating a clear path to surplus across the cycle. That is what reduces the public debt stock to GDP ratio, which is the measure that the rating agencies monitor for balance sheet strength. And yet the Budget black hole continues to deepen at an alarming rate on the back of falling mining tax revenues and weaker than anticipated income growth.
Standard and Poor’s has openly declared that Australia’s net general government debt-to-GDP ratio must not breach 30% if the AAA is to be retained. The ratio currently stands at 18% and with fiscal bleeding necessary to support economic growth over the next two years, the ratio will continue to deteriorate:
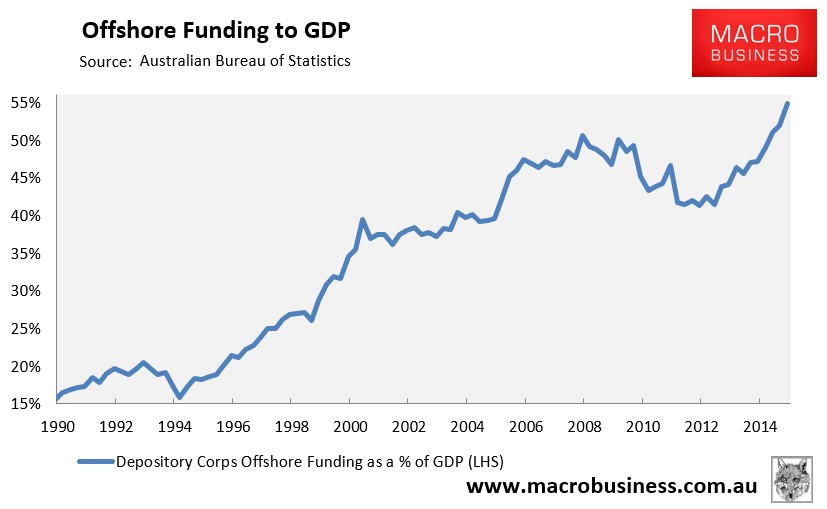
Moreover, because the government balance sheet guarantees the major banks’ offshore funding, they too will be downgraded when the inevitable sovereign downgrade arrives.
While Australia’s banks have always been heavy users of offshore funding, which has underpinned mortgage growth, this dependence has grown to unprecedented proportions, hitting a record 55% of GDP as at September 2015:
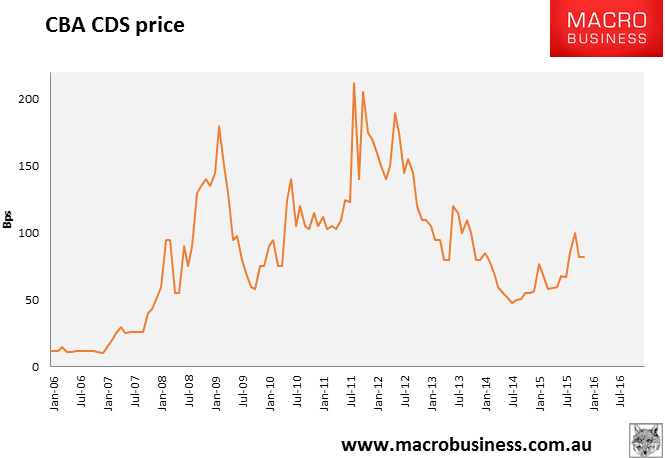
The danger is that the banks’ ability to continue borrowing from offshore rests with foreigners’ willingness to continue extending them credit. This willingness will be tested when Australia’s sovereign credit rating is downgraded (automatically downgrading the banks’ credit ratings), there is a global shock, or a sharp deterioration in the Australian economy (raising Australia’s risk premia).
Accordingly, Australia’s cost of funds will very likely rise just as it runs out of scope for monetary and fiscal policy easing. This has already been occurring through the early stages of the mining GFC with bank CDS prices rising steadily since mid-2014:
Conclusions for Australia
After 24 years of almost uninterrupted growth, 2016-17 is shaping up as Judgement Day for Australia.
The duel commodity price and mining investment booms that defined the economy for so long continues to unwind spectacularly, which is already reducing national income and will lead to widespread job losses over 2016-17 as mining mega projects are completed.
Meanwhile, the biggest player in the manufacturing sector – the automotive assembly industry – is scheduled to close, starting in October 2016 with Ford and followed by Toyota and Holden in 2017. This event will conservatively see a forecast 40,000 workers lose their jobs, mostly across Victoria and South Australia.
The key support of the Australian economy in 2015 – the housing market – is also anticipated to unravel from mid-2016 as dwelling construction begins to decline, and the bubble in prices corrects on the back of overvaluation, excessive debt, and regulatory intervention affecting domestic and foreign investors.
Moreover, as Chinese monetary easing continues alongside US tightening, the building commodities shakeout is taking on the dimensions of an historic bust, perhaps the largest in a century, and the fallout for commodity producers globally is darkening with the prospect of an end-of-cycle event in the next one to two years.
Sure, there will be policy support in the form of falling interest rates and larger Budget deficits, but these will be insufficient given the risk to Australia’s AAA credit rating, along with rising bank funding costs.
In summary, the Australian economy is facing storm clouds on multiple fronts, which will likely hit with progressing severity from mid-2016. Finding an historic analogue is no easy task but in measuring the potential scale of this event we can point at least to the 1991 recession. Beyond that one would have to examine the events of the 1890s depression to get a sense of how bad things could get.
We, therefore, believe that now is the time to position for the adjustment, be it by selling surplus properties, buying put options (insurance) against financial assets, diversifying investment portfolios into international assets, or simply paying down debt.