Given the equity market continues to price the future of major iron ore miners as if we are facing just another cyclical downturn, today I take a look at the iron ore price over the very long term in search of answers. Here is the nominal price of iron ore for the entire twentieth century sourced from the US Geological Survey:
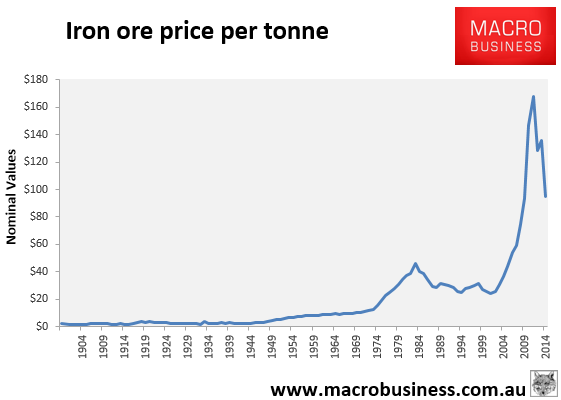
No real surprises there. The price was falling following the 1890s boom entering the century, then spiked briefly in the aftermath of the Great Depression, presumably as stimulus built stuff all over, then powered through post-war reconstruction and took off in the Japanese boom. It’s all a lot more obvious in the real price chart, which I’ve deflated using the US CPI:
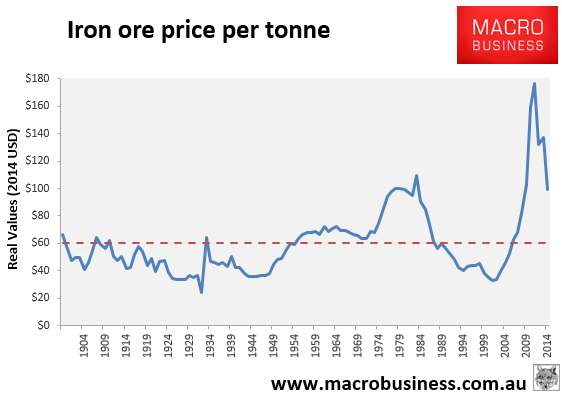
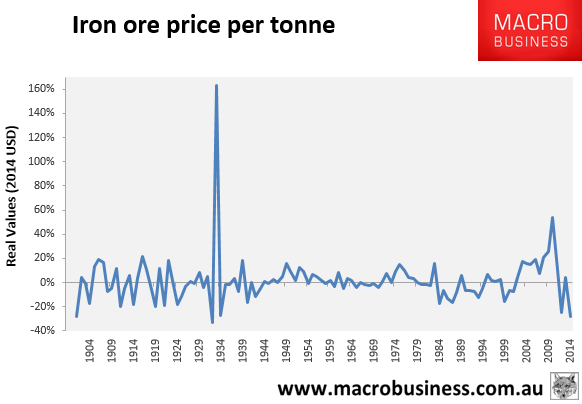
Amazing chart, really. Note that it is a yearly chart and the 2014 price average is still $99. Next year it will be more like $70 and the crash will be much more complete. The China boom is huge but perhaps not as out of proportion with the Japanese boom as some might expect. The China boom took off much more quickly and appears, proportionately, to be over more swiftly as well. The year on year growth chart shows the greater volatility nicely: