Our recent Sydney housing report argued that Sydney’s housing market, despite being Australia’s most expensive, is built upon relatively sound fundamentals, including tight supply, solid rental yields, and above-average jobs growth.
We then analysed the Melbourne housing market, which is built upon far shakier foundations and is arguably Australia’s major market most at risk of a significant price correction once the current cyclical upswing ends.
This week, we turn our focus to Brisbane, where investment fundamentals and valuations continue to improve, thus representing a better-than-average proposition for investors.
Affordability has improved:
The evolution of Brisbane’s housing market is illustrated by the next chart, which tracks detached house prices, as reported by the four main housing data providers: the Australian Bureau of Statistics (ABS); Australian Property Monitors (APM); RP Data-Rismark; and Residex, as well as a composite measure, which is the average of these indices. Residex has the longest running house price series for Brisbane, dating back to the late-1970s, whereas APM’s is relatively new. Despite minor variations, all four series have tracked each other fairly closely (refer to our our first August Members’ Report for an explanation of how each house price series is constructed).
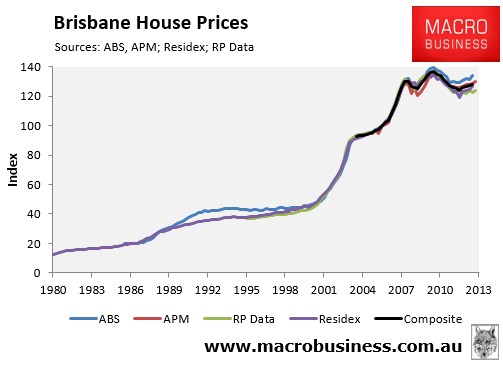
The June quarter price results for Brisbane showed the housing market growing at a subdued pace. The ABS (3.7%) and Residex (6.4%) recorded growth in excess of inflation in the year to June 2013, whereas RP Data (0.8%) and APM (2.4%) recorded growth at or below inflation, with prices also 6.6% below their 2010 peak when averaged out across the four data providers.
RP Data and APM, which have released results for the September quarter, revealed that Brisbane house price growth remains relatively lackluster, with prices rising by 1.2% and 0.7% respectively over the quarter and by just 1.1% and 2.5% respectively over the year.
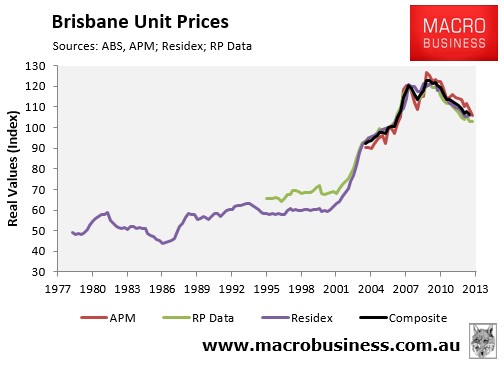
The recent price performance of Brisbane units has been poor, with APM (-2.1%), RP Data (-1.8%) and Residex (-0.9%) each recording negative price growth in the year to June 2013, with prices also 6.5% below their 2010 peak when averaged-out across the four data providers (see next chart).
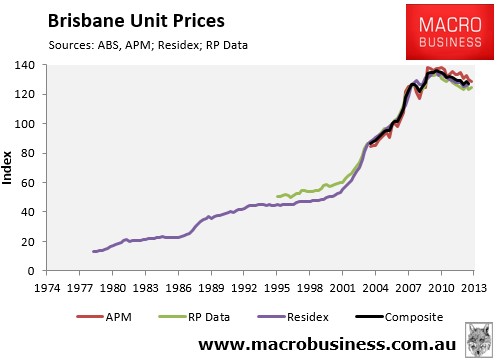
Results for the September quarter, released by RP Data and APM, painted a mixed picture, however, with RP Data revealing that Brisbane unit prices rose by 1.2% over the quarter to be flat flat over the year, whereas APM registered a 1.5% fall in unit values over the quarter, with prices also down 1.5% over the year.
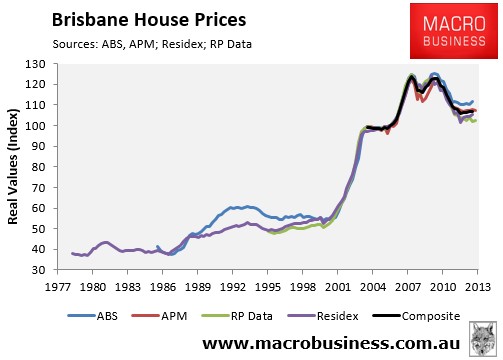
The next chart plots Brisbane house prices in real inflation-adjusted terms. According to this chart, Brisbane house prices were relatively stable until 2000, when prices surged by over 120% in real terms over the next eight years. Prices then dipped temporarily during the Global Financial Crisis before bouncing back to their former glory in mid-2010. Since that time, however, it has been a sea of red, with Brisbane house prices down by 13.5% when averaged-out across the four main data providers, representing the largest value destruction of all the major capitals.
Brisbane unit prices have performed equally bad in real inflation-adjusted terms, with prices also down 13.5% since peak, when averaged out across the four main data providers (see next chart).
The recent under performance of Brisbane housing has seen its median house price relative to the other capital cities fall to below long-run average levels, which suggests that Brisbane housing presents relatively good value (see next chart).
Supply tightening:
Brisbane’s improving housing fundamentals are also reflected on the supply-side, where construction levels and sales listings have declined and rental vacancies have tightened.
The construction of dwellings has flatlined over the past 20 years as Queensland’s population growth accelerated. In the decade to 2002, Queensland built 359,612 dwellings for a 643,653 increase in the population, representing a population-to-construction ratio of 1.8. By comparison, in the decade to 2012, Queensland built 363,758 dwellings for a 913,026 increase in the population, representing a population-to-construction ratio of 2.5 (see next chart).
The number of homes listed for sale in Brisbane has also fallen by 5% over the past year, from 27,717 sale listings in September 2013 to 26,428 as at September 2013. The total number of homes for sale remains relatively elevated, however, with Brisbane accounting for 19% of capital city for sale listings, which is well above its 14% share of Australian capital city households (see next chart).
Brisbane’s rental market also remains reasonably tight, with its rental vacancy rate trending down since 2009 to be broadly in line with the other capitals (see next chart).
However, despite its tightening vacancy rate, Brisbane’s rental growth has underperformed the other capitals in recent years, with gross house rents rising by only 8% since September 2009, compared with 11% rental growth in the other capitals (see next chart).
Nevertheless, Brisbane’s recent sharp house price falls, combined with rising rents, has improved rental yields significantly. Brisbane’s median gross house rental yield of 5.2% is well above the other capitals (4.7%), whereas gross unit rental yields are slightly higher – 5.5% in Brisbane versus 5.1% in the other capitals. This makes Brisbane housing a relatively attractive investment proposition from an income perspective.
Employment concerns remain:
Brisbane’s employment market remains soft which, if maintained, could put a lid on home price and rental growth going forward.
Measured on a 12-month moving average (12MMA) basis (in order to overcome seasonality), Brisbane’s trend unemployment rate was tracking just above the national average in September, although is has fallen over recent months (see next chart).
However, the full-time jobs market has collapsed to GFC levels, with the number of people employed in Brisbane full-time falling by 1.6% in trend terms in the year to September, compared with 0.1% growth nationally (see next chart).
In fact, the ratio of full-time to part-time jobs in Brisbane has fallen to its lowest level of record, further suggesting that the recent fall in unemployment is built on shaky foundations (see next chart).
The employment outlook for Brisbane is mixed. While the State Government has significantly toned-down rhetoric on cutting public sector spending and jobs, the mining sector faces large job cuts in roughly two year’s time as huge liquified natural gas (LNG) projects in Gladstone are completed, which will lead to sharp falls in mining-related capital expenditures (capex) from current record levels (see next chart).
Gladstone has three large LNG projects – QCLNG ($20.4 billion), Santos GLNG ($18.5 billion), and APLNG ($24.7 billion) – worth a combined $64 billion, which are scheduled to begin exporting LNG from next year through to 2015. Spending will peak in 2014 and the need for labour will begin to shrink, leading to large scale job losses. For example, according to industry reports, there are currently some 2,300 people working at the APLNG site at present, with the peak expected to be between 2,600 and 2,800 people on site. Once in operation, however, the APLNG workforce will drop to an estimated 175 people – a reduction in the workforce of nearly 95%. But the ripple effects are wider. QGLNG alone estimates it has tapped 12,ooo people in its construction phase. Times that by three…
While these jobs are obviously not in Brisbane, it is reasonable to expect a significant knock-on effect to the Brisbane economy and housing market. First, there are likely to be a significant number of workers in engineering, mining services, and mining company head offices that would be affected by the slowdown. There are also likely to be fly-in-fly-out workers that live in Brisbane that will be affected as the LNG projects wind down.
Potentially offsetting these headwinds is the prospect that the Australian dollar could fall significantly from its current elevated level, spurring the tourism industries of the Gold and Sunshine Coasts, which would obviously have flow-on effects to the Brisbane economy. Indeed, the ratio of overseas arrivals to departures is currently tracking near the lowest level in almost 30 years (see next chart).
As such, there is scope for a significant pick-up in tourism-related activity in the event that a lower Australian dollar encourages both more Australians to holiday domestically, as well as more foreigners to visit Queensland, which could offset the mining-related weakness. The issue will be timing. Will the dollar fall soon enough to offset the decline in LNG project spend?
But first home buyers have gone missing:
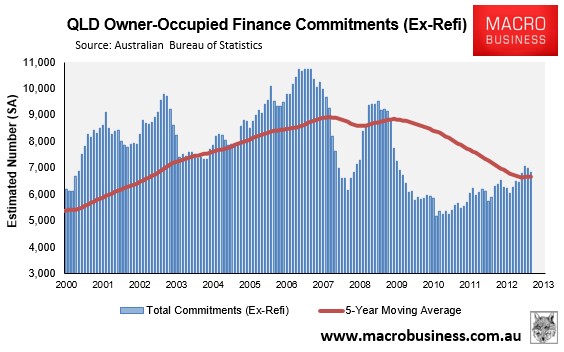
Mortgage demand has picked-up significantly in Queensland, with the total number of owner-occupied housing finance commitments (excluding refinancings) increasing by a seasonally-adjusted 9% in the year to August 2013 to be tracking 3% above the five-year moving average (see next chart).
One potential area of concern for Brisbane’s housing market is the absence of first home buyers (FHBs). In October 2012, the State Government removed the FHB Grant on pre-existing dwellings, which has led to a sharp drop-off in reported mortgage demand from this segment.
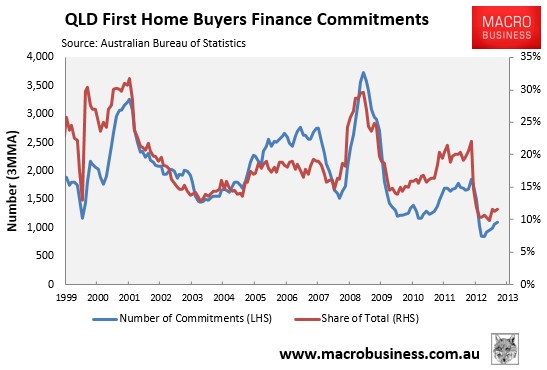
The number of FHB mortgage commitments fell by 38% in the year to August 2013, and were also tracking 38% below the five-year moving average. Further, the share of total finance commitments going to first home buyers was only 11.6% in August 2013, also well below the five-year moving average level of 18.3% (see next chart).
The absence of FHBs is a potential thorn in the recovery. In part, it can be explained by the pull forward of demand in 2009-10 as fiscal grants saw an historic surge in the segment. Also, the shifting of those grants to new homes will be playing a role.
That said, the drop-off in demand from FHBs may also be exaggerated somewhat, since without the incentive of grants being made available on pre-existing dwellings, some FHBs may not be getting identified when they complete the mortgage application process.
Bottom Line:
After experiencing one of the biggest declines in housing values in the nation, Brisbane’s investment fundamentals have improved significantly, with Brisbane housing now relatively affordable compared with the other major capitals and offering the best rental yields of the major capitals. Housing supply has also tightened recently and is fairly balanced, with relatively low rates of dwelling construction offset by a relatively large inventory of unsold homes (albeit 5% below last year’s levels), and rental vacancy rates more or less in line with the national average.
The economic outlook for Brisbane is mixed. Although large scale cuts to public services and jobs are no longer on the agenda, which is a positive for the housing market, the economy is likely to face stiff headwinds as spending related to three large LNG projects in Gladstone peaks in roughly one year and then starts to unwind, leaving behind thousands of jobs. On the other hand, tourism-related industries around the Gold and Sunshine Coasts face a potentially large rebound in activity in the event that the Australian dollar depreciates from its current elevated level, which would provide significant stimulus to growth and jobs.
Overall, with Brisbane housing values still well below their peak, relatively high yields on offer, and the employment market evenly poised, Brisbane housing is a relatively safe bet for investors looking for yield, capital growth forces appear neutral.
—————————————————————
October traffic update
MB unique users per week continue to impress…