
By Chris Becker

Here’s some charts that you should be watching at the moment, with my own notes and thoughts attached.
Remember, the following views are my own, do not constitute advice and are for information purposes only. As a trader, I may have positions in any or all of the below and their associated markets both long and short, on an intra-day, daily and weekly basis for my own account. Please seek advice from a licensed adviser before making any investment decisions.
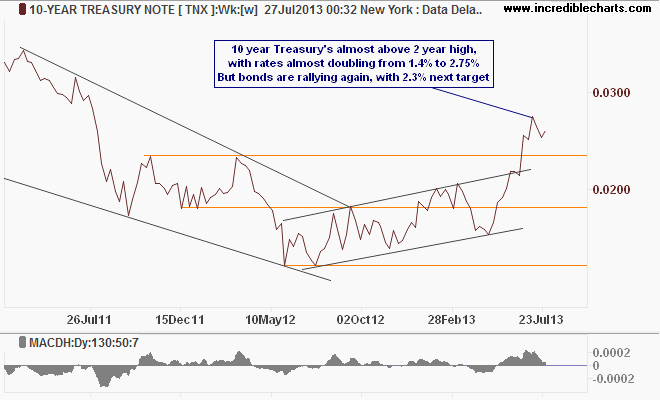
The US bond markets continued to consolidate this week with yields stabilising, but the trend is very clear, not good for new mortgage creation and student loan (i.e the twin staples of the US bubble economy):
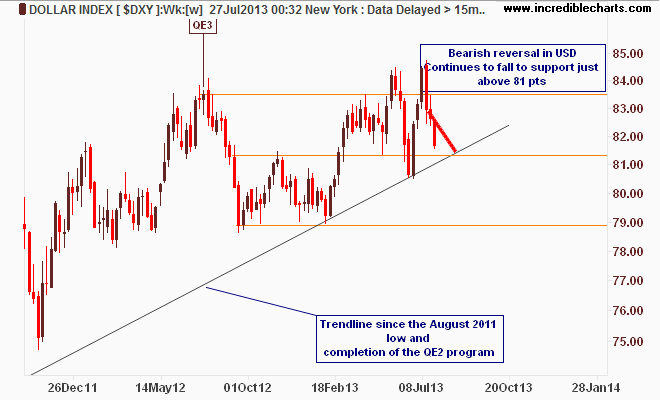
US dollar came down again this week, according to the script this should be just a dip in the long running trend from late 2011, but discussion over continuning QE and a new Fed Chairman (Larry Summers? FFS….lets put Lloyd Bankfein in charge of the RBA then)
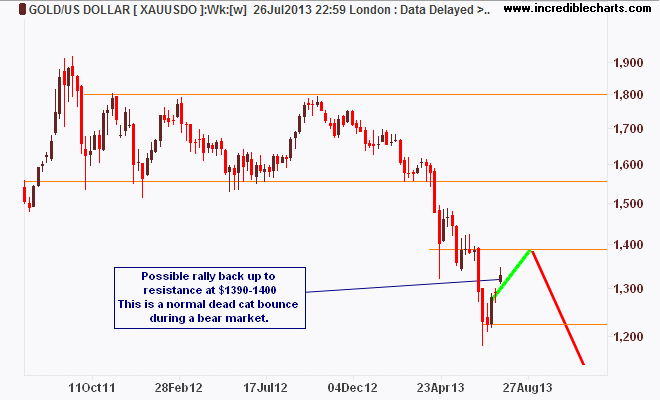
I’ve been saying for awhile there’s a slim possibility of a dead cat bounce up for gold up to $1400USD per ounce:. Here’s my weekly chart with original notations:
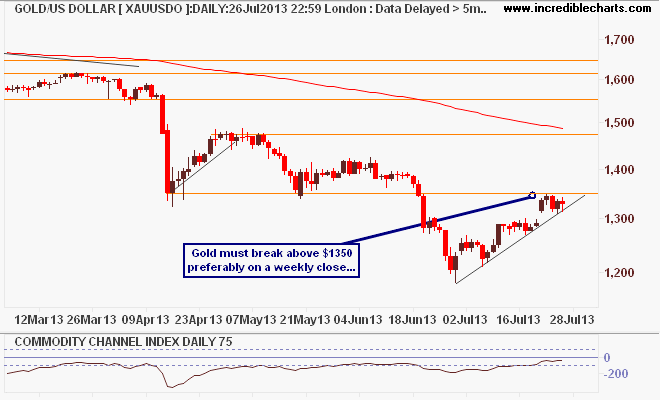
And the daily chart – pretty obvious that it needs to get above $1350USD per ounce, but this to me looks like a reflection of temporary USD weakness. But I could be wrong, so follow price first, opinion last, as always:
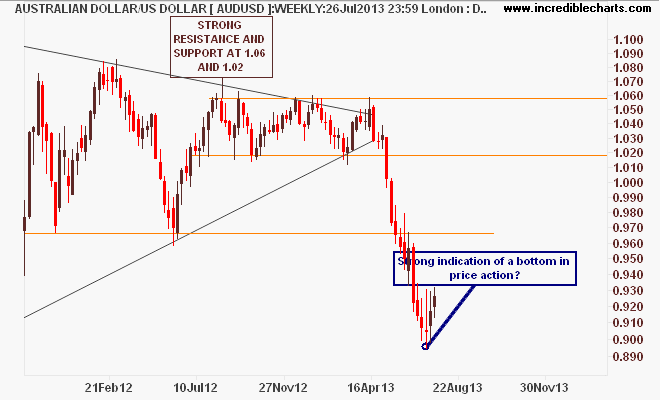
The other “golden” or safe haven currency, the Aussie dollar. Analysis of weekly charts has shown a possible bottom recently with a breakout above 93 cents back up to 96 cents only possible on a reversal in US strength.
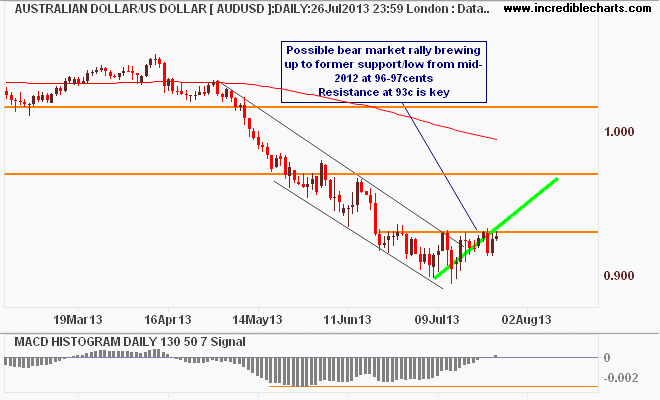
The daily chart looks similar to that of gold above doesn’t it? Again, this is a simple setup, although the CPI result this week muddied the waters, again price (and hence external forces) is king:
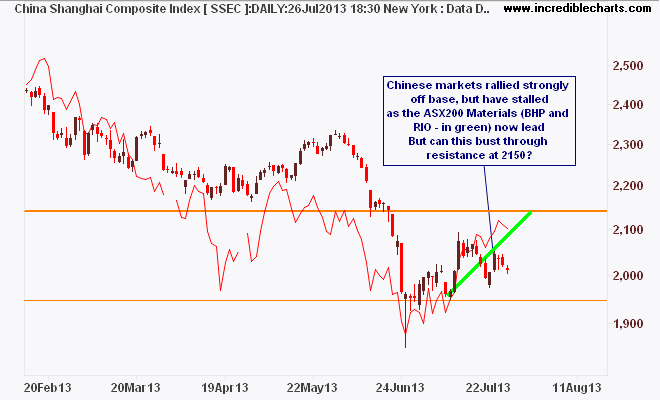
Chinese share markets continue to consolidate this week with a lot of selling pressure overhead. Check out the daily chart of the Shanghai Comp below, which the ASX200 Materials (in red) is now leading, maybe getting ahead of itself? Need to breach 2150 or so:
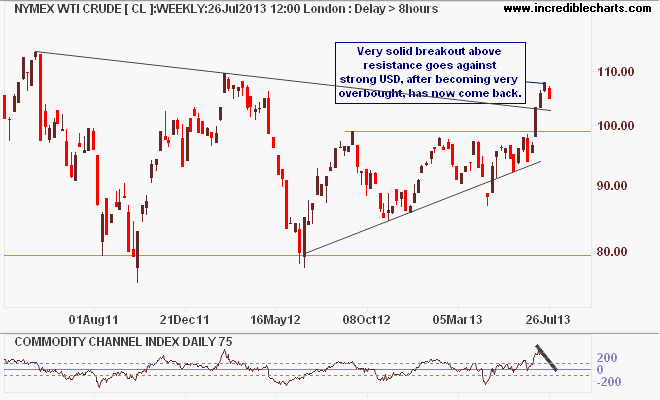
Thankfully for US consumers, crude oil fell 3% this week after becoming very overbought, but I fear this rally isn’t quite over. This market is ruled by speculators, first and foremost:
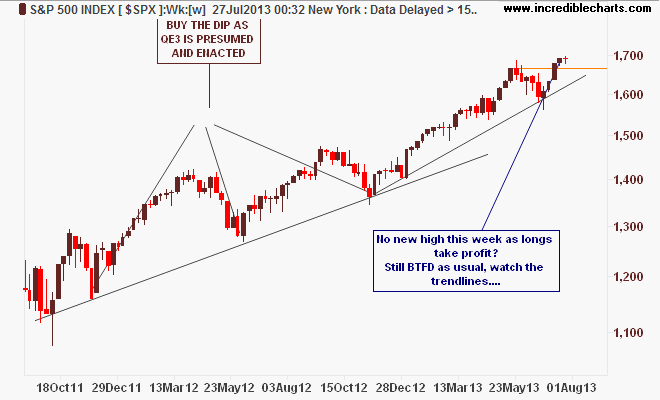
No new high on the major US stock market this week- the S&P500 – but it was a very very slight slip. Is this still a case of BTFD? Earnings so far haven’t brought about any surprises, but this looks like take (some) profit time for mind:
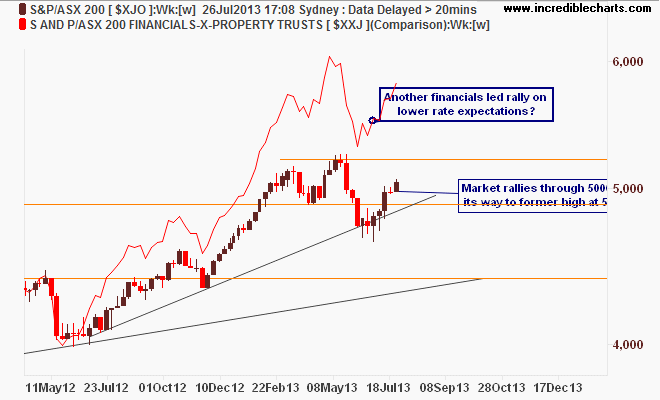
The local bourse, the ASX200, continues to eke out gains after its breakout in early July and broke through 5000 points this week, again on the back of financials (with some help from materials). Is this on expectation of rate cuts continuining and higher house prices?
Theres a strong possibility that the Australian market could follow its NZ cousin – which is being led by its own housing bubble (ia “our” banks) – are we brewing one here now for the same purpose? The charts point to that possibility….
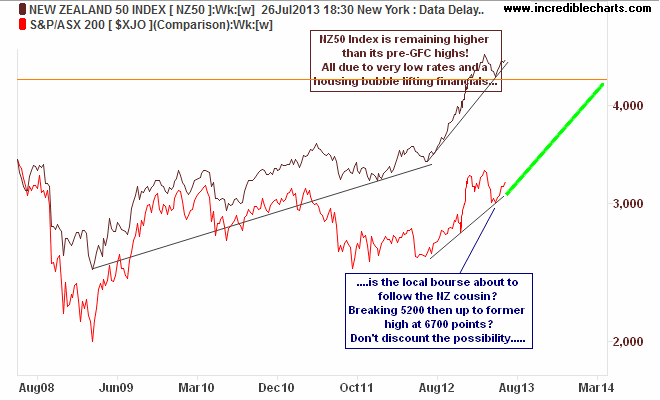
I never discount the charts, even if the macro is screaming the opposite…
Til next week, manage your risk first and the returns should follow.