Cross-posted from Bullion Baron
The current gold correction is closing in on the length of the rout that we saw in the middle of the 1970s bull market. However, the current correction is mild in comparison if we look at the percentages lost from peak.
Below figures have been calculated using the London AM Fix, intraday prices would show slightly different results. Historical data courtesy of Perth Mint’s website. The number on the x-axis is total number of days with a London AM Fix published, so doesn’t include weekends and other non-trading days.

After peaking in the final few days of 1974, gold started dropping from US$197.50 to a final low around 20 months later at $103.05 (48% decline, which is represented by the blue line in the chart above).
The price in the trough of the correction was below the mining costs for many Gold miners and impacted their profits (Financial Post):
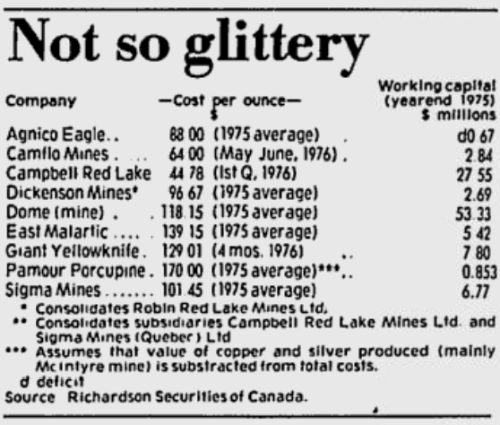
Gold mining costs in 1975
There’s no way to pinpoint an exact reason for any short term price fluctuations in Gold, but the size of the drop into the 1976 low was most likely influenced by the start of the IMF Gold sales, selling around third of their holdings:
I’m not sure how prevalent technical chart analysis was by individual investors and traders at the time, but no doubt the almost halving in price back then would have had some pointing to broken levels of support, Fibonacci ratios or their proprietary system which pointed to end of the bull market. Even Milton Friedman said that while unpredictable he anticipated Gold to trade in a range between $90 and $140 (this article when gold was at $107, a month before the final low):

Little did those with a bearish outlook know that a rally was just about to take place which would add nearly 50% to the price of gold in 7 months with a final parabolic climax not long after which took the price from $170 to $850 (5x) in 2 short years.
After peaking more recently in September 2011 at $1896.50 (as earlier, figures are all London AM Fix, intraday peak was $1920), the price dropped fast, followed by drifting sideways for around 15 months and has recently started falling again after piercing support at $1500.
Of course Gold’s current correction may not have played it’s course yet. To match the length of the midpoint correction in the 1970s bull market Gold would need to continue correcting for another 2-3 weeks. To match the 48% decline Gold would need to drop to around $985 (a highly unlikely scenario in my opinion).
As we saw in the 1970’s price rout these lower prices are putting extreme pressure on the profitability of Gold mining companies (ABC News):
Gold miners in Western Australia are calling on the State Government to provide the sector with royalty relief until prices improve.
The managing director of Pilbara miner Northern Star Resources, Bill Beament, says many of the state’s gold miners are high cost producers struggling to make money amidst wildly fluctuating values.
He says if prices do not improve, many miners could go out of business.
The slump shocked the industry which had already seen local producers, Navigator Resources and Kentor Minerals go into administration and other smaller miners merge.
Mr Beament says while he operates a high grade, low cost mine, he’s one of the few in WA.
“Even before the gold price dropped around Easter, we saw two gold producers in WA go into administration so that started showing that some of the high cost producers, some of the marginal ones out there, are really going to struggle,” he said.
“If the gold price hangs around this price, sub $1,400 an ounce, we [the industry] could be in trouble, there’s a lot of marginal producers out there, this could send a lot of them to the wall.”
While there are gold miners with lower costs internationally, most Australian miners have costs well above the $1000 level (SMH):
A recent Bell Potter survey of 15 mid-tier Australian producers showed that total production costs averaged $1170 an ounce.
Bell Potter analyst Mark Paterson said five of those 15 would be marginal at the present price.
JPMorgan gold analyst Joseph Kim reckons the gold miners under his coverage have ‘‘all in’’ production costs of between $1050 to $1130 per ounce.
But he stresses that companies have numerous individual mines that are more expensive to run than that, such as Newcrest Mining’s Hidden Valley mine in Papua New Guinea, Oceanagold’s Reefton mine in New Zealand, Evolution Mining’s Edna May mine in Western Australia and Alacer Gold’s assets near Kalgoorlie.
‘‘In our view, persistent weakness in gold could result in revisions to life of mine production plans and scheduling, or even outright closures, as miners react to revised economics under lower gold price,’’ he wrote.

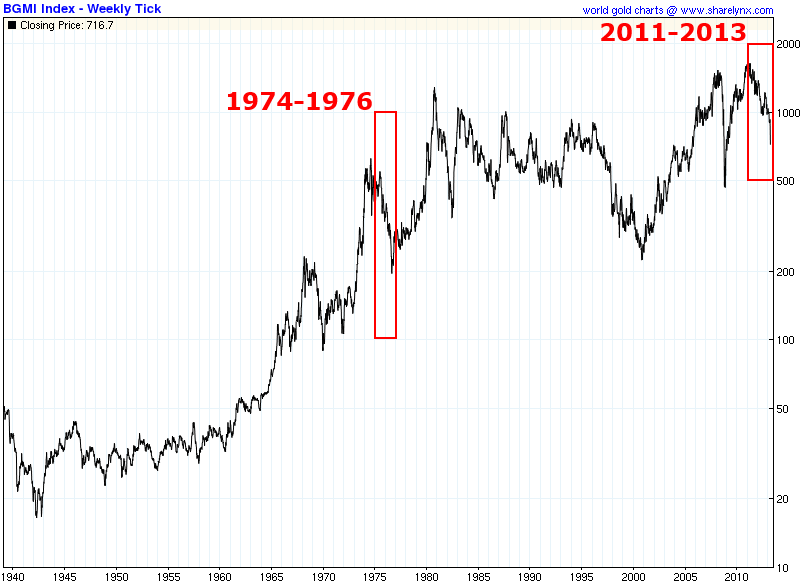
Any sustained lull in gold around AUD$1300-1400 (or lower) is likely to impact heavily on Australia’s Gold mining sector. The squeeze in margins is already reducing the profitability of Gold miners and being reflected in their share prices (as it was in the 1970s, see below Barron’s Gold Mining Index):
As reported by Leith on MacroBusiness gold exports account for around 7% of our commodity exports (by value). Not only is a lower gold price bad for the mining companies themselves (and their shareholders), it’s also a blow to the Australian economy & Government budget (revenues).

Australia is the worlds second largest gold producer, behind only China who are net importers of gold. Given Australia’s national interest in having a high level of Gold exports & miner profitability, it defies sensible reason that economists such as Stephen Koukoulas would try and knock the metal, in fact he should have reason to cheer it higher.
Where the gold price goes from here will be decided by the market rather than charts or history repeating exactly. While the costs to mine gold are unlikely to provide any support in way of a “price floor” in the short term (new mine supply only adds a small percentage to overall supply each year), the immense scramble for physical (and resultant retail shortages) suggests that there are buyers prepared to step in front of the falling knife and buy at current levels. That may not indicate we’ve seen the low if the futures market takes spot lower, but given that this buying has been occurring from India, to Japan, to China, to the US and in Australia I would say there is good reason to expect the price won’t fall much further, certainly not to the sub $1000 level that would be required to match the 48% correction seen in 1976 (and for Koukoulas to win our bet).
As these charts from Tiho at The Short Side of Long show, we could still have a long way to go if the gains of this bull market are to match that we saw 30 years ago.
Gold vs Stocks in the 1970’s:

Gold vs Stocks in the 2000’s:

While there is no guarantee we get another blow-off top, as has been the theme of this blog since it’s inception, it’s my opinion that gold will head higher into a similar bubble peak. The metal won’t race into a parabolic move without taking the miners with it (eventually) and by the end of the bull market it is my opinion their after total costs profits will be measured in thousands of dollar per ounce rather than hundreds. No doubt there will be more casualties between now and then though, make sure you pick any Gold miners carefully.
