The S&P/ASX 200 Index closed up 69 points or 1.6% today to 4275 points following a strong finish to the week on US and Euro markets on Friday. In after hours trading, the index is down slightly, with Euro and US markets also pointing to modestly higher opens.
Asian markets experienced similar moves, with Japan’s Nikkei 225 up 1.72% at 8898 points, whilst the Hang Seng rose over 1.3% to 18749 points.
In other risk assets, the AUD is currently trading at 103.05 cents USD (a week ago it was 97 cents….), whilst WTI crude rose slightly to $87.11 USD a barrel.
Gold was steady during the Asian session, currently at $1681 USD an ounce or $1630 AUD an ounce.
Advertisement
Movers and Shakers
Another bright shiny green board on the ASX, with all sectors up, the biggest winners financials, energy and materials (as always it seems).
All of the banks were up strongly, with ANZ up 1.7%, Commonwealth (CBA) also up 1.7%, NAB up nearly 2% and WBC up 1.7%. Macquarie (MQG) was bid up strongly again, rising 2.6% for the day.
Cochlear (COH) continued its strong rally (almost 20% off its low) to close below $55 as investors await the AGM tomorrow, whilst CSL rose 0.7%.
Advertisement
BHP Billiton (BHP) had another good day – up 2% and Rio Tinto (RIO) was up 2.4%, whilst Newcrest Mining (NCM) went up 1%, Fortescue (FMG) up 4.5% and Woodside Petroleum (WPL) up about 1%.
The Charts
My guaranteed indicator of market volatility – a large event in the Prince’s Household – has worked again (it’s a girl). Last week I called this “the unreal undollar rally“. It’s more appropriate to call it the “Tom Jones” rally….it’s not unusual….
Sorry, but this is a typical bear market rally. In the absence of bad news or deadlines (except the G20 meeting coming up) or a spate of “good” data, coupled with exhausted and profit hungry bears, 5-20% rallies after a 10-20% correction have occurred many, many times in the past.
Advertisement
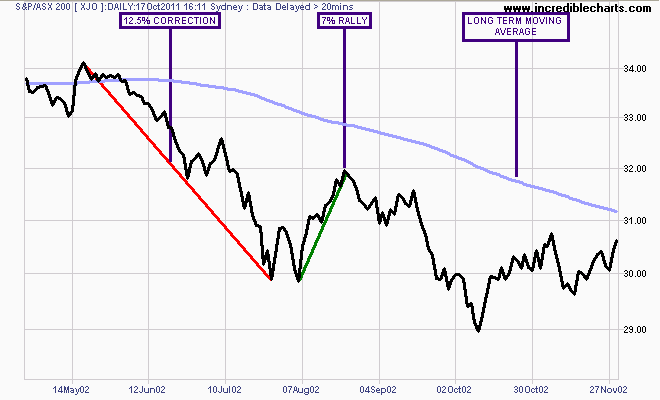
First, look at the 2001-03 bear market where after topping in May/June of 2002, the market corrected some 12.5%, the rallied 7%, although at no stage did it threaten the long term moving average (light blue line):
After the failed 7% rally in Aug 2002, the market fell a further 15% by March 2003
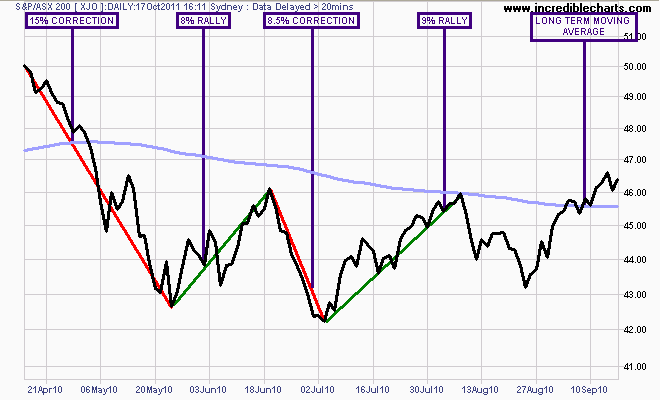
More recently, post the May 2010 Greece crisis, we saw a 15% correction, followed by an 8% rally. Then another correction wiping out all of these “gains”, before another rally. The market finally broke through, helped by a little “milkie wilkie“, surpassing its long term moving average in early September:
Advertisement
Although a daily chart, the weekly chart is a better use to gauge a "breakthrough" of the longer term moving average.
This pattern and price movement has been repeated across many types of markets (particularly the Nikkei 225) and is a clear characteristic of a bear market rally.
This provides some analysis to consider what we need to see for a continuation of this rally. As I said last week:
Advertisement
First, the ASX200 always follows Europe and US so watch for their leads.
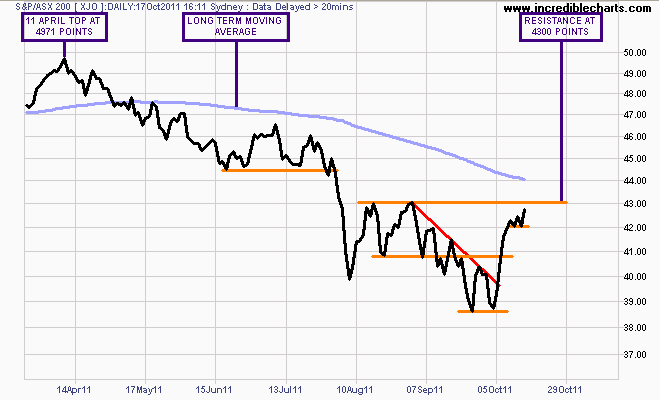
Next, the local market needs a weekly price close above the medium term moving average at the congestion area at 4100 points. (since completed) Further support of the rally will come when very strong resistance at 4300 points is breached and therefore the road is clear to the long term moving average at around 4400-4500 points.
Daily chart of ASX200 shows clear resistance at 4300 points.
A weekly close above the last level is characteristic of a strong probability of a continued rally. Since this has not passed, I still consider this a high risk rally and not an entry point for investors of any timeframe except a period of weeks and months.
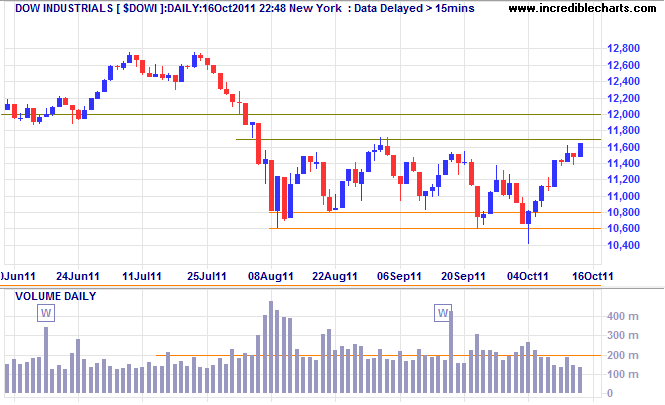
However, the ebullient US markets (particularly the NASDAQ) may change this view over the coming week – from Colin Twiggs comes this chart and analysis:
Advertisement
Dow Jones Industrial Average is testing resistance at 11700. Breakout would warn of a primary advance, but the market is prone to false signals because of excessive volatility and it would be prudent to wait for confirmation. Respect of 11700, or a false break above 11700, would re-visit support at 10600.
Watch my “Chart of the Day” posts for continued analysis of US, Euro and Asian markets.