The RBA released its quarterly Household Finances ratios (B21 XLS table) yesterday, which highlights the following ratios going back to March 1977 (in most forms):
- Debt to Assets
- Housing debt to Housing Assets
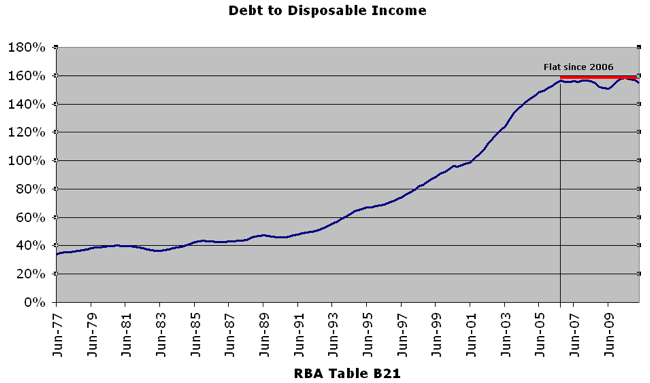
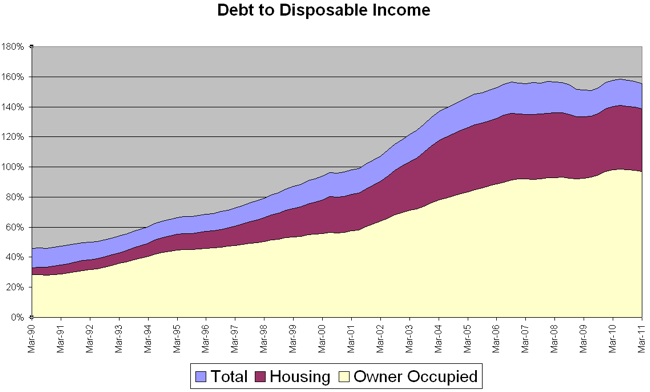
- Debt to Disposable Income (total, housing and owner occupier)
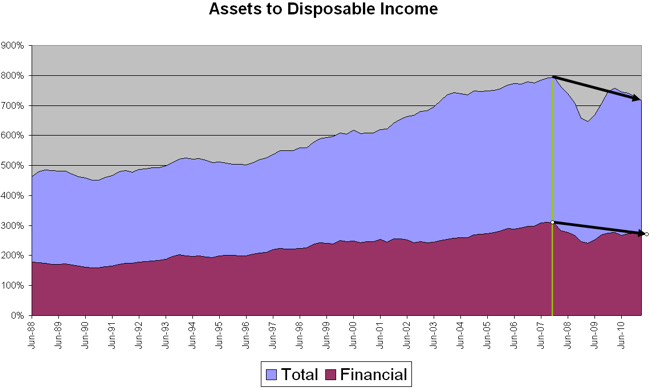
- Assets to Disposable Income
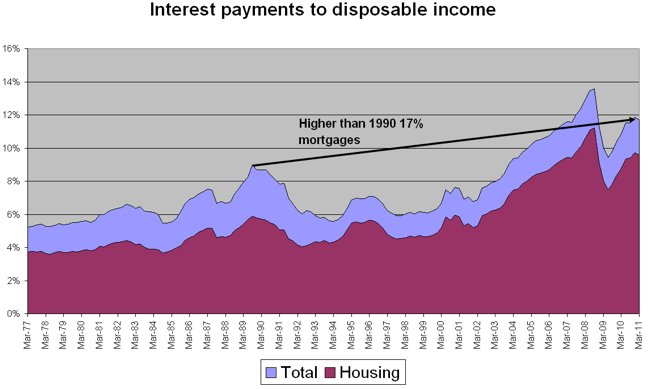
- Interest Payments to disposable income
Instead of waiting for the monthly chart pack (which I’ve reviewed previously here and here) here is the data represented graphically.
First, Debt to Disposable Income has been at ca. 160% since June 2006. The small decline in 2008 was rebounded by the “RuddPrime” mortgage increase, but that too is passing, and the trend is flat.
Housing debt comprises the majority (89% of total debt), with owner-occupiers housing debt comprising 62% of total (at 97% of household income).
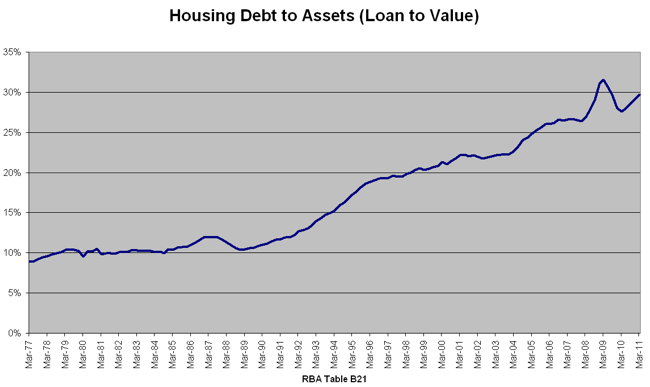
The global loan value ratio (LVR) of housing debt to assets is 29.7%, down from the March 2009 peak of 31.5%, but still on trend from the 1995 “structural” change.
The asset to disposable income ratio has still not recovered from pre-GFC Episode 1 highs (September 2007), down approx. 10% in both financial and total asset values.
Finally, the serviceability of the outstanding debt requires 11.7% of total disposable income (9.6% for housing debt), which is well above the long term average at 7.5%, and the highs reached during the scorching 17% high interest rate period of the early 1990’s, but still below the pre-GFC high of 13.6% in September 2008.

Interestingly, the current average standard mortgage rate (just below 8%) when last reached in 2006 and before that during the year 2000, required just above 10% and 6% of household disposable income respectively, compared to the near 12% of today. This is purely a function of the higher debt levels and maybe something for bullhawks to look at more closely before espousing more rate rises.