
With a lot of talk recently in the mainstream press about why the Australian share market is going sideways (with the requisite bullish notion that it will go up 10% year on year), I thought I’d examine a series of world markets from a Big Picture perspective.
I’ve developed a long term price-based system that I primarily use for adjusting my asset allocation or position size for overall risk management. The time period I look at here is usually 5-6 years before scaling into shorter term price charts.
It measures the yearly change in price, monthly closing price, momentum (rate of change), and price direction adjusted for volatility. There are vagaries between markets (Asian markets are much more volatile, as is the NASDAQ compared to the Dow Jones 30) but the concepts are the same.
From this analysis, I determine what type of secular trend is in place (bull or bear, based on the year-on-year change in price), the current market condition and the probability of future price changes.
Here’s my summary of where the major markets stand at the moment, with a color-coded table at the end:
Equities
ASX200 – has gone nowhere nominally for five and a half years, but in the medium term has stalled since late 2009. The medium term points to bearish conditions to continue. See my weekly analysis post here for more info on the Aussie market.
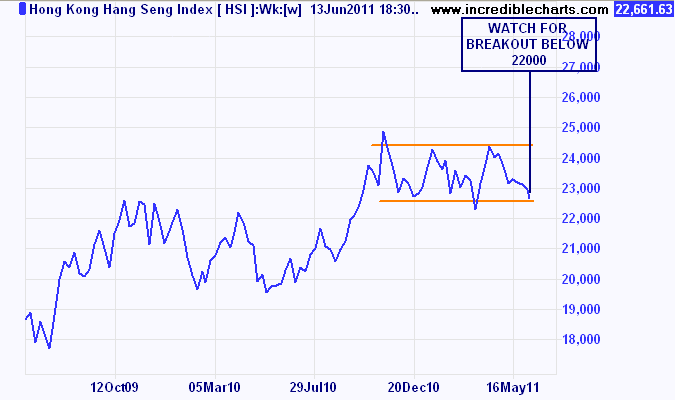
Hang Seng – although volatile, the Hong Kong bourse has been gliding along between 22000 and 24000 points since October last year, with a recent correction. A breakout below this bottom range is very bearish.
Hang Seng in sideways channel (weekly closing price)
Nikkei 225 – still in 25 year bear market and 50% down since 2007 highs. Tracking sideways – a breakout below 9000 points is very bearish.
FTSE 100 – technically in a bear market (but less than 10% off 2007 high), the UK bourse is hitting heavy resistance at 6000 points. The outlook is bearish.
DAX – the DAX is in a similar position to the FTSE but is not as weak with a lot of buying support during the recent correction. A look at the two economies explains why. A monthly close below 7000 points would be bearish, however.
S&P500 – now in its 11th year as a secular bear market, and still almost 20% off its pre-GFC highs, the performance in the last 2 years is impressive nonetheless. The current correction is mimicking the May 2010 version and is likely to continue, sans stimulus.
NASDAQ – the tech heavy index briefly broke its 2007 highs so it just qualifies as being a bull market. This industry is getting great advantages from the weak dollar (look below) but is overbought and overvalued. In the short term a close below 2600 points would be very bearish.
Dow Global – this aggregate stock index clearly shows the depth of the correction in world equity markets since the May highs. Current activity is replicating the falls in May last year and is very bearish.
Currencies
AUD/JPY – resistance at 90 and slowing momentum – the ASX200 is highly correlated with this currency pair. A new bull market in Aussie stocks requires a breakout above 90.
AUD/USD – resistance at 1.10 and is likely overbought. Directional movement is stalling. Has strong buying support above parity however.
EUR/USD – second try at going higher than 1.50 has stalled. This is still a bear market rally and could reverse quickly in the medium term.
USD/CHF – secular bear market, freefalling and could be oversold in medium term – but what would you rather own?
EUR/CHF – another classic bear market, at historic lows. The Swiss Franc is still powering away – parity is the next target. Again, a flight to safety still exists in Europe, even without the Mark.
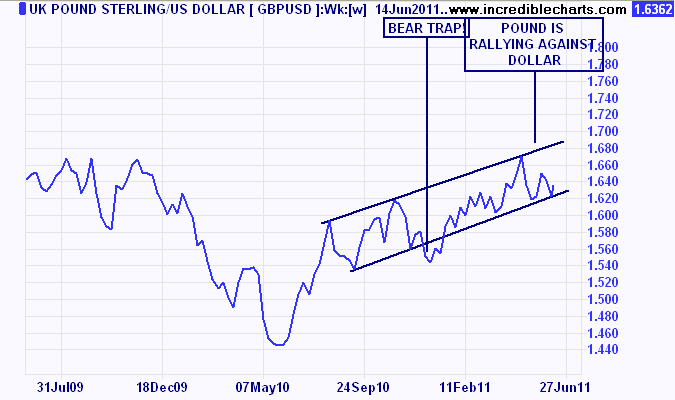
GBP/USD – this is a bear market rally, and has not yet broken out into a secular bull market (breakout above 1.70 would confirm) All eyes are on UK inflation data.
The Pound continues to rally against the US Dollar
US Dollar Index – the aggregate index against the US dollar is in a bear market, at near historic (GFC was slightly lower) lows. An impulse rally at the end of QE2 is likely, but won’t crack the bear market just yet.
Commodities (all in USD)
Gold – classic bull market – 10 years straight, with a defined medium term trend since the December 2008 lows. Must stay above $1500 by mid-July to continue this trend. Current condition is sideways, with a probable sell-off in the near term due to end of QE2. Linear regression of the megatrend shows a broader correction to $1300 is feasible in any “GFC Mk 2”.
Oil – although technically in a bear market (high of $140 per barrel before GFC), oil has increased year on year since the oversold lows on December 2008. Currently sideways after MENA action, but long term very bullish.
Copper – tried to break through $10,000 per ton and has corrected to $9,000. Still respecting its long term average, copper could reverse sharply on the face of any global slowdown.
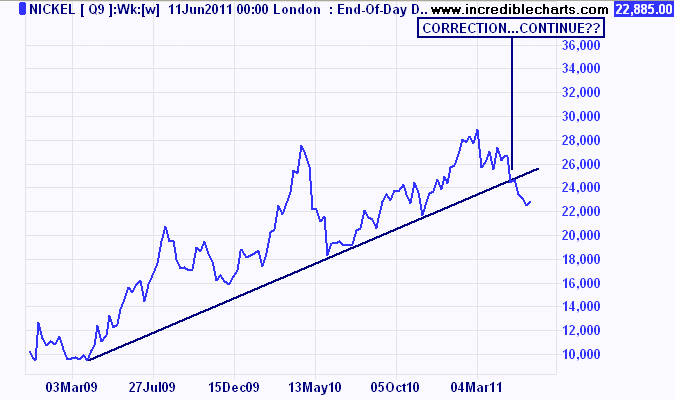
Nickel – like oil, technically in bear market but has doubled in last two years (still half its 2007 high). Has undergone correction which may continue on news that a massive surplus is building. Breakout below $22,000 per ton is very bearish.
Nickel looks extremely weak here. Surpluses are building.
Silver -the volatile precious/industrial metal is still within a massive bull market (400% in 2 years) but has solidly corrected after almost reaching $50 per ounce. Is hovering sideways and appears weak.
Natural Gas – the only commodity in a secular bear market, has had a good rally this calendar year. Breakout above $5 would continue the rally strongly.
Bonds
US 10 year T-Notes – technically in a bear market (yields were lower during the GFC) the 10 year has been in a volatile sideways pattern for 3 years. Currently rallying on the back of equity market weakness.
US 30 year T-Bonds – like its shorter term brother, with yields approaching 4% again. In a decelerating 30 year plus mega-bull rally, likely to hover at current prices or slightly higher. Or did PIMCO get the timing right?
Summary
Markets are on the whole correcting or moving sideways, with the only out and out bullish activity seen against the US dollar. Commodities on the whole are getting weaker and could reverse on any further global economic weakness. Equity markets appear overstretched and have failed to claw back the losses since the GFC, even in the face of record stimulus and near or below zero real interest rates. It’s not looking pretty out there for long-only investors.
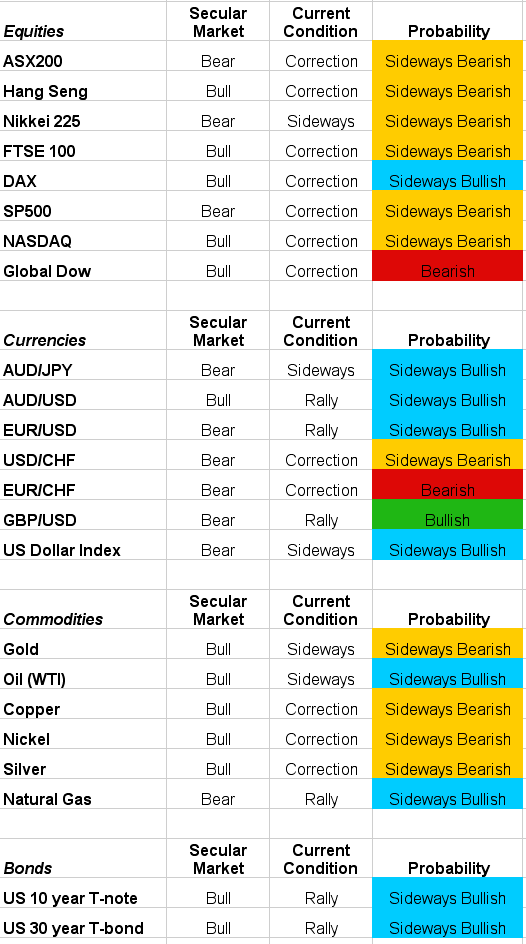
Summary of markets