
The S&P/ASX200 Index closed the week slightly lower at 4562 points, a 0.4% fall, extending a 400 point or 8.2% loss from the mid-April high of 4971. This move is identical to the February/March Japanese earthquake correction signaling very high volatility in the local bourse.
SPI Futures put the opening price for the market on Tuesday (Monday closed for public holiday) at 4531 points – a further 30 point drop. This is likely to be affected further as the local market will have to digest another night of trading on European and US markets, all of which are pointing to continued losses.
By sector, the ASX200 Resource index is down over 12%, the ASX200 Industrials index is down just over 5% and the ASX Small Ords is down almost 13%.
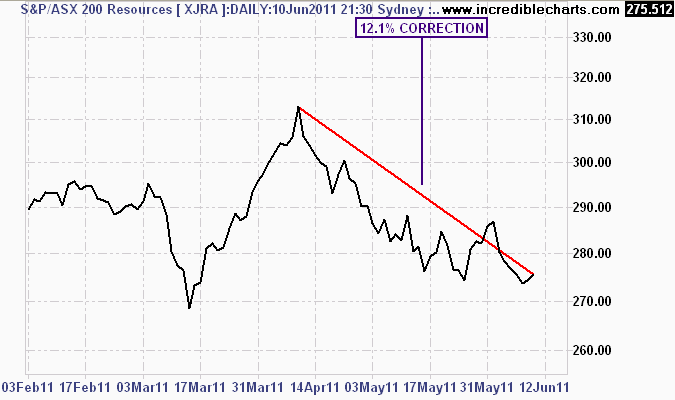
ASX200 Resources Index daily chart
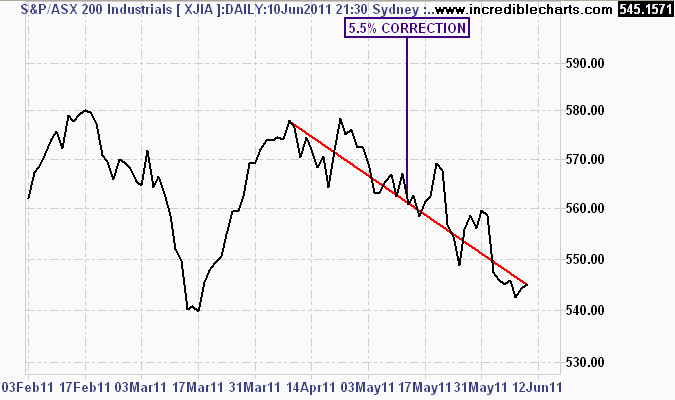
ASX200 Industrials daily chart
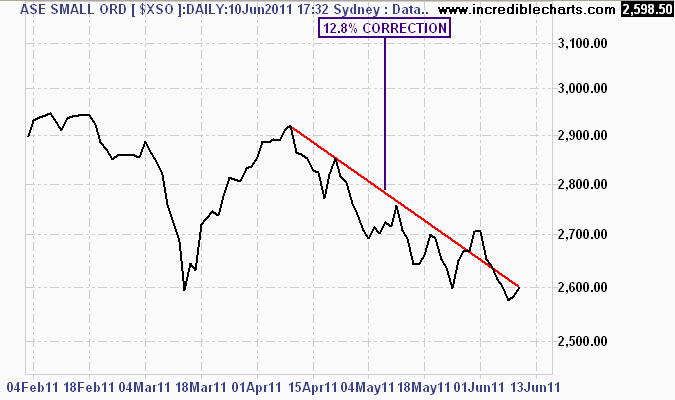
ASX Small Ords daily chart
Analysis
This is a broad based correction, with banks, small and big resource companies affected. Let’s have a fractal look at the market, starting on daily the weekly and monthly price charts.
The daily chart shows how this week’s activity has centered around the middle of the trend channel from the April highs, with a tentative bounce off the 4500 level. This is not firm enough to warrant a breakout and not many investors or traders were willing to hold positions over the long weekend.
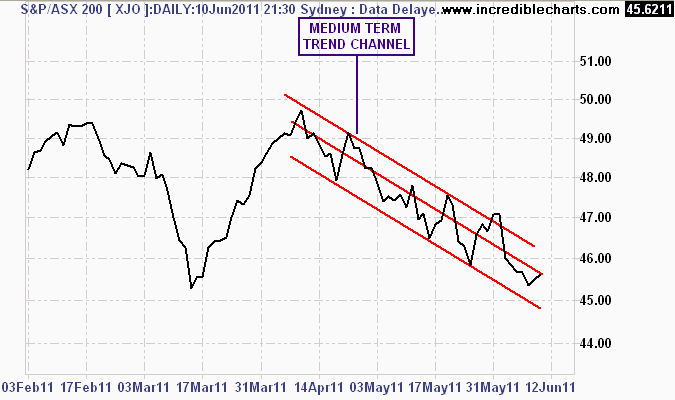
ASX200 Daily chart
The weekly chart shows how the correction has broken below the medium term trend from the May 2010 flashcrash. A double top failed to penetrate the historical high at 5000 points. This chart is very bearish, with a target range of 4200-4300 points over the next month or two. Failure to support this level will instigate a new bear market in stocks.
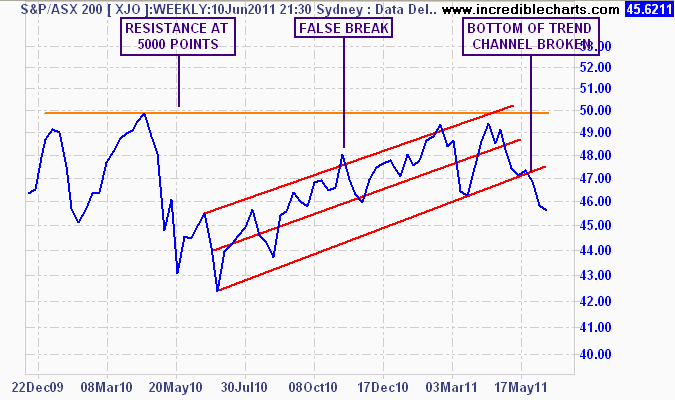
ASX200 Weekly chart
The monthly chart shows the downside potential clearly. Marked in pink is the 260 day weighted moving average, my preferred lagging indicator for market direction. The monthly price has closed below the average, which itself is starting to roll over, indicating a new bear market.
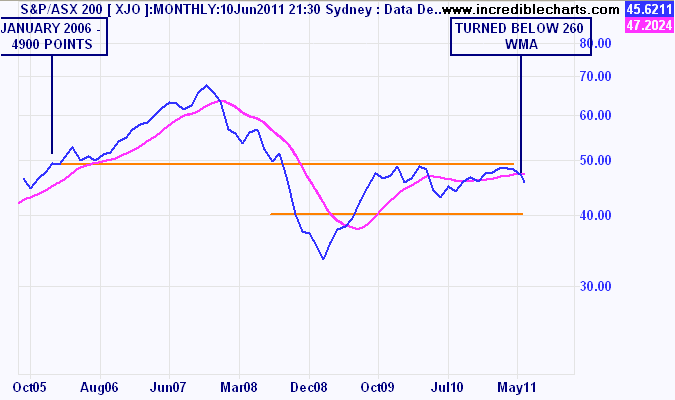
ASX200 Monthly chart
The lower orange support line, marked at 4000 points is the target range for any broad sell off, with probable overshoot below.
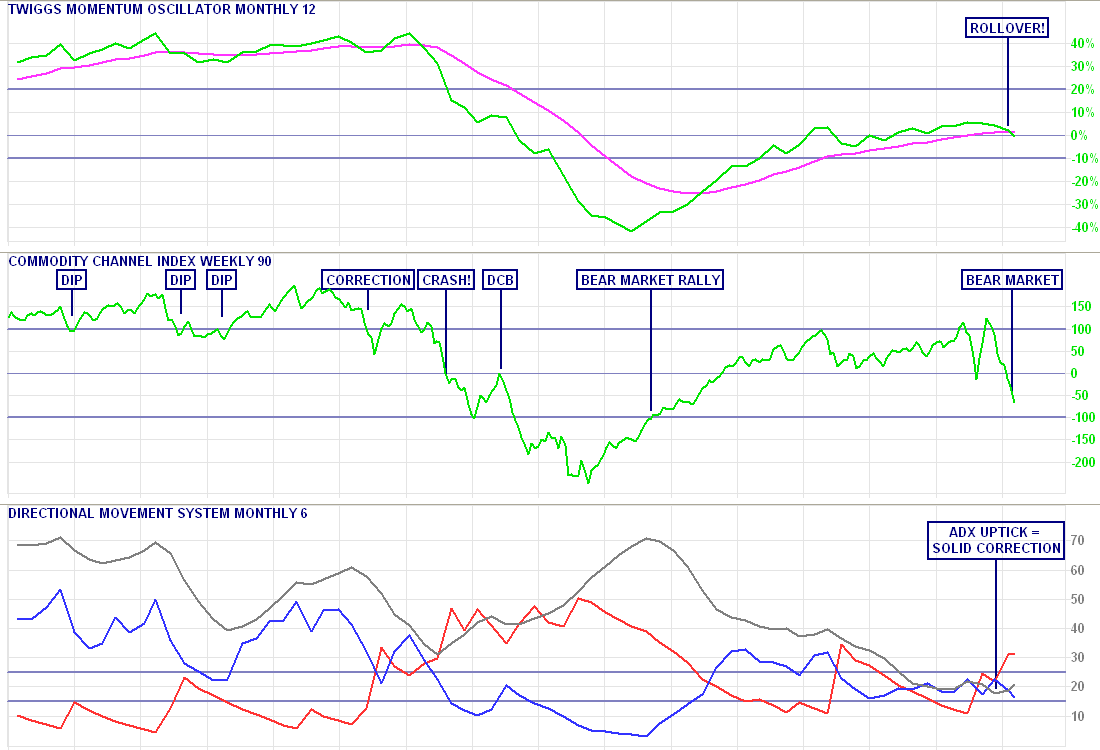
My “System 260” long term trading indicators provide firming confirmation of a continued correction (without external confirmation from the AUD/JPY correlation and US/EU market analysis, which I’ll provide in a separate post).
Long term momentum has rolled over, similar to the 2001-03 bear market, whilst the directional indicator points to a sustained trend.
Next Week
Its the Queen’s birthday on Monday, so the ASX will be closed. The NAB Business Confidence survey will be out on Tuesday, as will the Bank of Japan Monetary Policy Statement – expect ZIRP to continue.
Wednesday sees New Zealand announce quarterly retail sales numbers – this may effect the big four banks slightly, with the Australian MI Inflation expectations survey comes out that comes out shortly after.
On Thursday, monthly new motor vehicle sales will be released – keep an eye on Carsales.com (CRZ) which has had a major sell off recently. Importantly, the EU will announce yearly CPI figures – something the ECB is “vigilant” about tackling. Right…..