
On news of the 4.6 percent decline in crude oil yesterday, in response to the International Energy Agency’s announcing a release of supplies from strategic reserves, and after my look at gold yesterday (which also fell last night) I thought I’d have a closer look at where we stand with commodities.
First, the two major indicies that track a basket of commodity goods. The Rogers International Commodity Index (RJI) and the CRB Index.
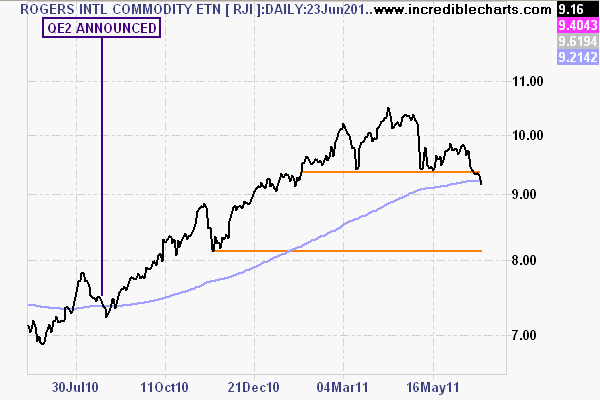
Rogers International Commodity Index
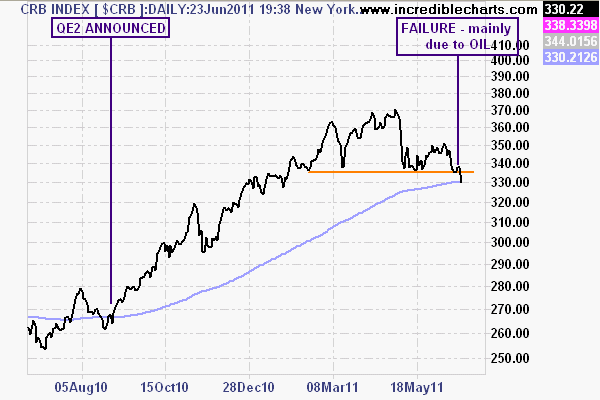
CRB Index
The CRB index has failed its six month support and is on the 200 day moving average (or EMA) (a closely watched line of support). This is replicated by the RJI, with the latest price below the 200 EMA. Note on both charts, I’ve shown where and when the latest round of quantitative easing by the US Federal Reserve (QE2) was announced, in late August 2010. If further stimulus is not forthcoming, it is possible that prices could revert to these levels, or somewhere in between.
A breakdown of the individual commodities shows the following:
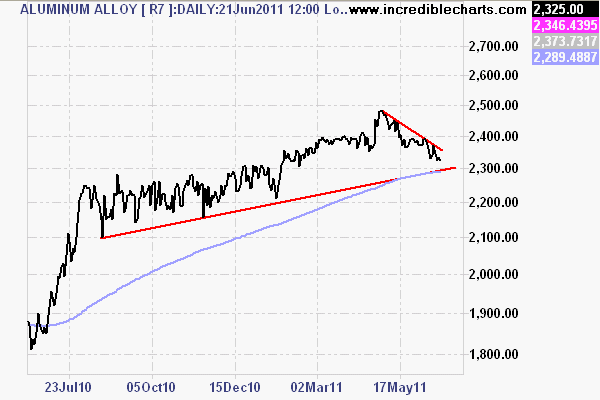
Aluminium is retracing to support at 2300
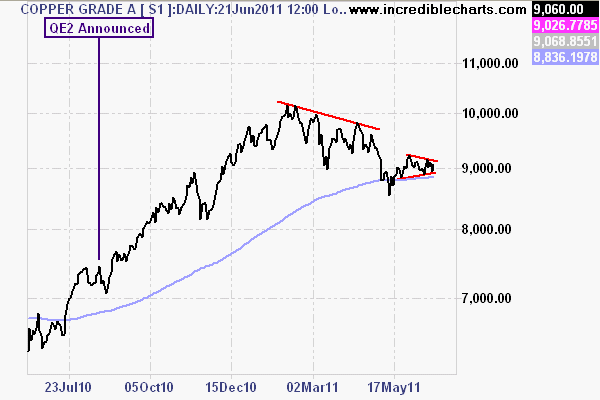
Copper has retraced since early 2011 and is steady at 9000 for now
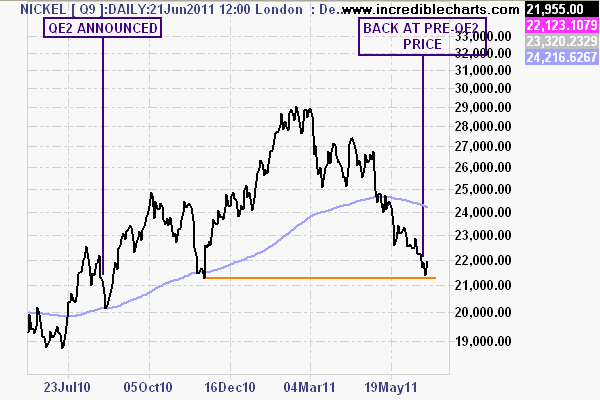
Nickel is back to its pre-QE2 prices
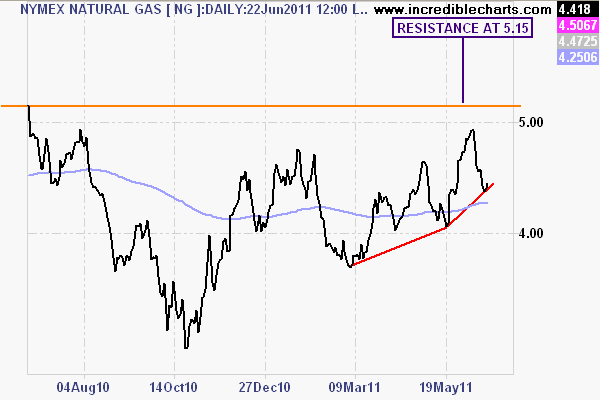
Natural gas futures are actually accelerating with target at 5.15
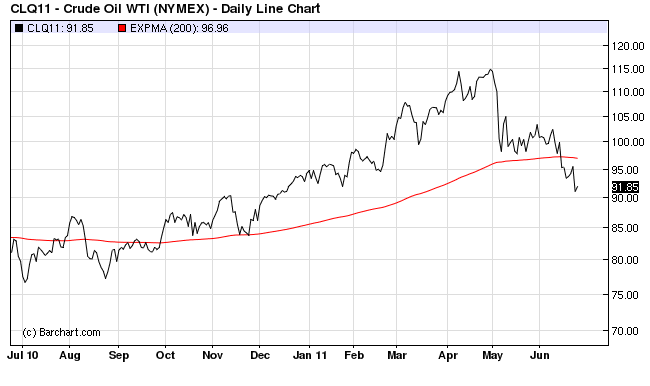
The major reason for the fall - WTI crude
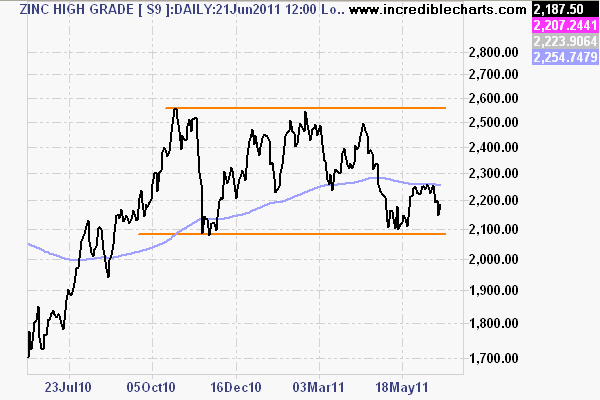
Zinc has been in a trading range all year but is starting to falter....
Finally, a quick recap of gold and silver (in USD). Gold sufferred a large fall last night, over 2%, but is up slightly this morning in Asian trade. Where are the precious metals going? Marc Faber has called for a 3 month correction in gold and silver prices, and has told his subscribers to use the opportunity to accumulate, before the “money printer Bernanke” starts the presses again for QE3.
A Fibonacci retracement and the 200 EMA show prices could fall to $1400 (over 8%) without threatening the bull run in the shiny metal. Note too that a similar fall in gold post the May 2010 Greek flashcrash was a great opportunity to buy before QE2. Will history repeat?
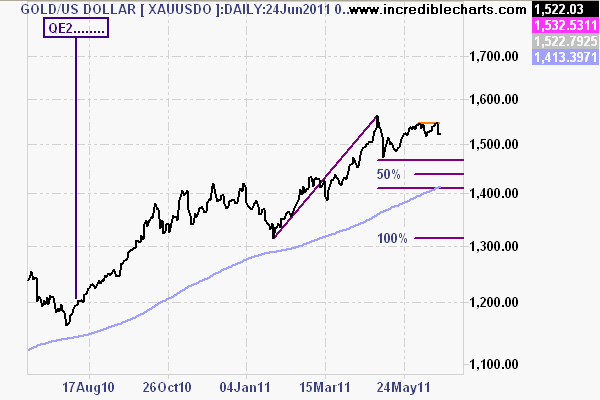
Gold could fall to $1400 USD an ounce on a typical retracement without jeopardising its megabull market.
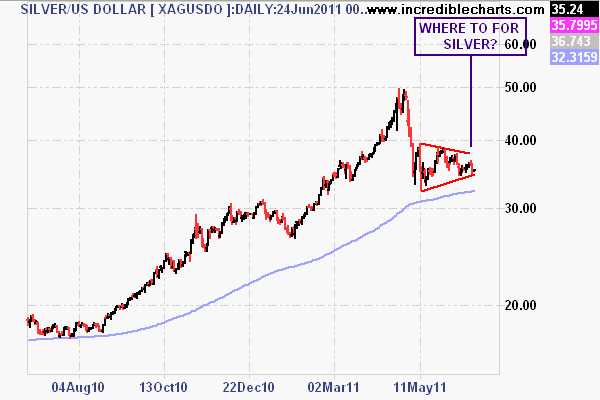
After a massive correction, silver is consolidating in a symmetrical triangle pattern.
Disclosure: The author is full time trader and may hold long or short positions in some or all of the securities mentioned in this article. The article is not to be taken as investment advice and the views expressed are opinions only. Readers should seek advice from someone who claims to be qualified before considering allocating capital in any investment.