
Spot gold in USD broke a recent high last night, after comments by the Fed chief Ben Bernanke, that milky-wilkies (QE3) are off the table, but will continue its zero interest rate policy (ZIRP) due to the slowing US economy.
Gold jumped to $1559.50, before being sold off (which has regularly occurred whenever an intraday high of $1550 has been breached) to settle at $1549 at the close of metals trading.
3 day chart of gold - green line is most recent trading day
Although almost always reported in USD, gold jumped to a new record high in Pound Sterling (GBP), closing at 964.20 an ounce.
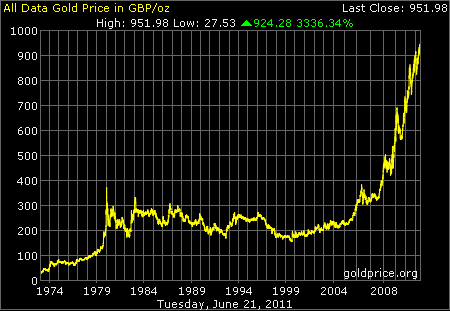
Gold in GBP per ounce - from www.goldprice.org
Similarly, gold in EUR has also hit a record high, closing at 1080.40 per ounce.
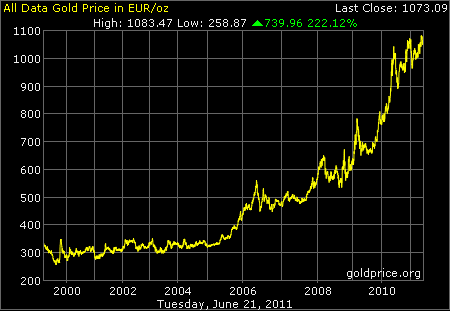
Gold in EUR - from www.goldprice.org
But back to gold in USD – where is it heading?
I’m going to lean on the shoulders of a very successful classical chart trader, Peter L.Brandt, who has recently taking up blogging and who recently published his book on trading – “Diary of a Professional Commodity Trader“. I’ll be publishing a review of this book soon (probably next weekend).
Here is his short term take on the gold price:
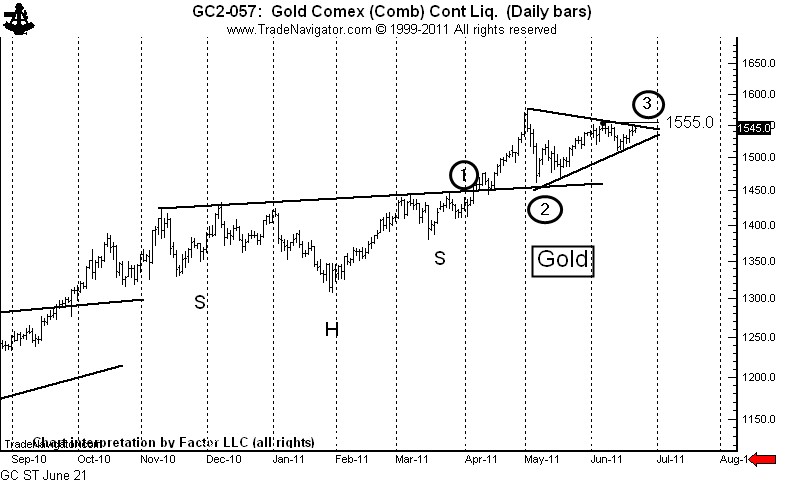
Symmetrical triangle should launch the next $100 move
As often is the case with classical charting principles, well developed chart patterns can provide either a buy or sell signal. In fact, a chartist has to critically question any chart pattern that does not offer either option. Such is the present case with the daily continuation Gold futures chart ($GC_F).daily bar chart of gold, as marked by Peter L.Brandt
Three major chart events can be seen on this chart.
- The April 5 completion of a 5-month continuation inverted H&S pattern. This pattern had a target of 1584 — the high on May 2 of 1577 was close enough to count as achieving the target.
- The May 5 and May 17 retests of the neckline of the previously completed H&S pattern.
- The ongoing development of an 8-week symmetrical triangle.
This symmetrical triangle could go either way. A close above 1555 would complete this triangle as a continuation pattern and establish a target of 1650.
The problem of course is that gold (in pretty much every currency) has been rising inexorably year-on-year for over 10 years, so trying to time an entry for going long (or longer) seems fruitless. Just buy buy buy – right?
My monthly chart system shows the current position of the gold price against its historic bull market. The chart below shows monthly candlesticks (a blue candle indicates the price closed higher in the month, the red candle shows the price closed lower – the “wicks” provide the extreme highs and lows) with a linear regression channel going back six years, encompassing the terrible volatility of the GFC (where gold dropped from almost $1000 per ounce to just over $700).
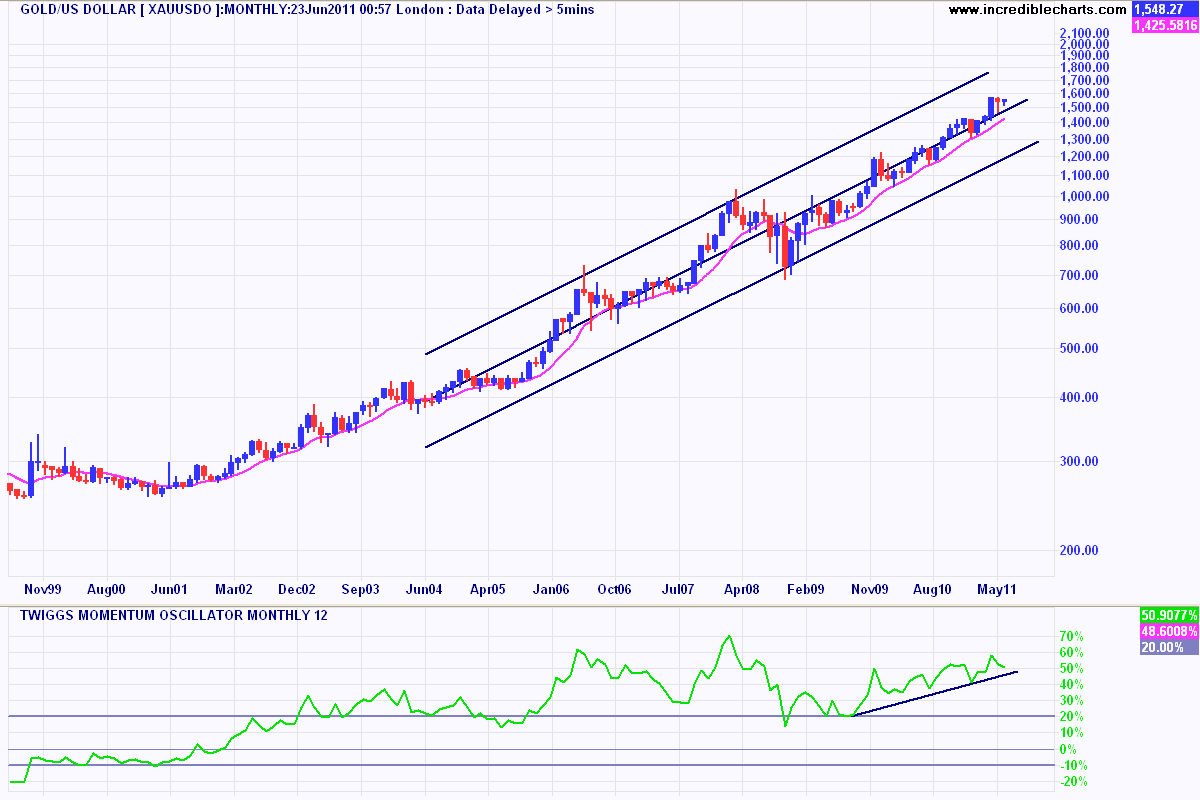
click to enlarge
I’ve also included a momentum indicator (Colin Twiggs TMO) where a positive reading obviously means the rate of change of prices is rising, but a reading above 20% and climbing is a secular bull market.
The $64,000 per ounce question is, even if price action and charts are pointing, in the short, medium and long term to higher prices, how do we know if this will continue to the next year and thereafter? Given, that adjusted for inflation, the gold price needs to rise to over $2200 per ounce USD before reaching its previous high, I would suggest two things to watch: first, a break of the lower trend channel line on the chart above (a fall below approx. $1300 before the end of the year) and secondly, if prices breakout and go exponential.
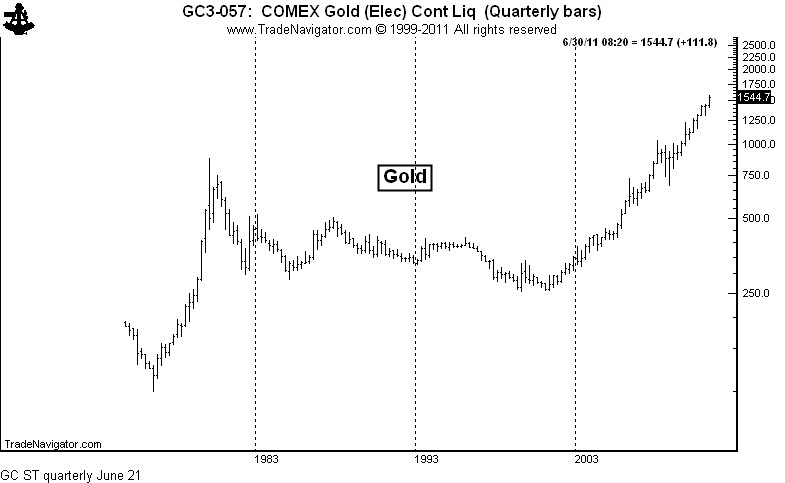
Quarterly chart of gold since it was floated in 1975
Note the classic run up in prices – a true bubble – in the late 1970’s. A break above the upper trend channel in my chart above does not bode well for the relatively smooth price action in gold that is contended by all (except perhaps Michael Pascoe) that gold will inexorably rise.
Disclosure: The author is full time trader and may hold long or short positions in some or all of the securities mentioned in this article. The article is not to be taken as investment advice and the views expressed are opinions only. Readers should seek advice from someone who claims to be qualified before considering allocating capital in any investment.