
Summary
The S&P/ASX200 index eventually closed 0.4 per cent lower to 4,626.8 points today, after a wild rollercoaster ride. The index is down 200 points or 4.14% for the month and 2.4% since the start of the year. In effect, the XJO has gone nowhere since September 2009, rangebound between 4200 and 5000 points.
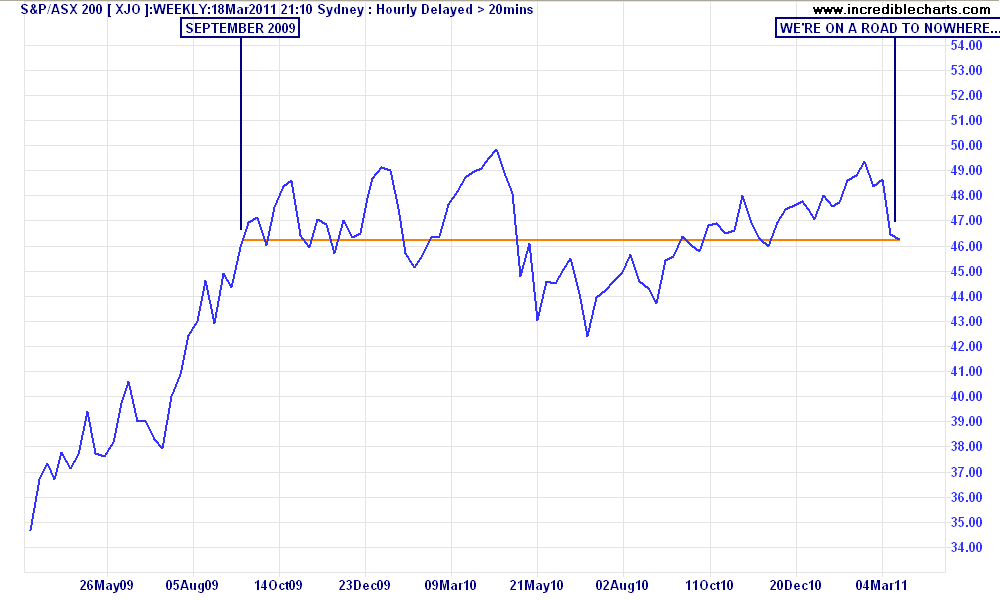
ASX200 going sideways since September 2009
In this week’s analysis I will look at the index (Code: XJO) using my Monthly, Weekly and Daily chart systems to give an indication of where we are and where we are likely to go from here.
Monthly
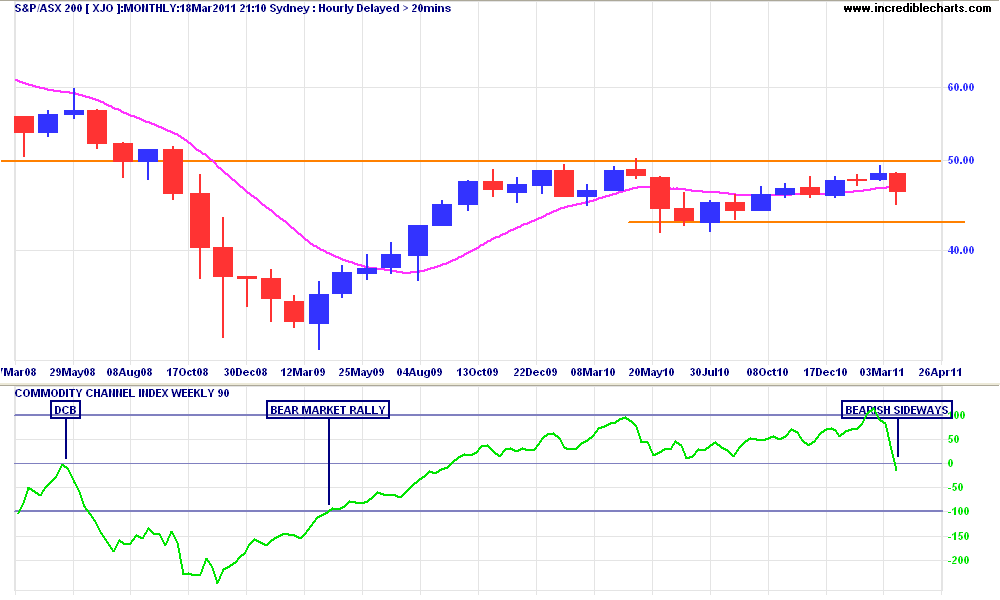
I start using my Monthly chart system, using a 260 day weighted moving average and 90 week Commodity Channel Index indicator. I went over how I use this system last week.
The sideways motion of the ASX200 is clearly evident in the chart below, rangebound between 4200 and 5000 points. This has implications for longer term traders (or hedgers, particularly within SMSF).
With CCI crossing over the 0 line, and the monthly price below the 260 day WMA the index is now in a bearish sideways pattern.
Adding a long term momentum oscillator (I prefer Colin Twiggs TMO) to complete the analysis, it is clearly evident that the market is still in a sideways pattern, with a somewhat bearish bias. Note in the chart below (only covers 12 months) that the TMO is retracing to the 0 line, reflecting the large correction of last week. A reading above 0% or a crossover above the 12 month EMA is required for a bear market rally, and above 10% for a bull market.
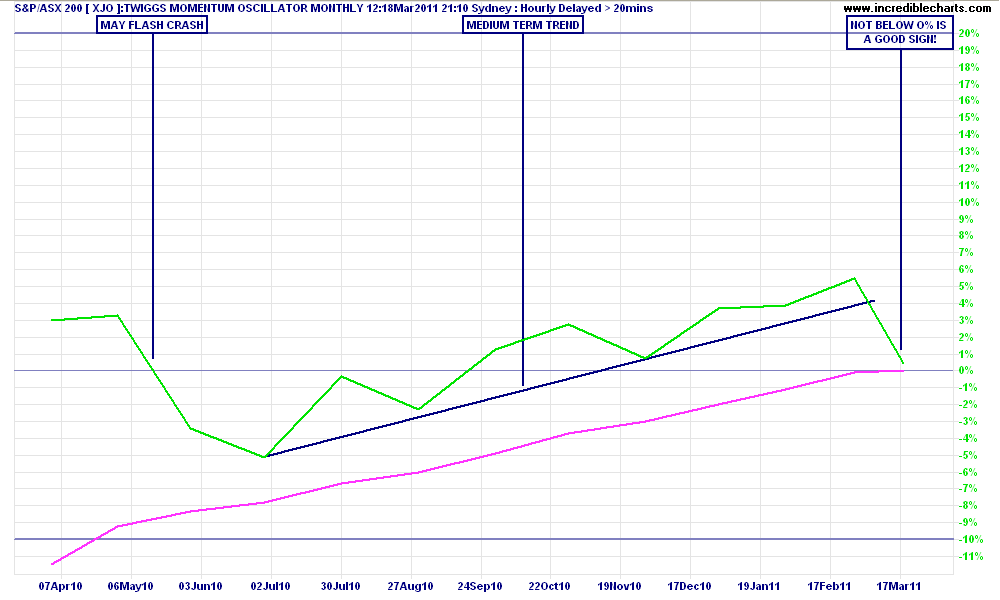
Conclusion: Mildly bearish in the medium-long term, with possible falls to 4300 points not ruled out at this stage. Still not good conditions for index/buy-and-hope investors.
Weekly
Scaling down to weekly charts, let’s look at the weekly price with a 63 day CCI.
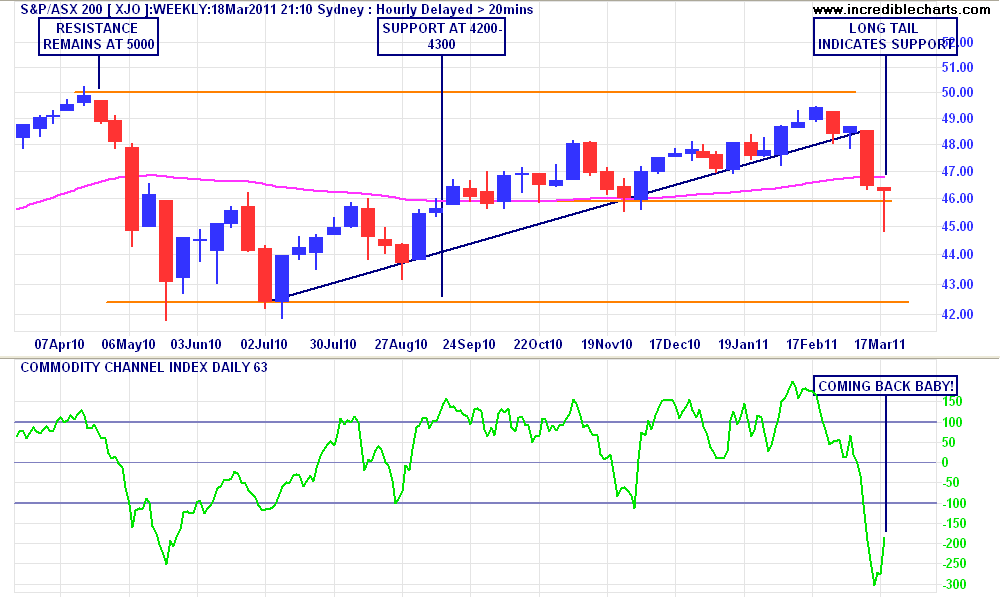
A strong bullish signal – after a correction or dip – is when the CCI crosses over the -100 line from below. As a cyclical indicator, this makes sense and is a great entry point for bottom-pickers. At the moment, this hasn’t happened, although the very long tail on last week’s candle indicates a lot of support (in plain English, a lot of buyers stepped in as the index went to 4500 and bid it back up to over 4600).
I’m still concerned that this week’s price action is a “Dead Cat Bounce” so I would wait for confirmation of the CCI crossover, and for the 13 week TMO to get back above the 0% line (and preferably its own EMA).
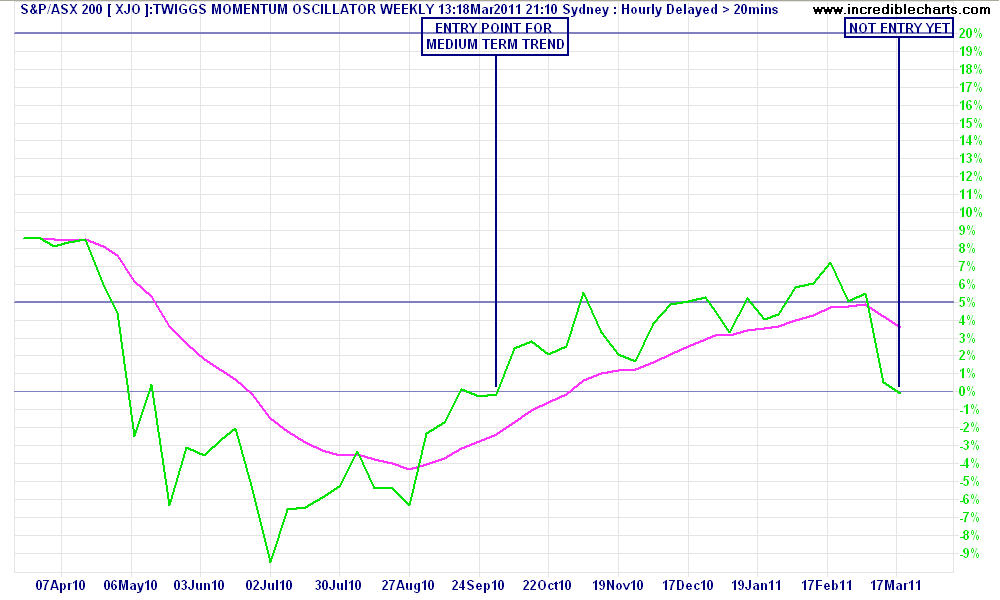
Conclusion: weekly price action looks like a Dead Cat Bounce or a bottom forming with possible long entry point. More confirmation required before delineating between the two price actions.
Daily
Finally, lets look at the daily charts. The dip of late February turned into a correction on March 9 when the medium term trendline broke at approx. 4800 points (notice the cluster of sideways price action around that point). The subsequent rout seemed to have found a bottom on Monday (March 14) but was hammered the following day.
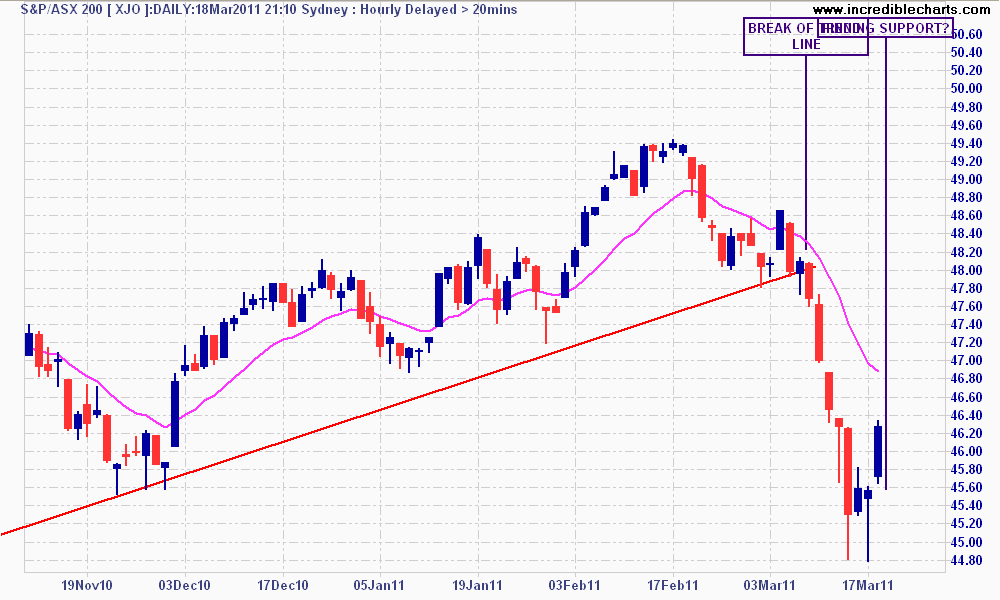
Fantastic market for day traders – note the long tails and shadows on the daily candles indicating wildly ranging conditions. I confess I dipped my toe here and did some quick trades, but I am still standing aside with the majority of my capital.
The last scaled chart is the 20 day CCI: note the bullish crossover of the -100 level, indicating some monkey-bottom picking in the last couple of days.
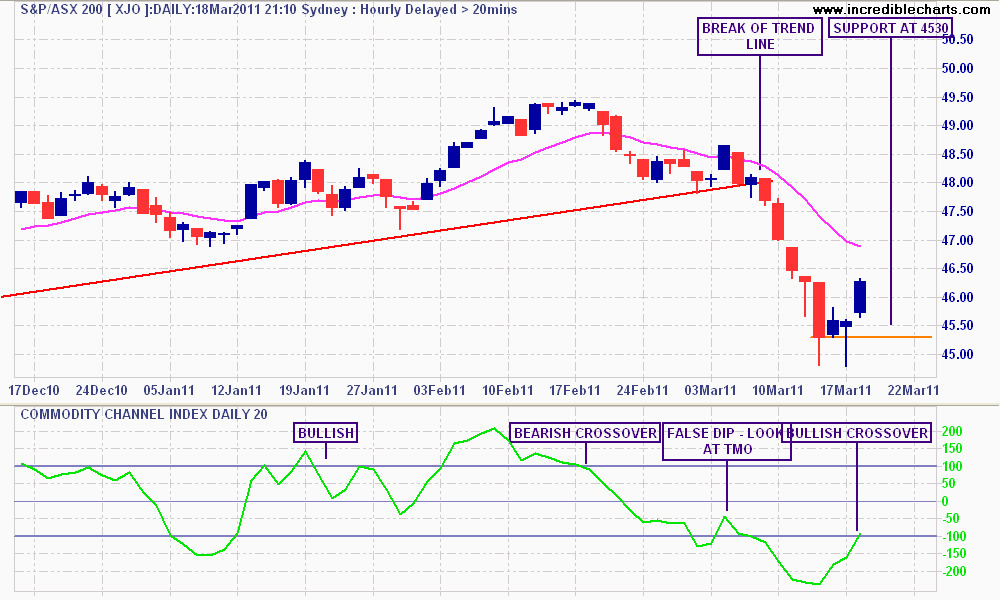
There was a false signal here in the early March dip before the break of the trendline. This is actually a good signal because it highlights the folly of relying upon a single dataset without backing it up: in this case, a scan of the short term TMO (and Directional Movement System) would reveal the feint.
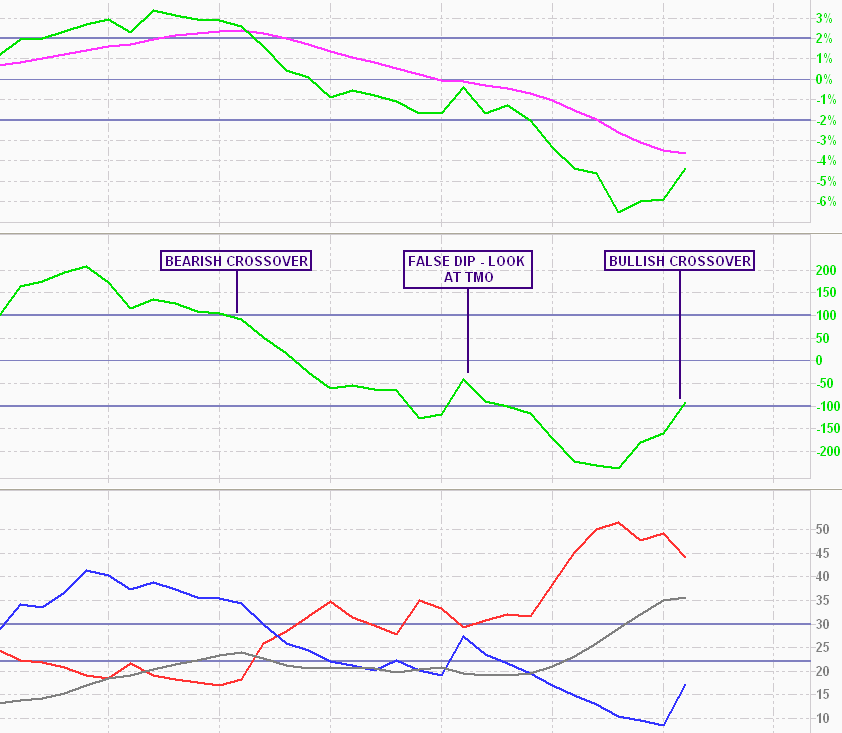
My 3 short term indicators
Conclusion: It does appear a bottom is forming, with an early indication by the CCI. However, this has not been confirmed by the momentum or directional reading. There is strong local support at 4530 points.
Overall Conclusion
The long term trend for the ASX200 (XJO) is still bearish sideways. Within this trend, the recent medium term trend has broken after a major correction. A price bottom may be forming at approx. 4530 points but medium term indicators and price action is ambiguous.
In the short term, price action has all the hallmarks of a post-correction bottom forming, with a probable rally in the week ahead. Daily price closing above 4650-4670 points and confirmed by short term momentum and direction indicators would confirm a short-term rally. However, caution must be taken if price closes below 4530, as the next support is way, way below at 4300 points.
Disclosure: As always, I have positions (long and short) in some of the securities mentioned above. Do your own research and consult an adviser before allocating capital.