
Summary
The S&P/ASX200 index closed 1.16 per cent lower to 4,644.8 points today, finishing a bad week for local stocks (if you are a buy and hoper). The index is down 3.94% for the week and just over 6% since the highs in February.
Asinine commentary aside, justifiable fears are weighing on global markets, particularly the end of the magic carpet that is QE2 which has risen everything since August of last year, but also the continued Arabian “revolution” and at time of writing, a large earthquake off Japan, which has hit overnight markets strongly (SPI futures down 52 points, AUD/USD below parity, Nikkei 225 down 2.8%)
Crash, Correction or Dip?
The question is always asked in these severe market moves: is this just a dip in a medium term rally? A correction within a secular bull market? Or something more sinister? GFC Episode 2? (Actually Episode 4 – the Bears Strike Back – if you count the NASDAQ bubble and bust as Episodes 1 and 2 – or the Tech Menace and the Attack of the Central Bankers).
Let’s put some calm rational analysis into all of this and look clearly into the past to wade through the fog of the future.
Dips and Rallies
Dips occur within rallies. A rally can be a week, a month or even a year long. A rally usually occurs within a bull market, where each year ends higher than the last (e.g the 2004-07 Australian bull market), or even a secular bear market, where each year ends lower than the last (e.g the 1990-2005 Japanese bear market).
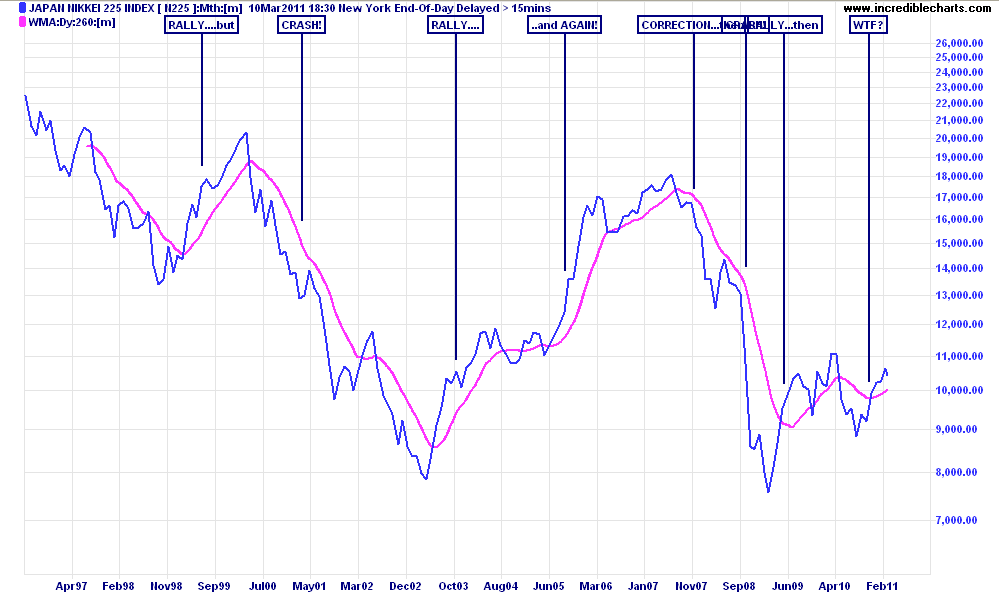
Nikkei 225 - selling dips since 1990
Within these rallies, small downtrends occur called dips. Buy the (f%%king) dip has been the catchcry since August last year, and for good reason.
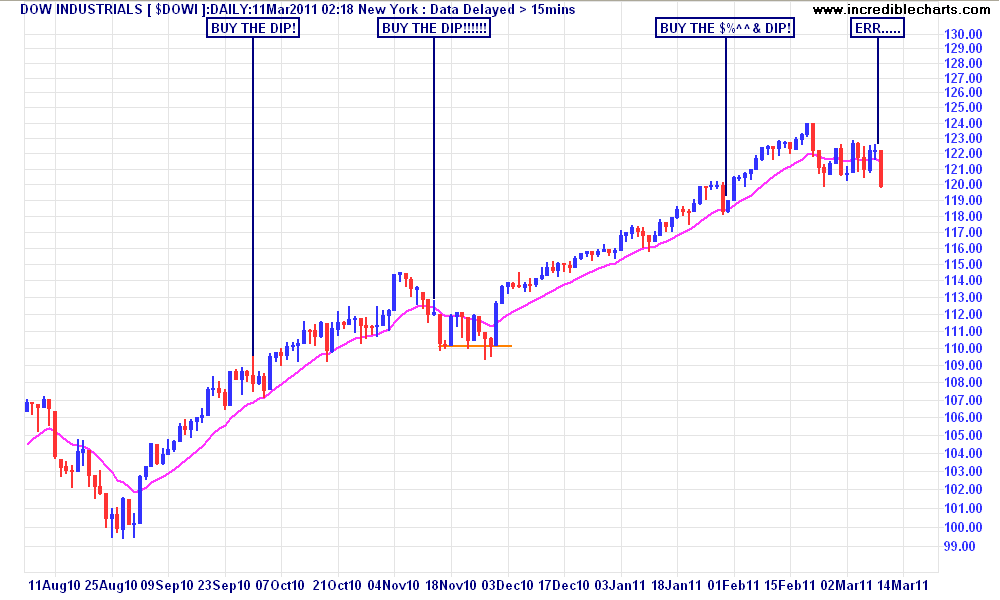
Buy the Dip!
A dip occurs because shorter term position traders need to make profits and having watched on the sidelines as the day traders continually swap positions with the “Mums and Dads”, step up in force and sell all or part of their profits. Since many position traders – including hedge funds and the big “fundies” use technical analysis and price targets as part of their business plans, and because everyone is looking at the same screen, the trade becomes crowded and everyone wants out.
Dip vs Correction
What makes the dip different to a correction is where everyone still thinks the medium term rally is intact. So the position traders – seeing a lower entry price – will re-enter, having bought that stock off miffed “Mum’s and Dad’s” – a new trend eventuates, and others look at the price as a confirmation of their own bias, and bid up the stock, thus self-fulfilling the trend.
In a correction – defined as a 10-20% drop in the index – the position traders sell and then sell short, adding to the pressure and torque that moves markets. A correction usually occurs when a rally has run out of steam, either defined by a top in prices (sometimes a double or triple top), a “head and shoulders” pattern, or just a run off a cliff (the so-called flash-crash).
Corrections vs Crashes
Corrections are a normal part of market operations, within bear or bull markets. Contrary to the theorists, markets are not efficient and become exuberant on the upside and despair on the downside. They provide excellent entry points for investors who can buy low. A few “Very Good” companies have provided these opportunities recently.
A Violent History
History shows that within a bull market, corrections are likely to occur. For example, in the post-1987 crash, the market corrected 3 times before attaining the pre-October 1987 highs (it took over six years btw). The post-1990 recession rally corrected over 4 times in 7 years, with many “dips” along the way, before the pre-9/11 tech bubble crash wiped out almost 5 years of gains. This would equate to a frequency of 1 correction every year or so.
Unfortunately, the collective memory is the super 2004-07 rally, where only one correction occurred amongst many very small dips. The July 2007 move from 6410 to 5480 points was a precursor of what was to come – and the rah-rah crowd at the time not only saw it as a great time to invest, but proof that volatility had been tamed and everything was fine.
Indicators
So how can you tell the difference between a dip, a correction or a crash? Easy – wait a few years and draw a line on the chart.
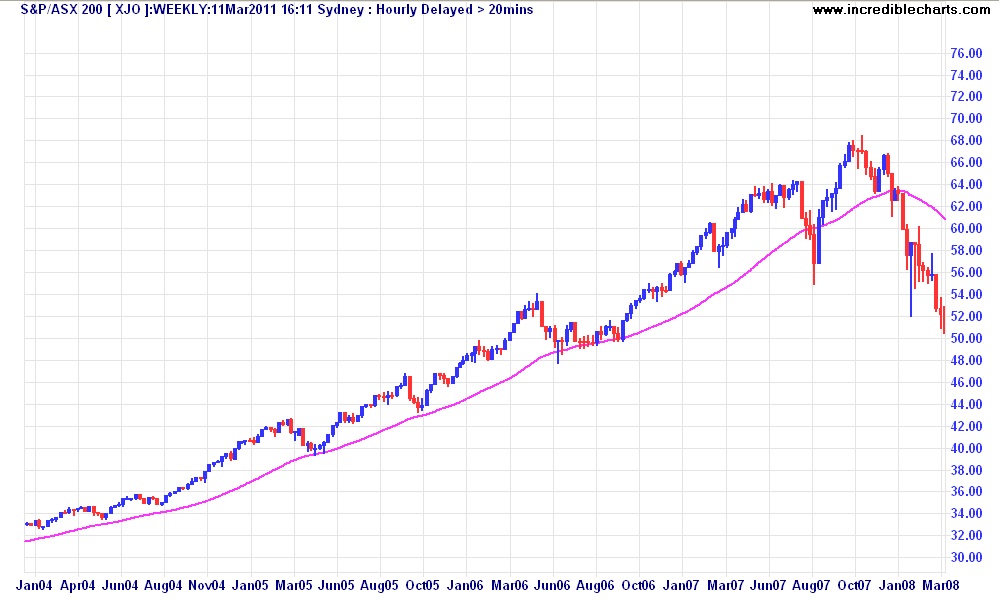
For the rest of us, there are some tools to use that can provide an indication of trouble. My main one is the 260 day exponential moving average (260EMA). Note in the weekly chart below, showing how price action respected the 260EMA line, never closing below it until August 2007.
The Super Rally
Interestingly, on the monthly chart, it is still respected until the crash itself- here is my other use of the 260EMA. It is a great directional indicator of what type of market is underway. A bear market is defined when the 260EMA is declining and the monthly price closes below it. A bull market is the opposite.
Swings and Roundabouts – the CCI
Used in conjunction with a cyclical indicator – the 90 week Commodity Channel Index – I can confirm my “stance”, particularly for sideways markets (which happen more often than you think). A reading above the 100 line, combined with monthly closes above the 260EMA indicates a bull market. A reading above 50 is usually bullish sideways – a consolidation period.
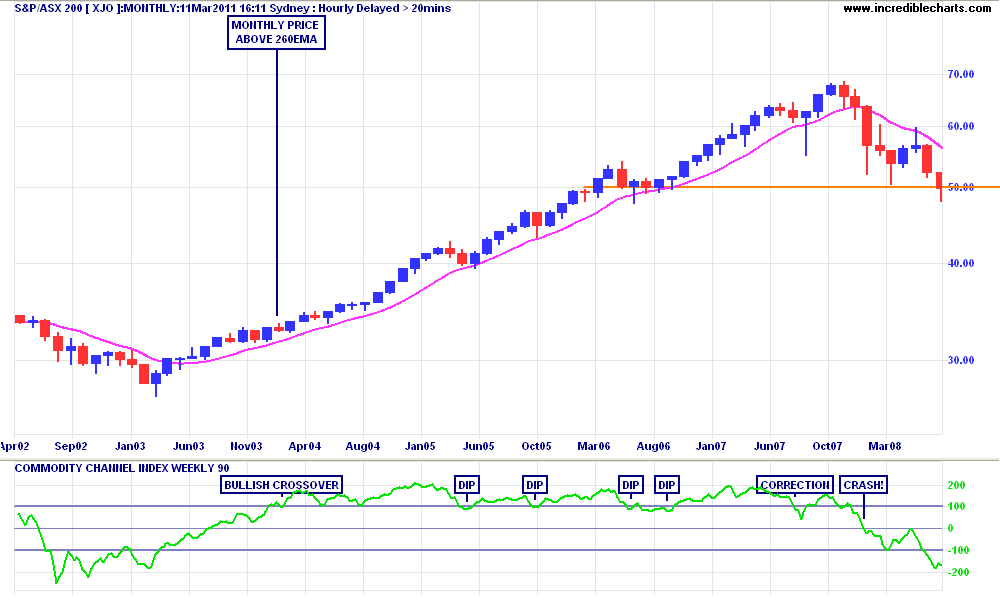
A crossover from above 100 to below, with a monthly or weekly close below the 260EMA is a very strong sign that the bull market is over. Conversely, a crossover from below -100 to above, with a monthly or weekly close above the 260EMA indicates a bear market rally (but not a new bull market) is underway.
Add a third long term momentum indicator provides me with a small toolbox of technical tools to establish my overall market stance, before I go about trying to trade the dips, corrections, trends and rallies.
Where are we now?
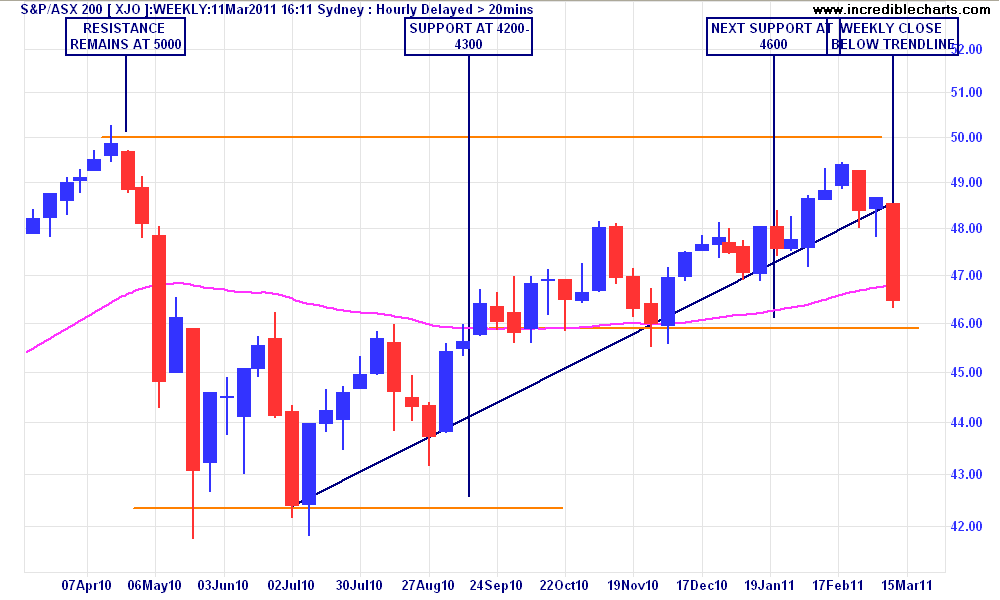
The ASX200 has tried to start a new bull market rally, and briefly crossed above the 100 level line on the CCI, with 5 months of price action above the 260EMA, which was also rising. All good technical indicators. However, the failure to breach the resistance level at 5000 points reinforces my view that we are only witnessing a bear market rally.
This is not yet an index investor’s market – I would caution anyone with lazy index funds (or lazy managers) in this environment. The more “enterprising” will find some solid bargains when during a flight to safety, the peripheral holdings (i.e outside the ASX50) are usually dumped en masse.
Because the ASX200 closed the week below its July/August 2010 to March 2011 medium term trendline and the 260 day EMA the conditions are ripe for a correction, with a possible crash if confidence disappears. There is considerable support at the 4600 level, but if that is breached, the next level is a far-far away 4200-4300 points.
Where to from here?
Disclosure: As always, I have positions (long and short) in some of the securities mentioned above. Do your own research and consult an adviser before allocating capital.