
The great renewable energy contradiction
The federal government and renewable energy advocates continually argue that renewables are the cheapest energy source.
The latest Intergenerational Report, released last month, even claimed that the average Australian household will save 40% on energy costs between 2030 and 2050 because of the renewable energy revolution.
Yet, when you scratch beneath the surface of this claim, it becomes instantly apparent that it is a myth.
Yes, renewable energy is cheap to generate because the fuel source is free. But it is very expensive to integrate because it requires massive amounts of transmission, storage, and backup to deliver energy when and where it is needed.
South Australia is a prime example. It is mainland Australia’s renewables leader, generating more than three-quarters of its grid power from wind and solar over the past 12 months:
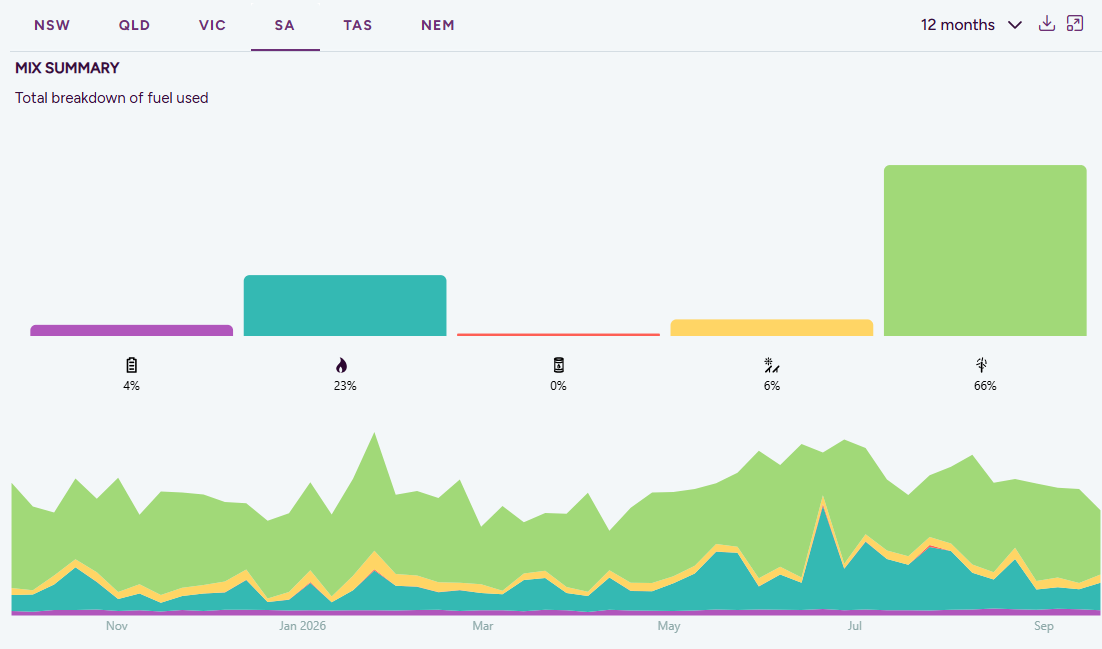
SA Power Mix – Past 12 Months
South Australia also regularly relies on imports of Victorian coal power when wind and solar are inadequate, and gas can’t fully fill the gap.
If renewables were the cheapest source of power, then logically, South Australia should have the lowest-cost energy in the nation.
Yet, South Australia has once again been ranked the least affordable state for household energy:
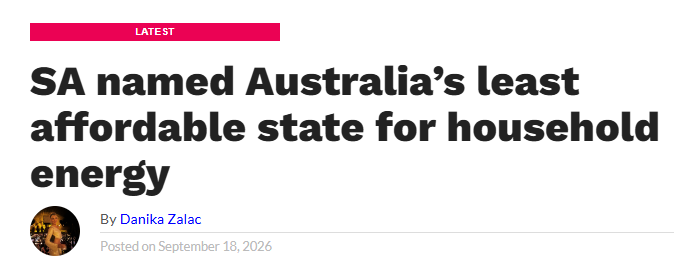
From the article:
South Australians are paying the highest average household energy bills in the country, with new research estimating costs at more than $192 a month.
The findings come from comparison service iSelect’s new Energy Affordability Index, which compares household energy costs with median earnings and capital city Consumer Price Index figures to examine how energy affordability differs across Australia.
South Australia finished at the bottom of the index, with average monthly energy costs of $192.08, almost $75 more each month than Victoria, which recorded the country’s lowest figure at $117.09. Over a year, that difference adds up to almost $900.
South Australians were also estimated to spend the highest proportion of their monthly earnings on energy, at 3.41%.
South Australia has consistently been ranked as having Australia’s most expensive household energy costs. For example, a 2024 report from Energyse noted the following:
“South Australia has the highest electricity rates on the NEM, at over 40 c/kWh for single use rate plans. This is 49% higher than the average of the rest of the NEM”.
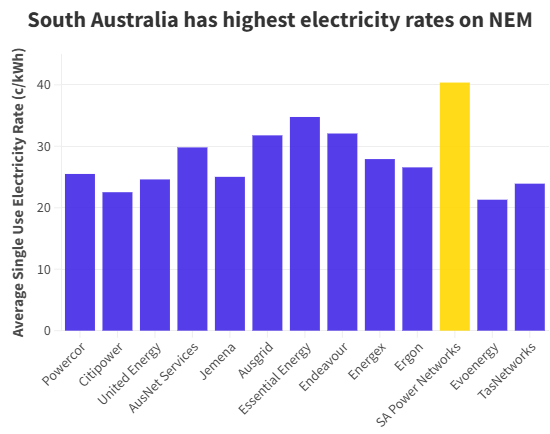
Source: Energyse
“Adelaide is the capital city with the most expensive electricity, with electricity costing 47.1 c/kWh for a typical two person household once daily usage charges are factored in”.
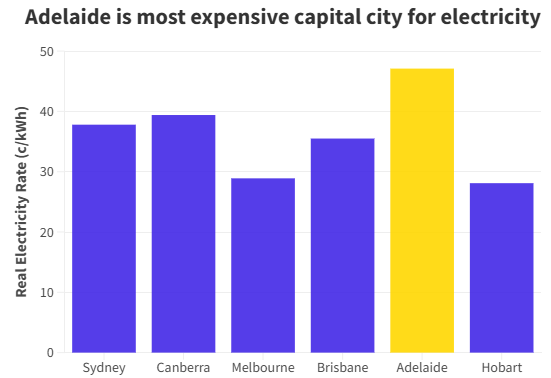
Source: Energyse
The following data from Canstar also showed that South Australia’s average electricity price per kWh (which doesn’t include daily connection charges) was the highest in the nation at the beginning of this year:
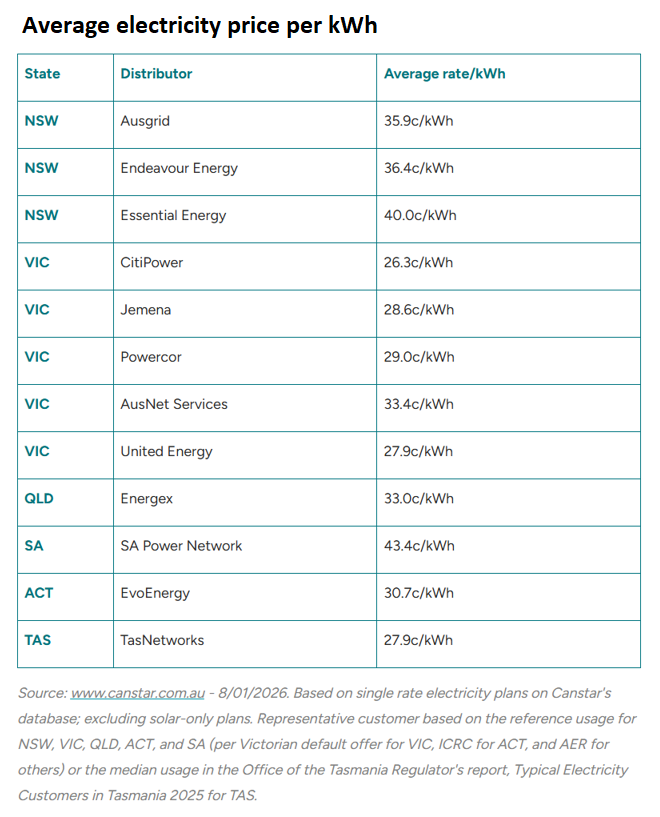
Energy analyst Danny Price recently warned that South Australia’s electricity system is less reliable than it was a decade ago, when coal power was still in operation.
Price told The ABC that renewables need the “big buffer” of thermal generation to ensure reliability.
“The system is more fragile than it was back 10 years ago. Far more fragile”, he warned. “We are more dependent on intermittent sources of generation”.
“There’s a lot more batteries out on the market but, as we know, they don’t last very long and they cost a hell of a lot of money”, he said.
South Australia isn’t an isolated example. California leads the USA in solar and wind power. Yet, it also has the highest electricity rates in the continental USA (i.e., excluding Hawaii).
Lessons for policymakers:
Just because renewable power is cheap to generate (because the fuel source is free), it doesn’t make it cheaper for households.
The giant wall of transmission capex is the area of the energy transition experiencing the biggest cost overruns, and it will land squarely on retail power bills through network costs once completed.
Specific examples of the cost overruns include:
- VNI West’s cost has risen from $3.6 billion to $7.0-$7.6 billion.
- The HumeLink has risen from an early estimate of $3.3–3.5 billion to $4.9–5.5 billion.
- The Marinus Link has risen from an original cost estimate of $3.0 billion to the current cost estimate of $4.8 billion.
- The Western Renewables Link was originally costed at about $370 million, and current estimates place it at over $3 billion.
- The Central‑West Orana Renewable Energy Zone’s cost has blown out from an original $675 million estimate in 2020 to an expected $7-$8 billion.
Then there is the huge amount of taxpayer funding going towards Snowy Hydro 2.0, home batteries, the Capacity Investment Scheme, and other renewable schemes that must be taken into account.
The costs are mounting, but transparency remains highly opaque.
Energy users and taxpayers deserve better. We need to know the total costs of the energy transition. Then we can decide whether the costs are worth it.
