
Deutsche with a nice base case that matches my own view. Those thinking that Australia will avoid this are happy clappies, in my view. We have the worst household shock in living memory bearing down upon the economy. At best, it will be hidden from households via the malign per capita effects of mass immigration but in real terms will be as bad as anywhere.
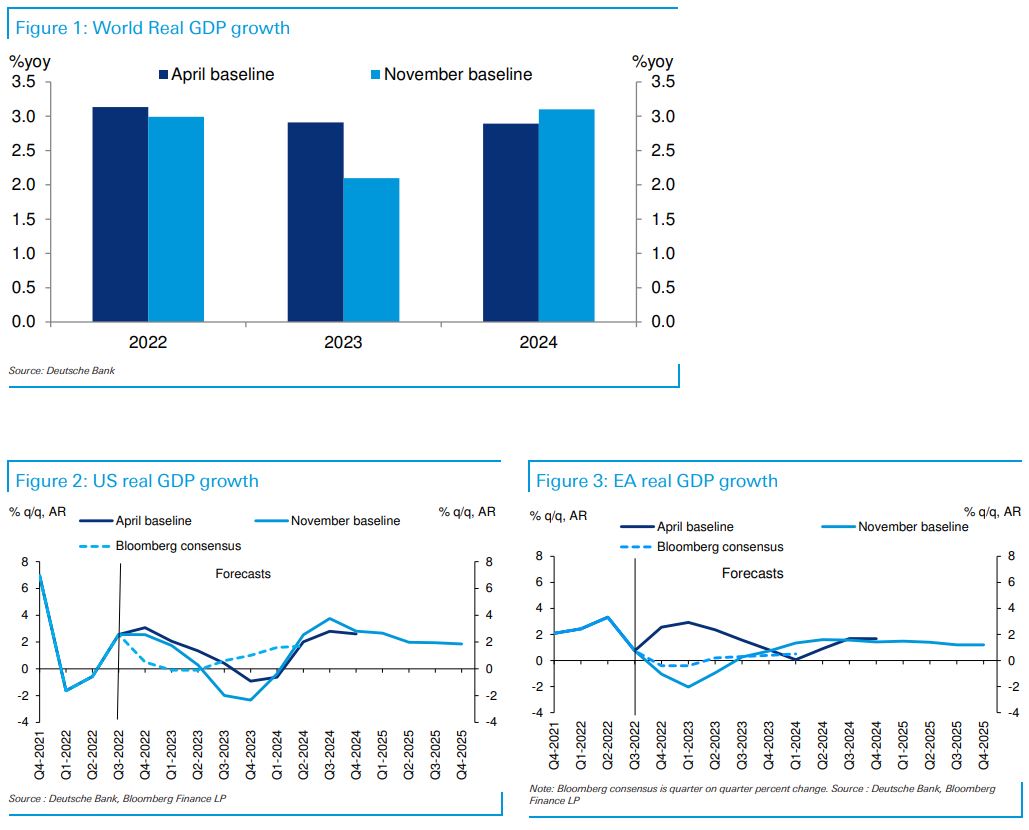
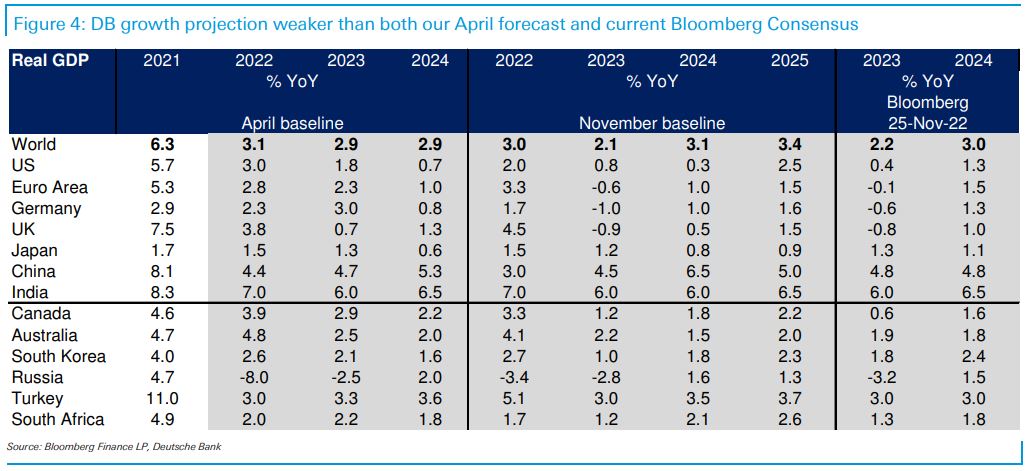
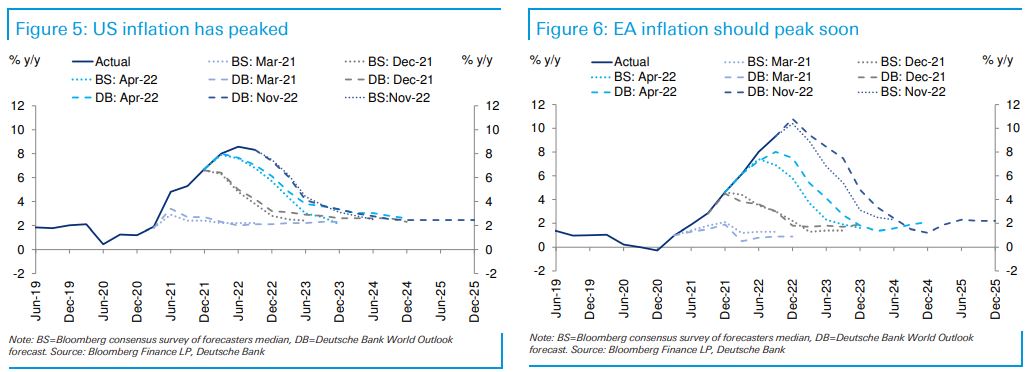
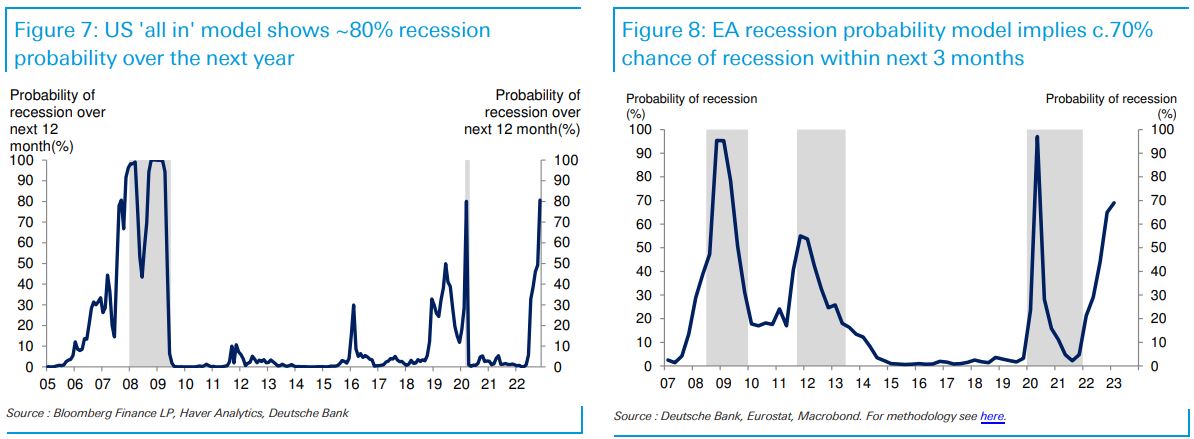
The coming recession. Our World Outlook in April highlighted the high probability of a recession in the US and the growing risk of one in Europe in 2023. Developments over the intervening months have strengthened this view. Indeed, we now see the US downturn beginning around midyear, while a recession in Europe may already be underway. As a result, we project world growth to slow to just above 2% next year, a rate of expansion that has traditionally been associated with global recession. This forecast remains below consensus although the forecasting community has been moving toward our view in recent months. While the Bloomberg consensus has now built very mild US and EA downturns into the first half of 2023, we still see the levels of GDP falling and unemployment rising significantly more than the consensus views in both regions by the end of next year.
Successful disinflation with downside risks to growth. The main factors driving the outlook for recessionary outcomes in 2023 are aggressive central bank tightening needed to quell inflation from undesirably elevated levels and, in addition and more importantly for the euro area, the energy shock caused by the cutoff of gas from Russia. The resulting declines in aggregate demand and increases in unemployment will relieve upward pressure on wages and prices, enough we think to move inflation gradually back to desired levels by the end of 2024. The case for
recession and disinflation in the US and Europe is considered in some detail in Section II below. We are mindful of both the persistence of upside errors in macro inflation forecasts over the past two years and historical evidence that inflation has proven stickier on the way down than the way up. For this reason, we see the risks still weighted toward more severe recessions being needed to get the disinflation job done successfully, and as we discuss in Section II, we assume the Fed and ECB will be up to the task if needed.
Geopolitical and other forces restraining growth. As we look beyond 2023 and our baseline view of a relatively mild recession lasting several quarters, we also see a mild recovery, not a strong bounce in growth. This is partly because central banks will be cautious about moving policy back into stimulative territory until the war against inflation has clearly been won. In addition, geopolitical factors that will have been weighing on growth are likely to continue to do so in 2024 and beyond, perhaps more so in Europe and Asia than the US. In Section III we discuss in some detail recent developments and prospects on two geopolitical fronts that will impinge on global economic activity. The first is the Russia-Ukraine war, which seems destined to evolve into a frozen conflict, with risks for both less favorable and more favorable outcomes. Our assumption of a slow EA recovery after the winter 2022 recession is in part due to a lingering energy-based competitiveness shock. The second is the US-China’s strategic competition – their struggle for technological and information dominance, in particular – and their efforts to reduce symmetric dependence on each other. Their measures not only add to regulatory and compliance drags on trade, but also point to significant adjustment in supply chain ahead. A third issue we address in Section III is China’s path to ending its zeroCovid policy. In brief, we expect the current substantial drag of growth in China to remain in place until mid-2023, after which considerable pent-up demand should provide a significant boost to growth for the second half of next year.
Financial conditions to tighten on average until the recession is under way. The remainder of this publication presents summary write-ups of our economic forecasts for most of the major countries and regions of the world in Section IV and for key financial and commodity markets in Section V. Equity markets are projected to move higher in the near term, plunge as the US recession hits and then recover fairly quickly. We see the S&P 500 at 4500 in the first half, down more than 25% in Q3, and back to 4500 by year end 2023. The 10-year Treasury yield is projected to remain in its recent range in the months to come, and then rally moderately around midyear as the US downturn approaches. The German Bund yield should rise to 2.60% by Q2 before remaining relatively stable in comparison to Treasury yields. Corporate credit spreads should widen significantly through the year, especially around midyear as it become clear the US recession is under way. We expect the dollar to move sideways against the euro and then to weaken significantly as the recession hits and risk premia favoring the dollar begin to diminish. Supply constraints will keep oil prices elevated in the neighborhood of $100/bl until demand softens with the US downturn; then see these prices declining $20/bl by year end. The current mix of aggressive central bank rate hiking to deal with elevated inflation, geopolitical uncertainty and elevated commodity prices, and impending recession in the EA and US has been a toxic mix for emerging markets. We see this sector remaining under pressure well into 2023, but then beginning to trend more positive later in the year as inflation begins to recede and central bank policy begins to reverse both domestically and by the Fed.
Recession and the War on Inflation in the US and Europe
Recessions are seldom forecasted until they are fast upon us, and as Chair Powell noted recently, we cannot be certain that one is on the way now. However, rarely has there been this much advance warning in both the US and Europe that recessions are in the offing in the quarters ahead. The drivers of recession on the two sides of the Atlantic have similarities but also differences. Central banks have not previously succeeded in quelling inflation from near double-digit levels without tightening policy enough to induce recessions. However, unlike the US, Europe’s inflation has a more important and more immediate supply-side element. Energy supply constraints mean recession this winter even before the ECB’s monetary tightening takes full effect. Our near-term model for assessing recession probabilities in Europe is running at c.70%. Our year-ahead model for the US is at 80%.
In this section we lay out in some detail why we think these recession probability models have it broadly right, and that recessions are impending in both Europe and the US in the quarters just ahead—if not this winter in Europe then by next winter. We also consider why these recessions could prove to be relatively mild. To do so, we begin by examining the current state of inflation—its level and persistence—in the US and Europe. Next we review what historical experience tells us about how much economic pain has been incurred in central-bank led efforts to disinflate in the past. Third, we consider factors that are likely to render recessions less severe this time around than they have been n the past and lay out our baseline expectations for recession. Next, we review our outlooks for Fed and ECB policy and indicate why central banks will most likely stay the course in the face of mounting—indeed likely fierce—political resistance to their disinflation policies as economic downturns emerge. The section concludes with a bottom line assessment of the outlook for inflation and how successful the central banks are likely to be in achieving their objectives.
US inflation
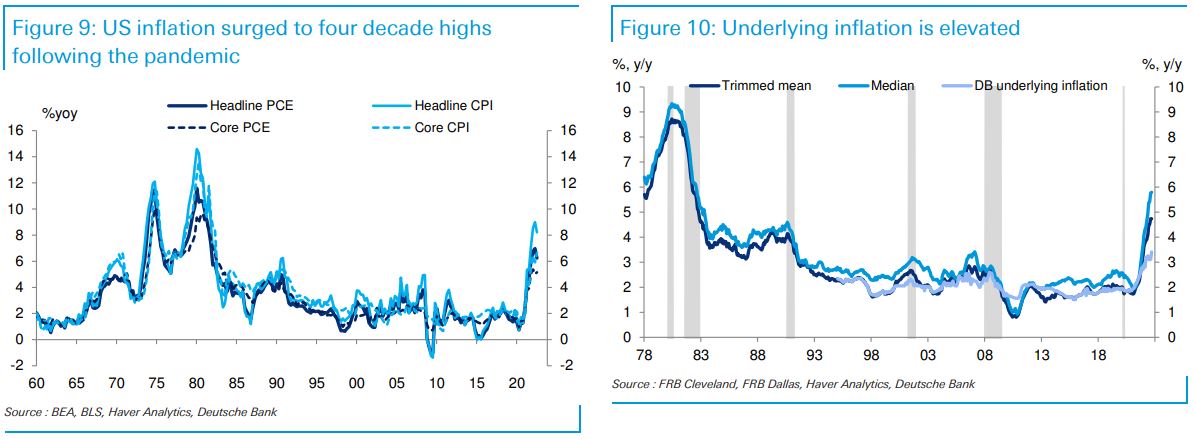
Inflation moved to four-decade highs. Driven by massive imbalances between supply and demand, the pandemic and the policy response to Covid triggered a historical rise in US inflation, which lifted most inflation gauges to four-decade highs. Headline and Core CPI recently hit peaks at 9% and 6.7%, respectively, far higher than the 2-2.5% range that prevailed prior to the pandemic. Inflation according to the Fed’s preferred gauge is nearly as eye-watering, with headline PCE peaking at 7% and core PCE hitting a high of 5.4% earlier this year.
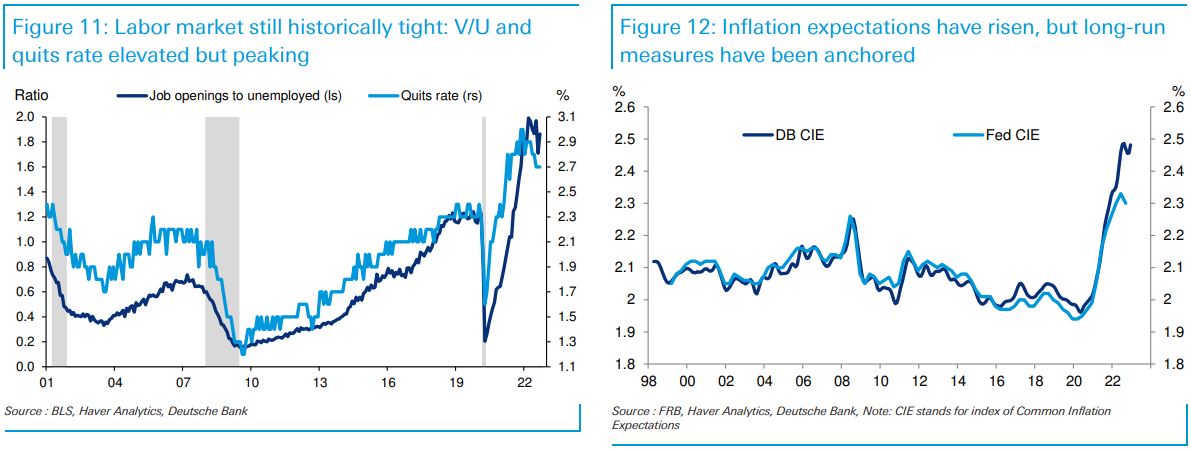
Underlying inflation increasingly demand driven. Sky-high inflation has persisted for longer than initially anticipated, and has evolved over time to become more broad-based as well as more services and demand driven. The trimmed mean and median PCE gauges have recently surged to 4.7% and 5.8%, respectively, while our more comprehensive measure of underlying inflation is now about 1.5 percentage points above the Fed’s objective. Moreover, during the past three months, data from the SF Fed suggests that demand factors have accounted for about threequarters of the rise in the core PCE inflation data relative to before the pandemic. Consumer demand has derived ongoing support from past fiscal stimulus measures.
The labor market has reached historically tight levels across a number of metrics. Job openings exceed the number of unemployed individuals by about 5 million – well in excess of the 1.25 million spread that prevailed before the pandemic – and the quits rate rose to record high levels. Wage growth has accelerated to several decade highs as the labor market tightened aggressively, adding additional push to the price pressures observed earlier in the pandemic.
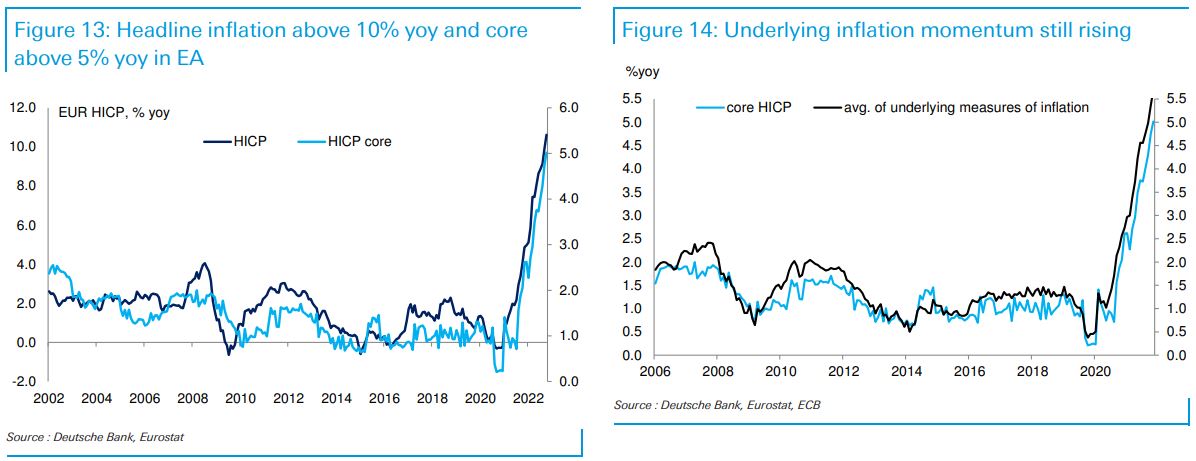
Inflation expectations data have been mixed. After rising in response to the surge in energy and food prices, most measures of long-run inflation expectations have since retreated and appear to be well anchored. Notably, both surveys of professional forecasters and market measures (breakevens and swaps) – show little concern about longer-run (5y5y) inflationary pressures. That said, short-run measures remain elevated and our index of common inflation expectations (CIE) remains near record high levels. As such, the Fed will not take anchored inflation expectations for granted, especially if energy prices experience a renewed rise. Some signs of a turn in US inflation beginning to emerge. Although wage and price pressures are likely to remain persistent, there has been some tentative evidence of an easing of supply-demand imbalances leading to moderating wage and price pressures, particularly with respect to the goods sectors. In the latest CPI data, core goods inflation dropped 0.4% m/m, the second sharpest decline since the pandemic period, and deflationary forces became more widespread. There is also broader evidence from private sector estimates that rent inflation has downshifted. While it could be nearly a year until that is fully reflected in the official data, given the focus on a broader stock of properties, it provides some confidence that shelter inflation should be lower twelve months ahead than currently. Finally, there is conflicting evidence in health care inflation, which is falling sharply in the CPI, but looks set to rise in the PCE, given differences in how these are measured. This dynamic should lead to a sharp narrowing in the spread between CPI and PCE inflation over the next year.
Euro Area inflation
Inflation running even higher than in the US. EA inflation has surprised dramatically to the upside in 2022. Headline HICP inflation was 10.6% yoy in October, comfortably the highest since the euro was formed in 1999. We expect headline inflation to peak soon at around 11%, not far below the all-time high of 13.5% yoy in 1973. Inflation in Germany already exceeds its 1970s highs. Core and underlying inflation metrics are also at record highs. Euro area core was 5.0% in October and the average of all our underlying indicators was close to 6%, more than double its previous 2008 historical peak.
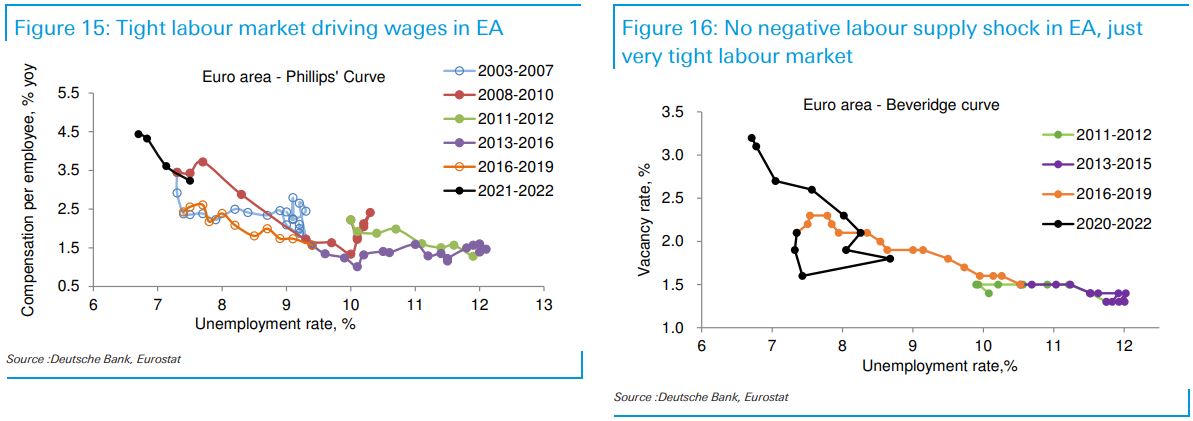
Inflation driven by supply shocks and strong demand. The surprising surge in inflation this year has been driven importantly by soaring energy and food prices caused by the cutoff of gas from Russia and other developments relating to the war in Ukraine. While commodity prices may have peaked, they will likely remain at levels that will continue to pass through to and help support broader consumer price inflation at levels higher than generally expected by consensus and ECB forecasters. These direct and indirect effects could easily add 2pp to HICP in the next 12 months. The other key driver has been firm consumer demand, which has helped to tighten the labour market.
The labour market is historically tight as reflected by both the unemployment rate and the unemployed to vacancy ratio. Unlike the US, declining supply of labor has not been a factor, as labor force participation has moved above pre-pandemic levels. Thanks to policies aimed at keeping workers attached to their jobs during the pandemic—widespread use of furlough schemes—participation rates fell less in Europe than the US. And as the labor conditions tightened during the postpandemic recovery, more workers were attracted into the market. As a result, neither the Beveridge curve nor the Phillips curve has shifted. Rather we have seen a move leftwards up the steeper part of these curves, consistent with a labor market that has been driven to extremely tight levels by strong aggregate demand.
Wage inflation is elevated. The pace of wage inflation has picked up from 2.5% yoy pre-Covid to somewhere probably close to 4.0% yoy in Q3-22. We expect hourly labour costs to reach 5% yoy—in line with the new Central Bank of Ireland/ Indeed.com wage tracker (see here). This is the highest since the early 1990’s. Our wage-sensitive HICP basket currently also shows a 5% yoy inflation rate. This basket highlights how the sectors most susceptible to passing on higher labor costs are already doing so at the rates observed historically (see here). This should support elevated price inflation into next year as firms retain some degree of pricing power.
Turn in headline inflation may not be far off, turn in core will be slower. We are mindful that forecasters have been consistently wrong in calling for an impending downturn in inflation over the past year. We have also noted factors like elevated material input cost levels and wage inflation that are poised to keep inflation higher than generally expected over the year ahead. That said, several factors do point to a peaking in headline inflation over the months ahead. Commodity prices (Brent, food, natural gas in particular) have peaked while early signals of supply chain stress have normalised (e.g. delivery times, freight costs). Rent inflation is not driving services inflation and the European housing market structure and policies mitigate it relatively more than in the US. Finally the looming economic slowdown will dampen inflation momentum—we turn to this next. Nevertheless, all things considered, while the peak in headline inflation is close, the decline in 2023 will be relatively slow. This is in part because core inflation is likely to remain in a tight range of c.5.0-5.5% until the end of next summer before turning down.
Historical evidence on the cost of disinflation
As we have seen, inflation has surprised, even shocked, to the upside in the past year in both the US and Europe, indeed across much of the globe. While a downturn may finally be emerging or on the way soon, there are also significant forces operating to keep inflation well above desired levels for some time to come. Can central banks deal with this problem without incurring substantial economic costs (i.e. moving into recession)? Is there reasonable hope for an “immaculate disinflation” as central banks and many private sector forecasters still seem to expect? In this section we review what past experience has to say on the subject. Disinflation always costly in the past. An examination of the historical record finds that successful disinflation does not occur on the cheap. It generally comes at a substantial cost in terms of jobs lost and output foregone. We have examined all episodes in the US and several other G-7 countries (Germany, UK, and Canada) since the 1960s in which disinflations of at least two percentage points occurred.
(“Disinflations” were defined as peak-to-trough declines in a two-year trend or moving average of core inflation.) In all instances, the disinflations were associated with increases in unemployment of at least two percentages points and in most cases substantially larger increases. The rises in unemployment, in turn had generally been induced by central bank tightening aimed at quelling inflation that had risen to undesired levels.
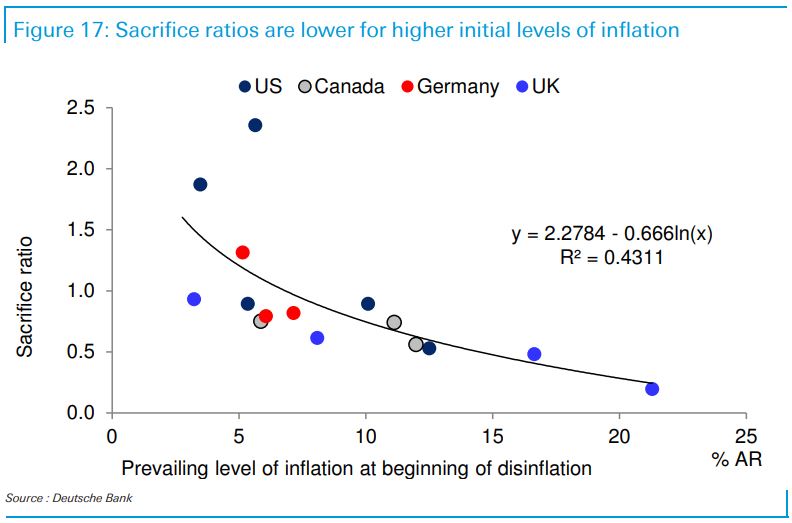
Disinflation more costly the closer you get to target. The scatter plot below shows the sacrifice ratios for each of these disinflations plotted against the level of trend core inflation prevailing at the time that it began to fall. The sacrifice ratio is the ratio of the cumulative rise in unemployment to the decline in trend inflation recorded during the disinflation episode. That is, it shows how much the unemployment rate rose for every percentage point decline in inflation that occurred. The slope of the regression line identified by this scatter plot indicates that the sacrifice ratio tends to be smaller for larger disinflations. That is, while all disinflations are costly, they tend to be less costly (in terms of increase in unemployment per percentage point of reduction in inflation) when inflation is being reduced from high levels than when it is being reduced from lower levels. This suggests that central banks have to work harder to get all the way back to target. And in doing so they will likely face increasing resistance to their efforts to reduce inflation as they move closer to those targets.
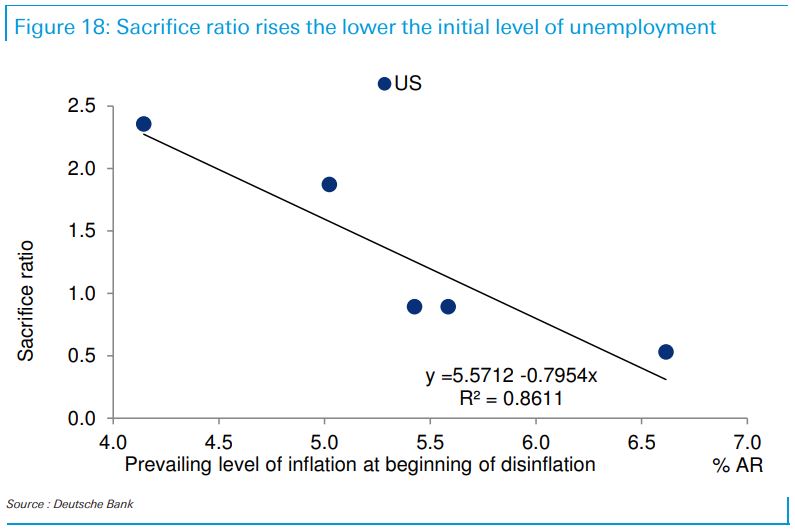
Disinflation more costly the tighter the labor market to start with. We have also considered how sacrifice ratios vary with the degree of tightness in the labor market at the onset of the disinflation–where labor market tightness is gauged by the level of trend (the two-year moving average of) unemployment. As indicated in the scatter plot below, for the US, the sacrifice ratio is greater in instances when the labor market is tighter to begin with. The relationship shown indicates that with the US unemployment rate currently running below 4%, the sacrifice ratio could be greater than 2. This would suggest that a Fed desire to reduce core inflation from around 5% to 2% could cost more than a six percentage point increase in unemployment. However, historical experience is at best only a very rough guide and as discussed further below, we see good reason the sacrifice ratio could be substantially lower this time around–but still well above zero.
Costs rise when disinflations fail.The historical record also shows that in a number of disinflation episodes, especially throughout the 1970s, central banks in the US and Europe failed to return inflation all the way back to desired levels. This occurred because policy tightening was reversed too quickly and aggressively when economies moved into recession. The quick pivots to often strong stimulus fostered speedy economic recoveries but also meant that inflation would resume uptrends from higher than desired levels. This stop-go policy pattern actually helped elevated inflation to become increasingly ingrained over time into inflation expectations and wage-price setting. When central banks in the US, Germany and the UK did finally address the inflation problem in earnest in the early 1980s, they had to engineer severe recessions in order to return inflation sustainably to desired levels. Unemployment rates for all three countries moved up into the 8 to 10% range during that period.
How high will the cost be this time around?
Historical experience suggests that returning inflation from recent levels will take considerable effort on the part of central banks, costing increases in unemployment of at least several percentage points. Such costs are far in excess of what central bank and consensus forecasts are anticipating.4 There are good reasons why the cost could be lower this time around, but there are also good reasons to think the consensus view has not factored in the lessons from history sufficiently.
On the favorable side, we can note that:
- Central banks have learned from historical experience. While slow to recognize the severity of the inflation problem, once they did, the Fed and ECB moved aggressively to deal with it, raising rates faster than at any time since the Volcker era. This action has helped hold the lid on longer-term inflation expectations which will serve an anchor to help return inflation to desired levels as aggregate demand softens.
- Structural changes in labor markets have improved prospects for disinflation. Elevated inflation has become less ingrained in the economy than it did through the 1970s because wage-price dynamics have eased. Labor unions are much less prevalent/potent today than they were several decades ago and their reduced bargaining power means that the near automatic indexation of wages to increases in prices is much reduced.
- The relative brevity of the current inflation episode has meant that (1) memories of times when inflation was very low are still fresh, and (2) high inflation has had less opportunity to work its way into the system as sustainably as it did over the entire decade of the 1970s.
On the unfavorable side:
- This inflation may still be a young one but it has broadened substantially. Inflation is now much more than a supply-driven goods sector problem. It has spread deep into service sectors and now excessively tight labor markets. And, while longer term inflation expectations still seem relatively well anchored, broader measures including short term expectations are looking more troublesome.
- The Phillips curve has flattened since the 1970s, meaning that central banks have to work harder and raise unemployment more to reduce inflation.5 That said, in very recent years, there is some evidence—including in the euro area (Figure 15)—that the relationship has steepened again as suggested by the surprisingly rapid pickup in inflation over the past couple years.
In brief, there are good reasons to expect the costs of dealing with the current inflation will be lower than in the past, but also good reasons to expect they will still be significant. Our views on the coming US and EA recessions are summarized as follows.
US recession
Moderate recession coming. Based on our work using recent academic Phillips curve based inflation models, we expect that the unemployment rate will likely have to rise a couple percentage points, into the 5.5-6.0% range. This is on the upper end of the range of other forecasters and well above the 4.4% peak unemployment rate forecasts from the Fed, although Fed officials have more openly discussed the likelihood that the labor market will likely need to soften more materially. Lowering labor demand will not be enough. There has been some debate about whether the labor market can loosen primarily by reducing job openings as the US economy is currently on the steep portion of the Beveridge curve. While we cannot confidently rule out this potential resolution to the historic labor market imbalances
currently plaguing the US, both history and recent evidence suggest the labor market is likely to come into better balance through a meaningful rise in unemployment. Historically, there is little evidence of job openings declining without layoffs rising. More recently, sector-level data indicate that sectors reducing job openings are on average also increasing layoffs and cutting hires – dynamics that will ultimately lead to higher unemployment.
Fiscal and monetary policy will be constrained. In terms of the magnitude of the recession, there are crosscurrents at play. On the one hand, the typical countercyclical policy response that helps to buffer against a more severe downturn is likely to be constrained. The Fed will be constrained by still above target inflation, while the midterm elections point to a gridlocked Washington that will not be proactively responding to a downturn in the economy. Indeed, there are downside risks to fiscal policy this year if House Republicans aim to leverage the budget process or debt ceiling to extract spending concessions. On the other hand, household and business balance sheets are in good shape without an obvious need for deleveraging, and classic cyclical sectors – housing and autos – have been supply constrained and / or are already going through a meaningful retracement in activity given the tightening of financial conditions.
Baseline is recession begins mid-2023. While we would caution that pinpointing the specific contours of a recession is fraught, on balance, we see these forces leading to a moderate recession from a historical perspective, one that begins around mid-2023 and lasts three to four quarters. In terms of magnitude, we forecast a peak to trough decline in real GDP of around 1.25 percentage points and rise in the unemployment rate of roughly similar magnitude (relative to right before the recession). While this ratio (unemployment rise to GDP decline) is low relative to history, we think it best reflects the fact that the labor market is currently very tight due meaningfully to a short supply of labor. This dynamic could lead to some hesitancy in laying off workers, if firms believe it would be difficult to hire them back once demand rebounds.
