
Morgan Stanley digs into the biggest risk to global growth that I can see. Once the Fed delivers a demand hiccup, US business will destock aggressively and a trade shock radiate outwards to already weak China and Europe. It is a reverse “bullwhip effect” that will crush margins, crash goods inflation, and lead to a short and sharp global recession.
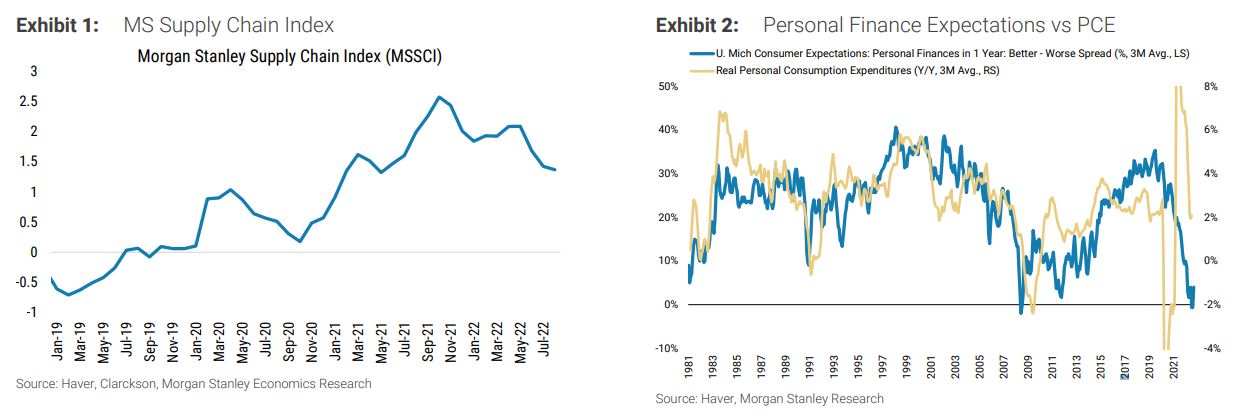
The problem with inventory is twofold – supply chains bottlenecks are clearing while demand, especially demand for goods, is slowing. Supply chains have stabilized for most industries and goods imports into the United States have surged higher on both a real and nominal basis. Our Global Economics team’s proprietary MS Supply Chain Index shows supply chains have continued loosening with lower global demand playing a key role in reducing bottlenecks ( Exhibit 1 ).
Consumers overspent on a number of goods related items, especially durable goods like furniture, tech products and leisure equipment, as a result of Covid/lockdowns. Goods consumption, on a real basis, has been declining since the second quarter of 2021 and is now back near trend. We are expecting overall demand to slow beyond the payback in overconsumption of goods. While Consumer Confidence has rebounded from the all time lows observed this summer it remains weak and we expect consumers to pare back spending. The spread between consumers who expect their personal finances to be better vs worse in one year remains low which points to downside in real personal consumption expenditure (PCE) ( Exhibit 2 ).
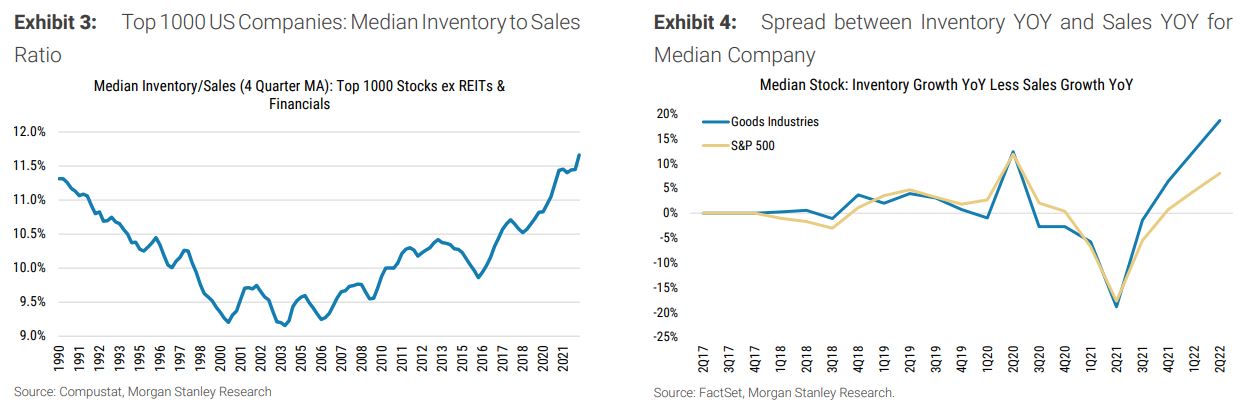
Inventory to Sales for the median US company has been on the rise since the Financial Crisis and is now at the highest level since 1990 ( Exhibit 3 ). Inventory to sales ratios have increased substantially and are sitting at elevated levels for the Consumer Staples, Industrials, and Tech sectors. We also looked at the spread between year over year inventory growth and sales growth to see which industries have the biggest mismatch between inventories and top line growth. The median company within goods producing industries has a whopping 19% mismatch between inventory and sales growth ( Exhibit 4 ). Industries that produce durable goods are seeing a bigger mismatch between inventory and sales growth than industries that produce consumable goods.
For the US economy at large, inventories for all companies (publicly traded and privately held) are gradually rebuilding as supply chains free up and demand slows. Over half of the shortfall in real inventories since the beginning of 2020 has come from motor vehicles and parts. Inventory building in retail as a result of supply chain pressures and demand easing will provide alleviation on core goods inflation in our US Economics team’s forecasts through 2023. Our Transportation team’s Shipper Survey reveals that net ordering levels dropped to “off-the-chart” levels (-40% y/y decline) not seen in the 12+ years of the survey ( Exhibit 5 ). This decline is much steeper than what we have seen in past downturns in 2016 and 2019. Simultaneously, net inventory levels also rose sharply – albeit not to record levels – these are inventory levels last seen in 2018 as we built up inventories into tariff risk only to de-stock through 2019. The net gap between ordering and inventories is also the highest in the 12 year history of this survey question.
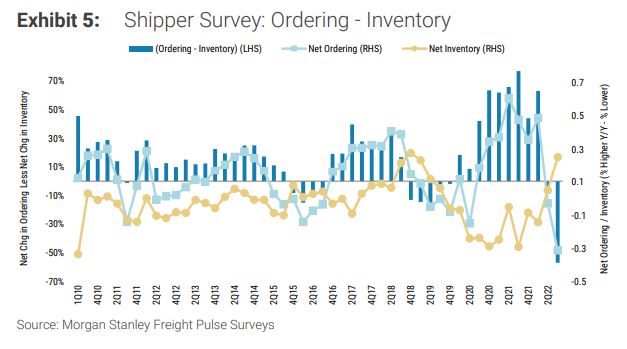
Almost half of respondents say that their inventory is higher and ordering is lower going forward – which firmly indicated an overinventoried/de-stocking condition. Faced with a glut of inventory, companies will need to decide whether they want to accept high costs to continue holding inventory, destroy inventory, keep prices high and take a hit on the number of units sold, or slash prices to stimulate demand. We believe many will turn to aggressive discounting to solve their inventory problem which is likely to spark a “race to the bottom” as companies attempt to cut prices faster than peers and move out as much inventory as possible. This dynamic will weigh heavily on margins and fuel the earnings slowdown we are predicting.
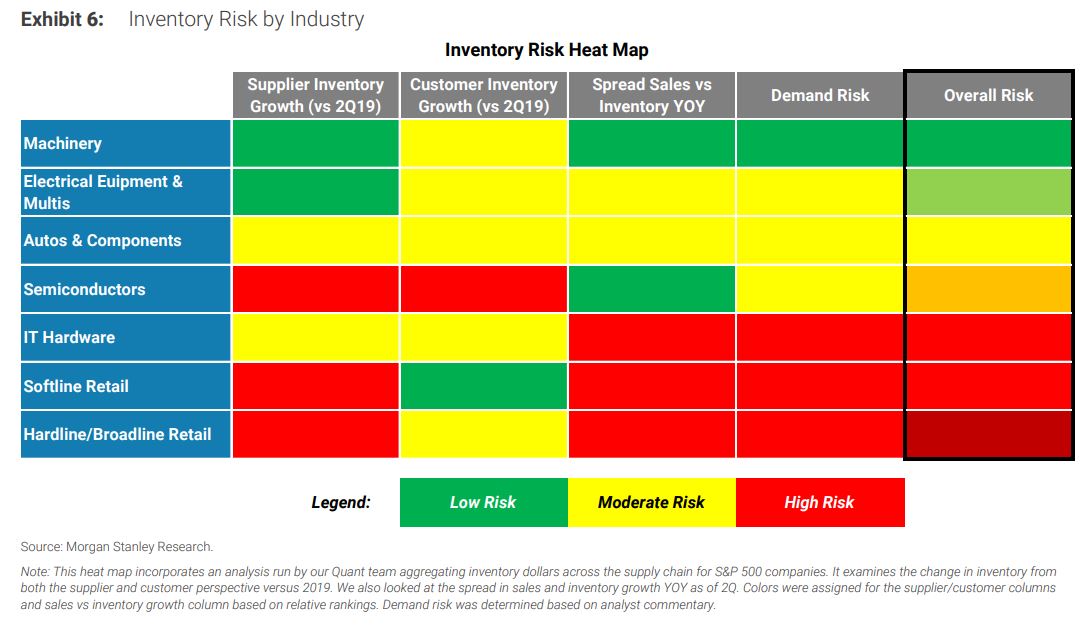
While risk from excess inventory is a broad problem for the market and for goods producing industries we wanted to assess which industries were relatively more or less at risk. We aggregated company level supply chain data leveraging our quant team, industry data, and analysts’ view of demand into a inventory risk heat map ( Exhibit 6 ). Consumer retailers and IT Hardware face the most risk from an inventory perspective while semiconductors and autos companies face a moderate amount of risk. Machinery and Electrical Equipment/Multi-Industry companies face the lowest amount of risk. This largely lines up with our sector ratings; we are underweight Consumer Discretionary and Tech Hardware while we are equal-weight Consumer Staples, Industrials, and Tech ex-Hardware. Our overweights are Utilities, Health Care, and Real Estate, all sectors that are not goods intensive.
