
BofA with its latest global signals. Good advice.
Global Proprietary Signals
BofA Global Proprietary Signals is a compendium of proprietary indicators that reflects the insights of BofA Global Research analysts. It catalogues a range of indicators across different economies/strategies/ markets/asset classes that are published regularly. We publish this report on a monthly basis.
Perhaps this is not the time to ‘Keep calm and carry on’
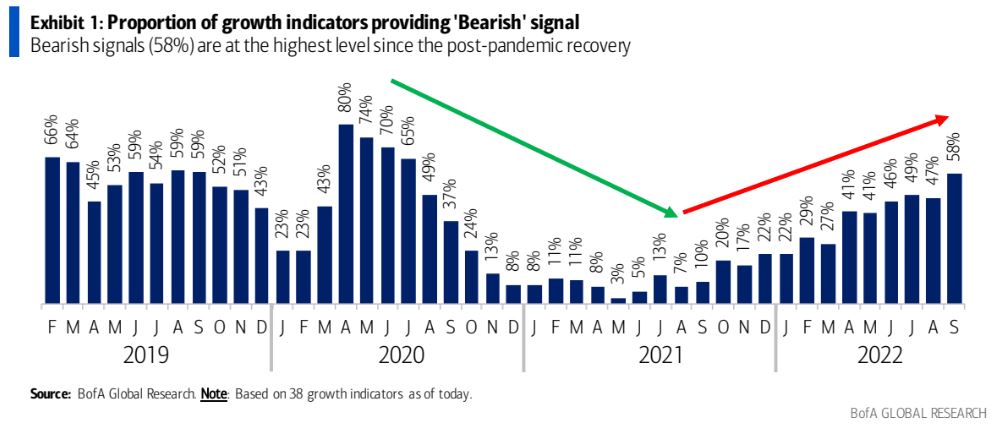
Financial markets are in flux as synchronized monetary policy tightening increases the risk of a recession. Our proprietary indicators reflect this dynamic with 58% of 38 growth indicators providing a bearish signal – the highest level since the post-pandemic recovery. This sharp deterioration in growth and uber-bearishness in sentiment indicators do not, however, appear to be reflected in actual investor flows and allocations.
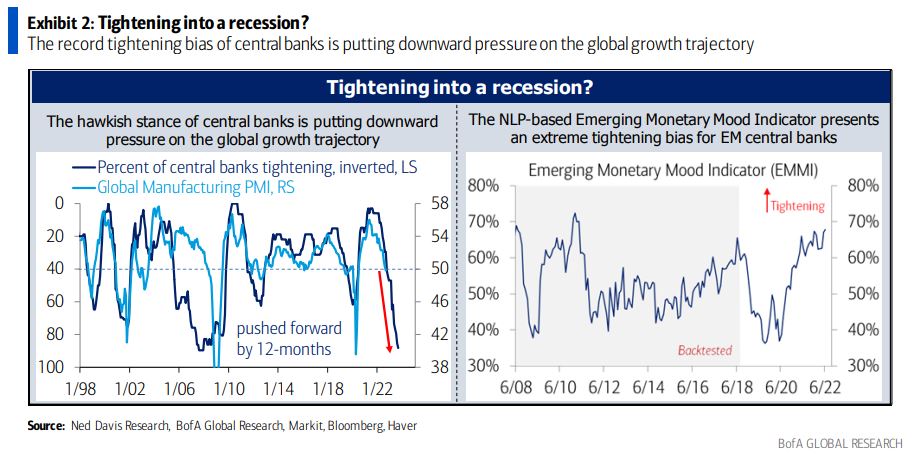
Markets bottom when central banks panic. We are currently facing one of the most aggressive tightening episodes in history with 88% or 30 out of 34 global central banks in tightening mode – the highest since the subprime mortgage crisis in 2006-07. Unsurprisingly, all five of our natural language processing (NLP) based central bank mood indicators – viz. the Emerging Monetary Mood Indicator, the Bank of England Mood Indicator, the RBA Sentiment Indicator, the NORBI Mood Indicator, and the Riksheard Mood Indicator – present a tightening bias.
The Words vs Actions Disconnect
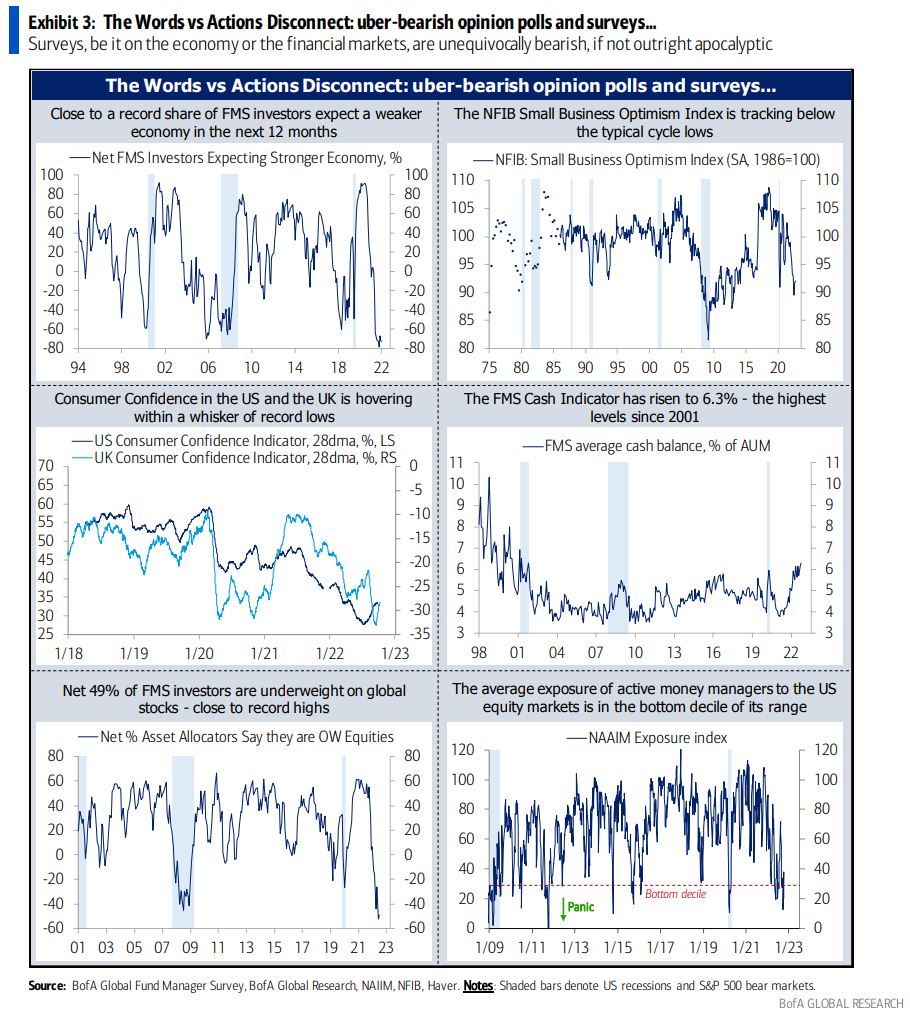
Similarly, our surveys on the economy and financial markets are unequivocally bearish, if not apocalyptic. The BofA Global Fund Manager Survey (FMS) bears testimony with net 72% expecting a weaker economy in the next 12 months, not far from the most pessimistic reading of 79% (July 2022) in the past 28 years. The National Federation of Independent Business (NFIB) Small Business Optimism Index, which takes a pulse of US small businesses, is tracking not only well below the long-term average of 98 but also the typical cycle lows.
The US Consumer Confidence Indicator, although off the lows, is still languishing at the bottom end of the scale, with majority of the respondents expecting a recession in the next 12 months. So is the UK Consumer Confidence Indicator, hovering within a whisker of record lows, as consumers remain wary about their finances and the economy, presenting downside risks to the growth outlook.
Opinions about financial markets are even more dismal, as evidenced by the underweight allocation to global stocks by a record net 49% of participants. As recession risks aggravate, FMS investors profess to assuming lower-than-normal risk, boosting the FMS Cash Indicator to 6.3% – the highest levels since 2001 and well above the long-term average of 4.8%. Similarly, the National Association of Active Investment Managers (NAAIM) Exposure Index, which tracks the average exposure to US Equity markets as reported by active moneymanagers is in the bottom decile of its range.
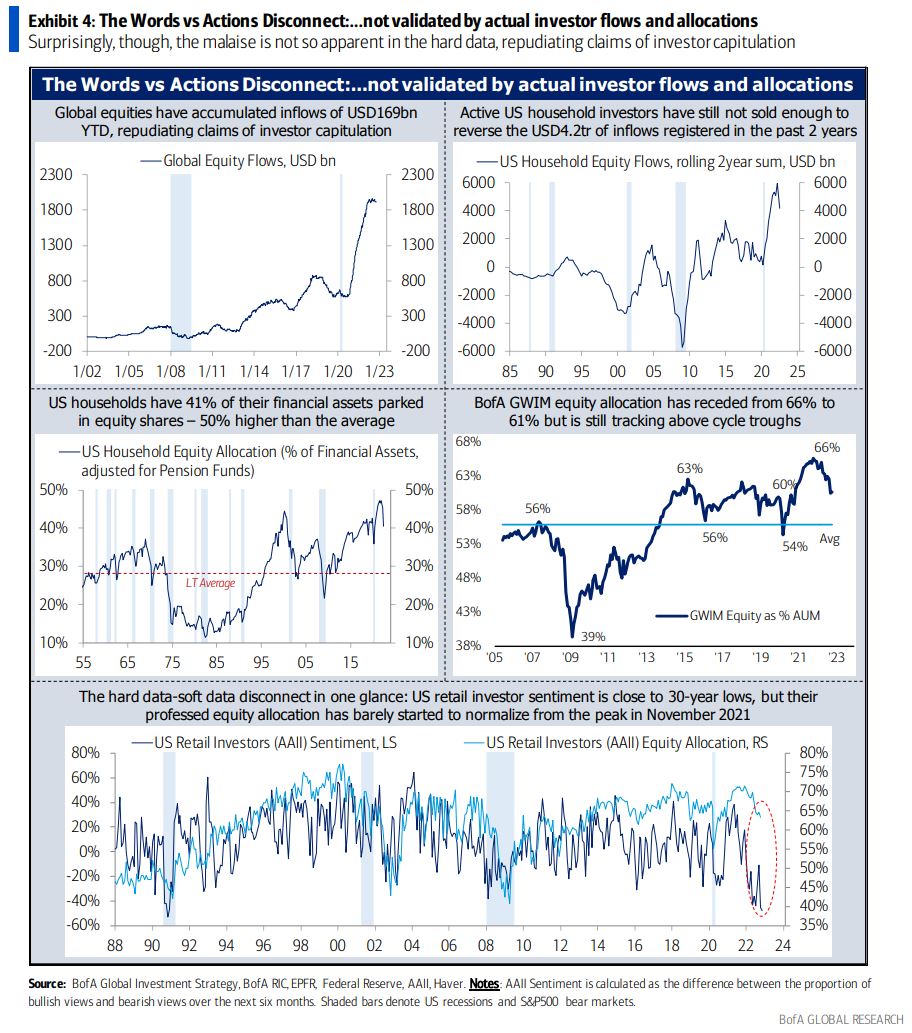
Surprisingly, though, this angst is not reflected in positioning data. Indeed, global equities have accumulated inflows, not outflows, of USD169bn YTD with ETF inflows (USD417bn) more than eclipsing the redemptions from active funds (-USD248bn). And the trends are similar across client categories on our platform – hedge funds, institutional, private, and corporate have all been net buyers of US equities in the past 3 months. More specifically, active US household investors, the USD40tr whale in equity markets, have still not sold enough to reverse the USD4.2tr of inflows registered in the past two years.
Equity allocations, similarly, are not reflective of a market trough. US households and non-profit organizations have 41% of their financial assets, adjusted for pension funds, parked in equity shares – 50% higher than the long-term average allocation to equities. While not so stark, the BofA Global Wealth and Investment Management (GWIM) equity allocation has receded from 66% to 61% but is still tracking above average levels (56%), let alone the cycle troughs (50%). The gap between the American Association of Individual Investors (AAII) sentiment towards the stock market over the next six months and their equity allocation captures the disconnect succinctly – while the former is close to 30-year lows, the latter has barely started to normalize from the peak in November 2021.
Consumer behavior is also not consistent with the typical setup of a market bottom. Retail spending in the US, as measured by BAC aggregated credit and debit card data, was up 4.4% YoY on a per household (HH) basis in September, reflective of a slowdown but not a recessionary phase. The bad news is that our house-view calls for a recession to start 1Q2023, spelling out further weakness in consumer spending.
Follow the signals, stay defensive
The market setup provides us little to cheer about. Despite a grim outlook for global growth, there are scant signs of investor capitulation in terms of positioning and flows. In addition, the hawkish stance of central banks, in conjunction with the ongoing accelerated pace of liquidity withdrawal by the Fed, is likely to sustain the downward pressure on the global growth trajectory, with no inflection in sight. Stay defensive, preserve capital and live to fight another day
