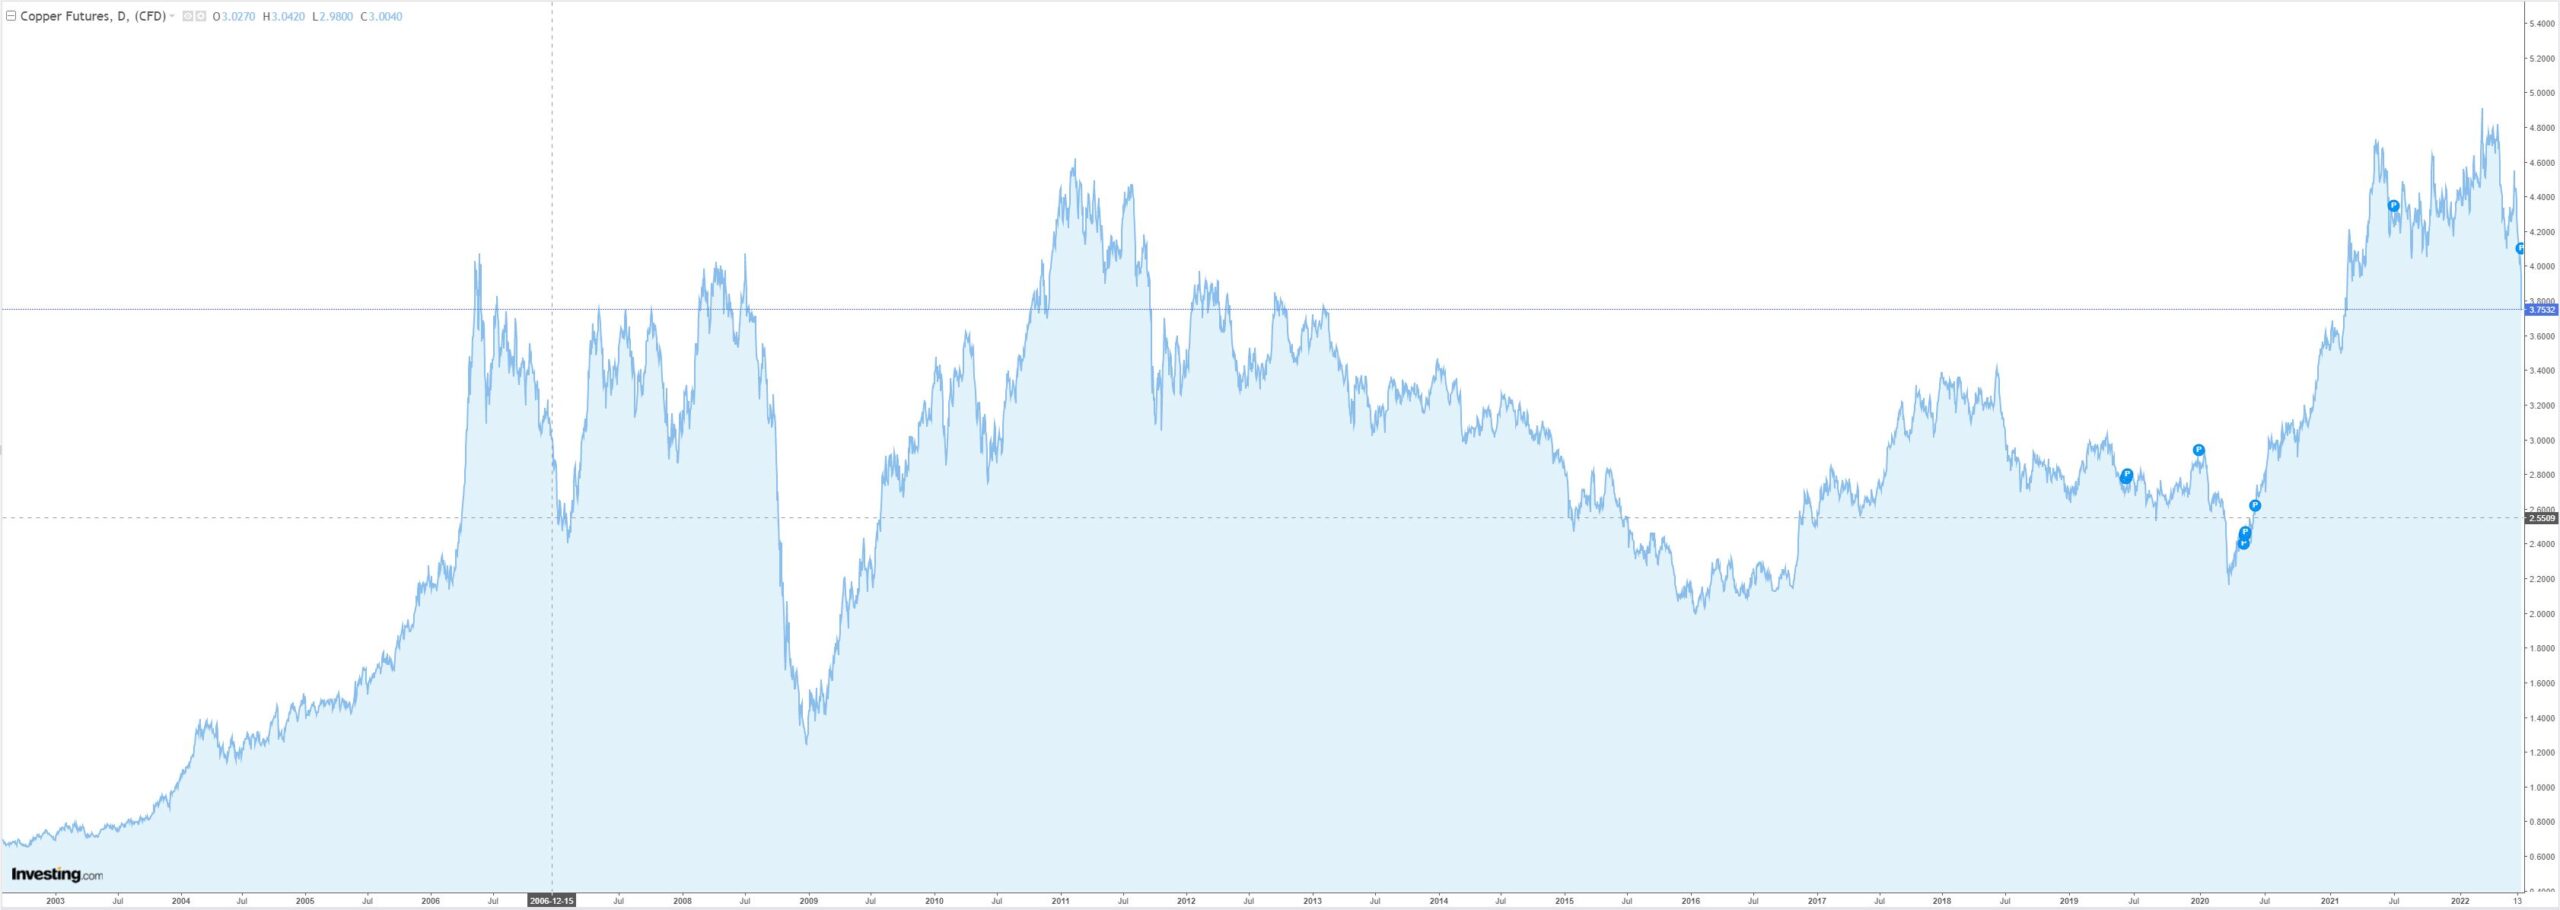
The copper chart is not pretty. After being driven to all-time highs by Wall Street spruikers it is now crashing:

The long-term story for copper is no shortages at all. The great EV and power transformations can largely be absorbed by recycling.
There are 2061 words left in this subscriber-only article.
Get your first month for $1
There is also plenty of supply coming on stream in the next few years. Societe General has it.
—
Copper prices more than doubled from 1Q20 – when COVID hit the global economy – to May 2021, but this impressive rally then stopped and prices have since traded sideways in the following ten months. We have been bearish on copper since the last part of the rally. Despite the exuberance for the base metal complex at the rally’s peak, copper prices are currently $250/t below what was our 3Q21 bearish forecast ($9,500/t). The war in Ukraine derailed our bearish forecast as copper was caught in a broad surge in the base metals complex. Russia, as a producer, should have a limited impact on copper markets. In the short term we expect copper to remain around current levels or even grind slightly higher in 3Q22 but our mediumterm view on copper remains bearish.

- Demand – electrification and investment plans. There is a lot of talk about energy transition friendly fiscal stimulus plans and other green deals. These packages include US President Joe Biden’s $1.2tn infrastructure plan passed into law in November 2021 and the €800bn Next Generation EU recovery fund. Despite a crowded newsflow with COVID variants and most recently the war in Ukraine, the topic of climate change has continued to gain traction with the recent COP26 conference in Glasgow and the Intergovernmental Panel on Climate Change (IPCC) in its Sixth Assessment cycle (three major reports were published recently). This plan could be soon supercharged further in Europe as the continent seeks to become more energy independent and does not have significant fossil reserves. While these plans and the broader energy transition will clearly drive the copper market in the next few decades, we do not expect any significant impact over our forecasting horizon to 4Q22, as the actual need for the metal will be spread over many years. Similarly, copper demand for electrification is a hot topic, but the market is already looking a few years ahead. Renewable energy generation and EVs are not yet game-changers for copper market fundamentals. China saw the world’s sharpest acceleration in renewable energy capacity in 2020, from 75GW to 140GW. We estimate that this 65GW increase required 0.35mt, or 1.5%, of global consumption in 2020. Globally, we estimate annual copper demand for renewable energy infrastructure to reach 1mt in 2025. On average, this would be growth of 0.1mt per year. This figure represents only slightly more than the 0.4% of estimated 2021 global consumption. Copper demand forecasts for renewable energy capacity are very uncertain. They can vary greatly depending on the technology, with some upcoming technologies requiring more usage or, conversely, substitution out of copper. For instance, an offshore windfarm requires two to three times more copper per MW of capacity than an onshore windfarm, depending on the distance from the coast. That said, even if copper demand from renewable energy infrastructure is twice what we forecast, the market will still be in a large surplus in 2023-24.

- Mine supply. In 2022 and 2023, we expect the market to be flooded by a net increase of 2.6mt of mine supply, a big increase of 12.2% increase in just two years, factoring in end-of-life operations and decreasing ore grades in other operations. Total mine supply should reach 24.1mt in 2023, up 15% from 2019. Despite the resilient demand discussed above, this upcoming supply will push the market into a surplus of around 270kt in 2022 and then significantly deepen in 2023, toward 540kt or 2% of the forecast demand for 2023. The upcoming mine supply and the induced deficit should become a focus for investors in the second half of this year if no other major macroeconomic or geopolitical events come to the fore. Our mining and metals equity analysts are monitoring upcoming production on a mine-by-mine basis for the 20 biggest copper producers, and most of the growth we forecast for 2023 comes from these largely predictable sources. New projects are due to be commissioned and will already deliver over 400kt this year and more than 500kt in 2023. New greenfield and brownfield expansion projects coupled with the ramp-up of existing operations combined will also lead to outstanding growth in mine supply.
Most of the additions come from the ramp-up of Kamoa-Kakula with a further 315kt, but also Grasberg underground, Spence, Timok, Olympic Dam, Chuquicamata and Mirador. Recovery of production at Escondida and Toromocho will also help. The median (50th percentile) producer cost is at $4,242/t on a C1 + sustaining capex basis, while the 90th percentile of the miners cost curve stands at around $6,371/t. Both sharply increased by almost $1,000/t over the past six months but they both remain above current prices, showing that almost the entire industry is still enjoying very positive cash flows. Most project feasibility studies have factored in upside price scenarios of around $8,000/t, and thus current prices strongly incentivise new projects and expansion projects to go ahead. With these cost data date from 1Q22 – when energy prices started to soar – the margin for most copper miners is still comfortable enough to face higher energy costs. We expect energy prices to remain high but not to rise much further, thus large cost increases for copper miners are behind us. In total, we estimate that ten projects, with total production estimated at 1.0mt, are likely to come on-line by 2023. The table below shows the largest projects starting production by 2024 or earlier. In the longer term, beyond 2025, mine supply will be unable to keep up with increased demand due to a thin project pipeline and lack of capex. Projects take at least seven to eight years to be completed, so even a burst of investment today will not balance the market before 2030.
- Investment flows. Money managers and ETF investors have been one of the major drivers of copper prices during the COVID recovery to May 2021. We believe speculation and investments played a significant role in the strong price recovery as the copper price is usually not strongly driven by non-commercial money flows. This led us to have doubts about the rally’s sustainability early in 2021. Positioning on green demand and the commodity super-cycle could remain bullish, but the mood has shifted since last May with price and investments flows being mainly on pause.
We expect prices to reconnect with physical fundamentals, which are the strong surpluses we discussed in the previous sections WisdomTree Copper, by far the largest copper ETF (peak fund assets of $859m), saw an impressive $685m increase in AUM from March 2022 to May 2021, the largest 14-month increase since 2010. This 292% increase in AUM occurred while prices ‘only’ doubled, implying that the price effect on AUM combined with strong inflows into ETFs. Over the same period, the United States Copper Index Fund, the second-largest ETF (peak fund assets of $350m), grew almost 40x, seeing the largest inflow by far since it was created in 2011. Holdings also peaked in May 2021. Since then, the AUM of both ETFs dropped by $235m at WisdomTreeCopper (-27%) and $111m at the United States Copper Index Fund (-32%), while copper prices remained mostly stable. This
indicates strong investment outflows from the copper ETFs but the current total ETF AUM is more than 4x higher than the five-year average pre-COVID (2015 to 2019) while the current copper price is less than two times higher. This leaves a lot of dry powder for further outflows if AUM normalises toward the historical average.

He is also a former gold trader and economic commentator at The Sydney Morning Herald, The Age, the ABC and Business Spectator. He is the co-author of The Great Crash of 2008 with Ross Garnaut and was the editor of the second Garnaut Climate Change Review.
- And now for a copper glut… - June 24, 2022
- Bond bear market ends with a bang - June 24, 2022
- The commodities bubble begins to burst - June 24, 2022
YOU MAY ALSO BE INTERESTED IN
The commodities bubble begins to burst
Goldman's commodity bubble-blowers are
Daily iron ore price update (Xi's drivel)
The ferrous complex rebounded on June 23,
Daily iron ore price update (crunchy crashola sweet)
The ferrous complex was weak again on June 23,
Daily iron ore price update (bleeding stemmed)
The ferrous complex stemmed the bleeding on June