Last week, retiree Ron de Gruchy was featured on the front page of The West Australianclaiming that today’s mortgage holders “have it easy” and that it was much harder for the baby boomer generation when they were trying to service a mortgage:
“The high interest rates were a real squeeze on finances but you just adjusted… Overseas travel was non-existent for us and we never went for night’s out, or to the casino”.
“We were pretty frugal and we were happy. Back then, people didn’t complain – they just adjusted.”
These sorts of comparisons always make me cringe because commentators like de Gruchy only ever consider the initial cost of a mortgage, not the lifetime cost.
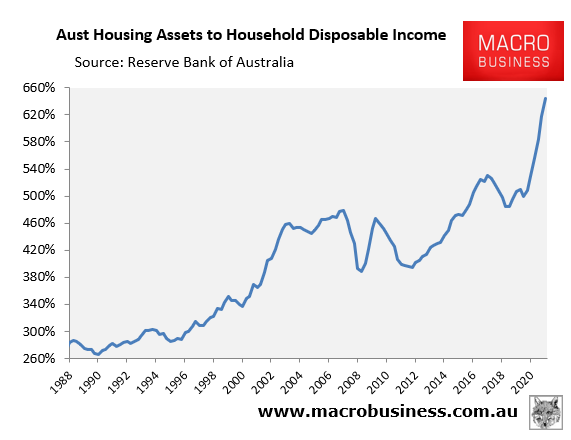
As we know, Australian property values as a ratio of household disposable income have more than doubled since the early-1990s, from 2.7 times in 1990 to 6.4 times as at December 2021:
Advertisement
The relative cost of Aussie homes has more than doubled over the past 30 years.
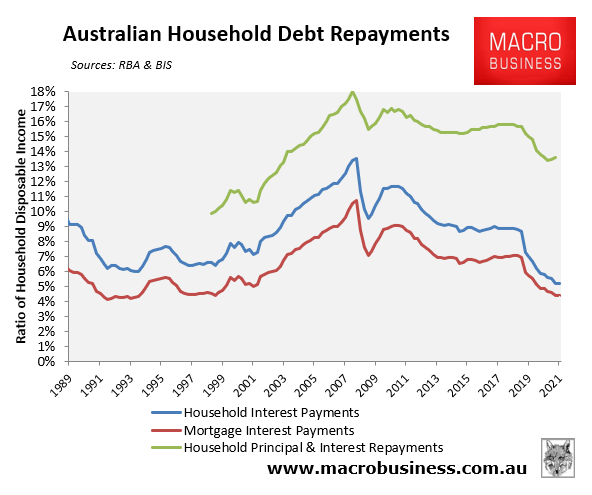
While record low mortgage rates have certainly reduced the interest burden, principal repayments have soared alongside prices. This is evidenced by the widening gap between the Bank for International Settlements’ debt servicing ratio (green line below), which accounts for principal and interest repayments, and the RBA’s interest repayments ratio (blue line below):
Principal repayments have grown as Aussie house price have soared.
Advertisement
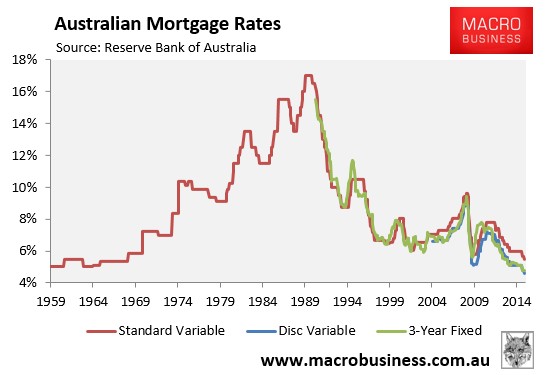
Second, the record high (17%) mortgage rates that the baby boomers complain about didn’t last long. A home buyer back then got to enjoy the benefit of a massive drop in mortgage rates over subsequent years and the corresponding massive rise in house prices:
Australian mortgage rates plummeted in the early 1990s.
Does anyone honestly believe that recent first home buyers are likely to face similar conditions in the years ahead, whereby mortgage rates more than halve and values skyrocket? The opposite is likely to happen whereby mortgage rates could double and house prices tank.
Advertisement
Third, not only do low mortgage rates make it harder to raise a deposit for a home (via lower returns on savings), but they also mean that a mega-mortgage today will remain a very big mortgage in a decade’s time thanks to anaemic wages growth. For recent home buyers, the mortgage pain will be both deep and prolonged.
This is the polar opposite of what happened to the baby boomer generation, whose small mortgage debts were quickly ‘inflated away’ by stronger nominal wage growth.
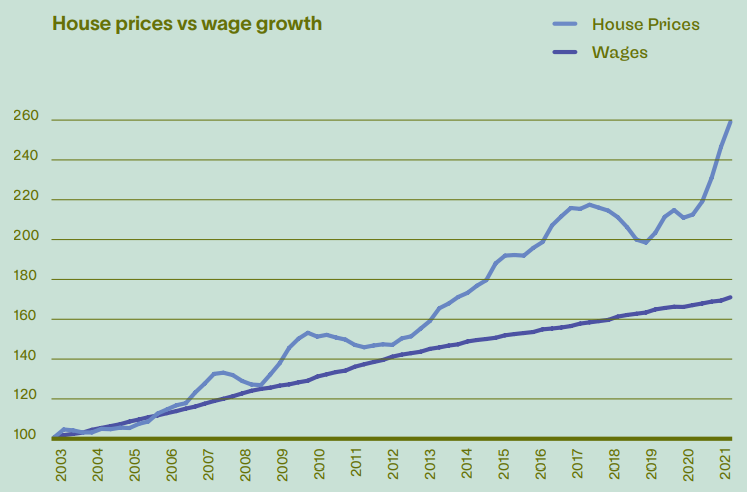
The final word on this issue must go to last week’s excellent Per Capita report, which neatly illustrated how home ownership and the lifetime cost of housing has gotten much worse over the generations:
Advertisement
Since the 1990s, house prices have risen from 2.5 times annual household income, to over six times today. Australian households are among the most indebted in the world…
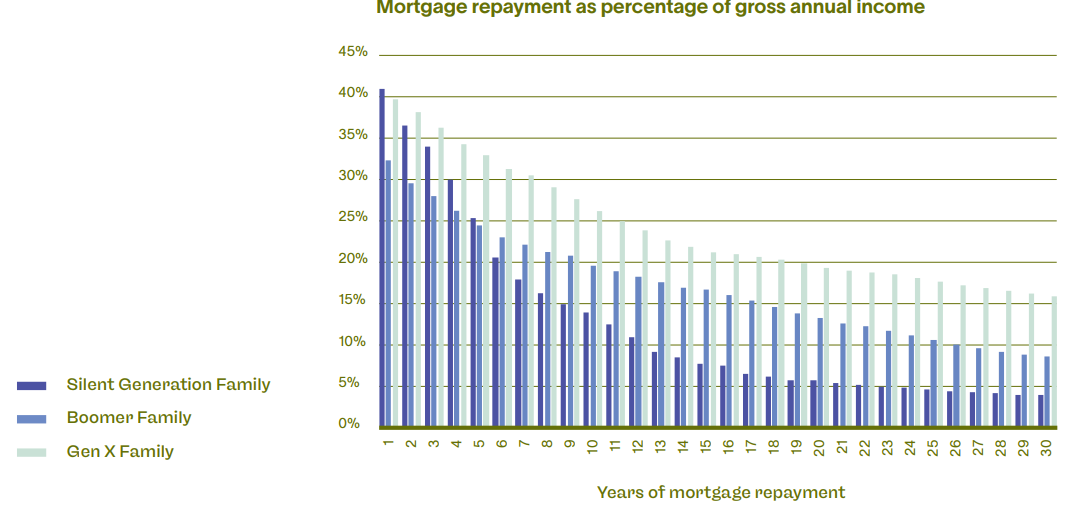
The cost of housing as a proportion of an individuals’ income has been increasing over the past 50 years. Taking three generations as examples, and comparing median mortgage costs to median wages, we show that the lifetime cost of a home purchase shows a quite different picture to that provided by just comparing single year mortgage costs…
We estimate the Gen X family is paying $1425 per month on their mortgage in 2021. If they were on the same repayment trajectory as the Boomer family their monthly bill would be $910, while if they were on the Silent Generation trajectory it would be just $440 a month.
For the individual family, this is a huge loss of income – almost $1,000 a month – that would be far better directed toward education, health or day-to-day living expenses. For the nation, it represents a significant constraint on household consumption, which accounts for more than half of Australia’s
economic activity…
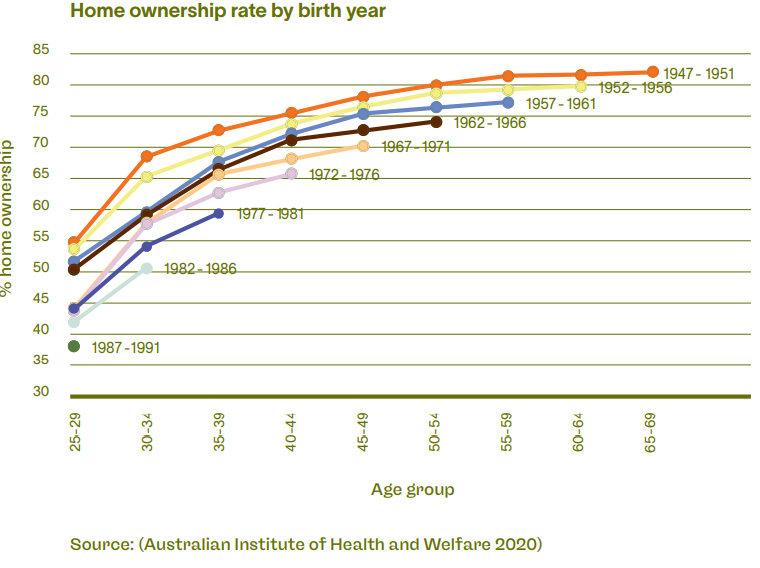
Perhaps the single most distressing and socially challenging contemporary housing issue is the decline in affordability between generations.
People born between 1947-1951 have experienced historically high levels of home ownership, from their 20s, through to their 70s. Following the 1947-51 birth cohort, there has been a decline of around 1.8-2.5% of home ownership every 5 years. For example, 37.4% of people born between 1987-1991 own a home when aged 25-29, down from 54.2% for people born between 1947-51. This trend is consistent across sub-60 age groups…
For people born between 1982 and 1991 we can expect, on current trends, to see around 55% owning a home before they are 40, 10% lower than their counterparts born between 1962 and 1971…
The above explains why commonly used measures of housing affordability – which only consider the size of the initial mortgage repayment on a brand new loan at a particular point in time – should be binned. They massively understate the affordability pressures facing today’s aspiring home buyers, many of whom will either miss out altogether or will still be repaying jumbo-sized mortgages for decades to come.
Leith van Onselen is Chief Economist at the MB Fund and MB Super. He is also a co-founder of MacroBusiness.
Leith has previously worked at the Australian Treasury, Victorian Treasury and Goldman Sachs.