Wall Street couldn’t wait for the new year to hit new time highs, having lifted nearly 30% in 2021, capping off one of the best years in history. The funny thing is, there’s been more than seventeen times since 1928 where the US stock market went up 30% or more in a calendar year, but putting things in persepctive, it also went up 31% in 2019 and 18% in 2020!
There has obviously been talk of bubblemania going on here, and any student of past booms and busts must be getting their rulers out to look at the longer term charts and start to think maybe some more risk management is necessary when allocating portoflios.
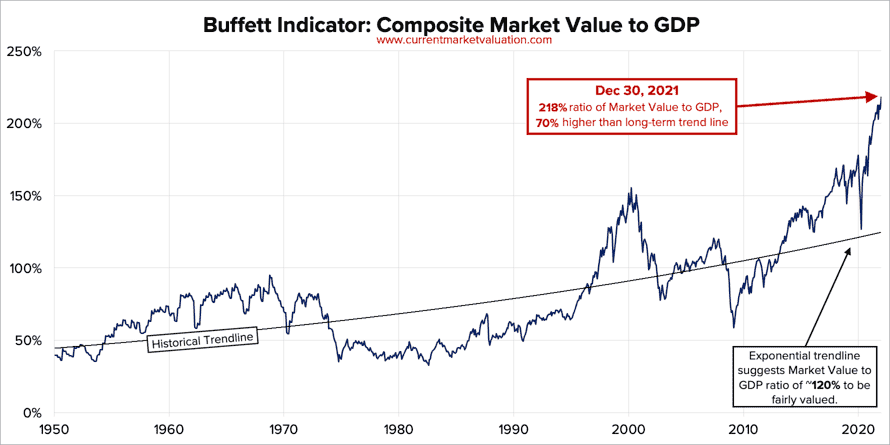
One of the better indicators to use is Buffetts – whereby you make a ratio of the total US stock market valuation to nominal annual GDP. Here’s the latest calculation, as of December 30, 2021:
Aggregate US Market Value: $51.5T
Annualized GDP: $23.6T
Buffett Indicator: $51.5T ÷ $23.6T = 218%
By our calculation that is currently 70% (or about 2.3 standard deviations) above the historical average, suggesting that the market is Strongly Overvalued. These are historical, all-time highs. However, with interest rates at historic lows, there is reason to suspect that “this time is different” may hold true.
Given that the stock market value represents expectations of future economic activity, and the GDP is a measure of most recent actual economic activity, the ratio of these two data series represents expected future returns relative to current performance. This is similar in nature to how we think about the PE ratio of a particular stock. It stands to reason that this ratio would remain relatively stable over time, and increase slowly as technology allows for the same labor and capital to be used ever more efficiently.
Advertisement
Now that is some measure of market value! Analogs to the tech boom are appropriate, also given the nature of monetary easing as we head into 2022 and face the fear that the Fed will finally end the stream, with a tapering of QE beginning in March and at least three interest rate rises to follow.
What makes last year’s performance even more outsized is the fact that there were more than 70 new all-time highs in the index last year alone, which is eye opening given how far along the bull market is preceding with more than 300 all-times high made since breaking the 2013 high. Another measure – drawdown – that is, how low the index went throughout the year before recovering – was also a very low 5%, or in the very lowest of percentiles when comparing yearly drawdowns in nearly 100 years of data.
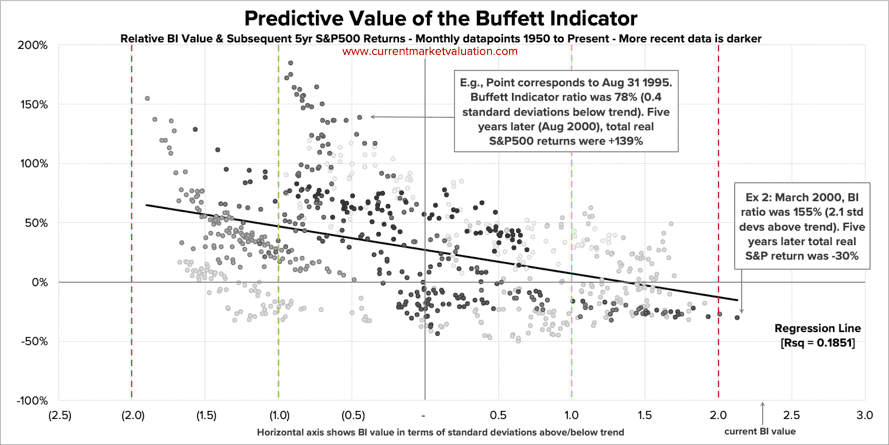
So are we already in the end stages of this boom or is there more to go? The Buffett Indicator does provide a modicum of predictive value, although it is very noisy. The monthly plot of the relative value of the indicator and the subsequent five year return shows only a minor R value, but there is something to be said for when valuations are extremely stretched like now.
Advertisement
The March 2000 analog is the most interesting one to note: