
This is the second in a series of four posts I’m publishing on the contrarian view for inflation.
- Part one: Inflation today is not the same as inflation in the 1970s.
- Part two: commodity inflation is far more leveraged to Chinese stimulus than developed market stimulus. And the signs are ominous.
- Part three: the inventory rebuild/supply chain “pig in the python”. The price signals of today are creating the excess capacity of tomorrow.
- Part four: how to position your investment portfolio
To stay updated on the rest of this series, sign up to receive email updates from us via the form below:
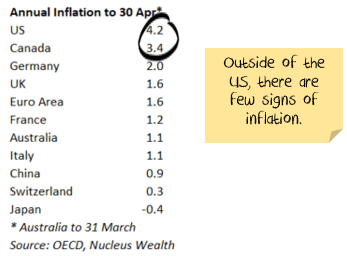
I primarily focus on US inflation statistics throughout this. This is for no more sinister reason than that North America is the only region with inflation at the moment:
China’s impact on commodity prices
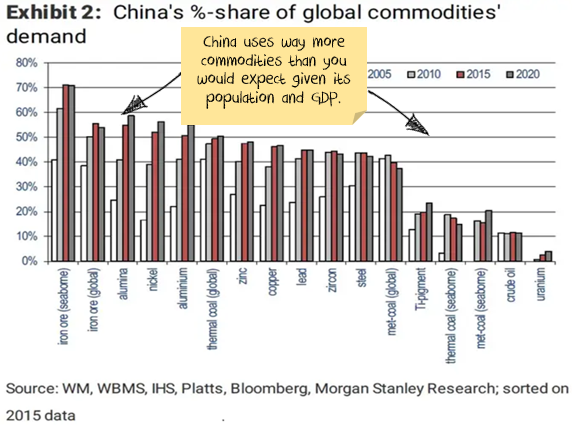
China uses an incredible amount of commodities relative to its size:
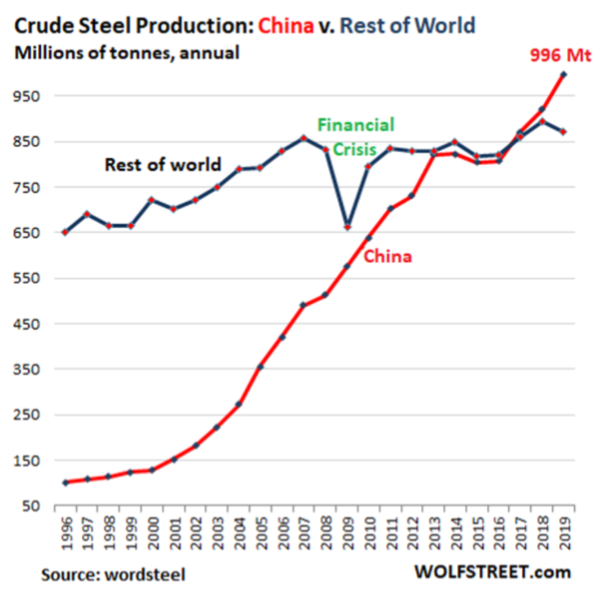
This is not a long-term phenomenon. It has arisen in the last 20 years. Here is the chart for steel; other commodities are similar:
Why does China use so much more commodities than you would expect based on population or economic size?
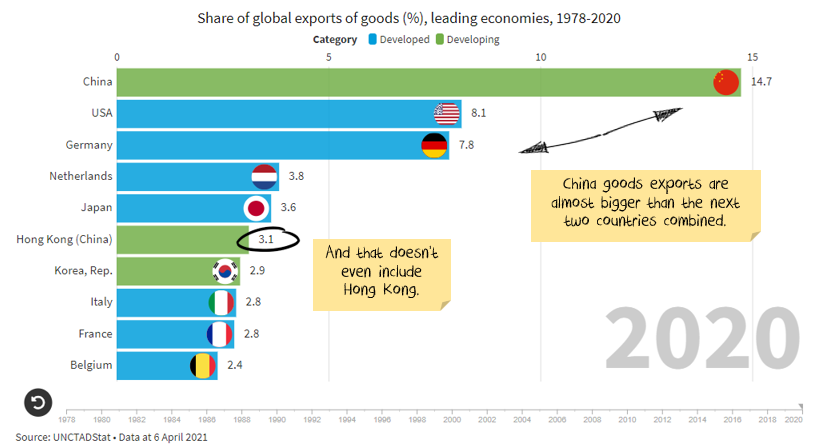
Partly because of the growth in exports. China now makes up almost 20% of goods exports. But this is not really new Chinese commodity demand – just displaced demand from other countries. And it is not the main source of demand.
Chinese apparent steel demand per capita is about double the average developed country when you strip this out.
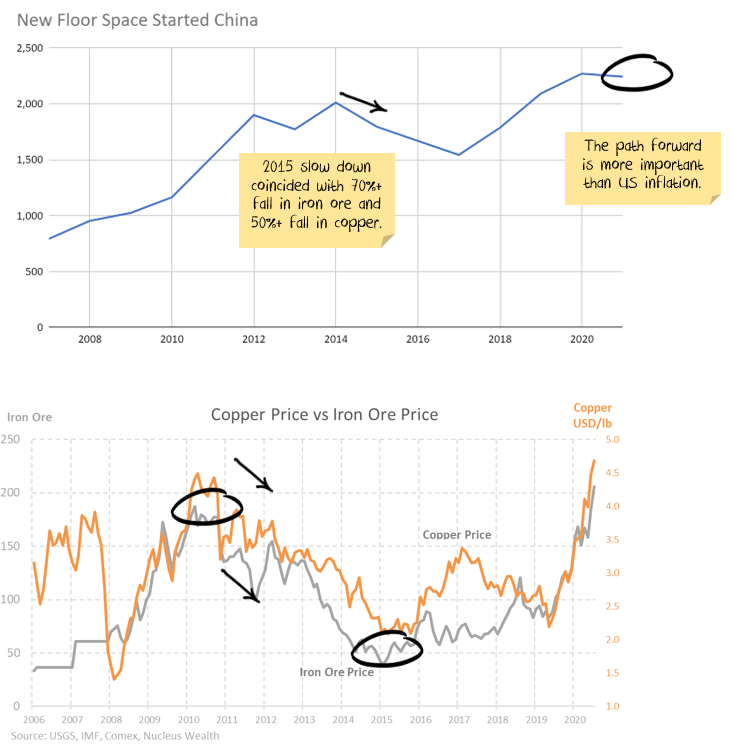
The real culprit is the Chinese construction sector:
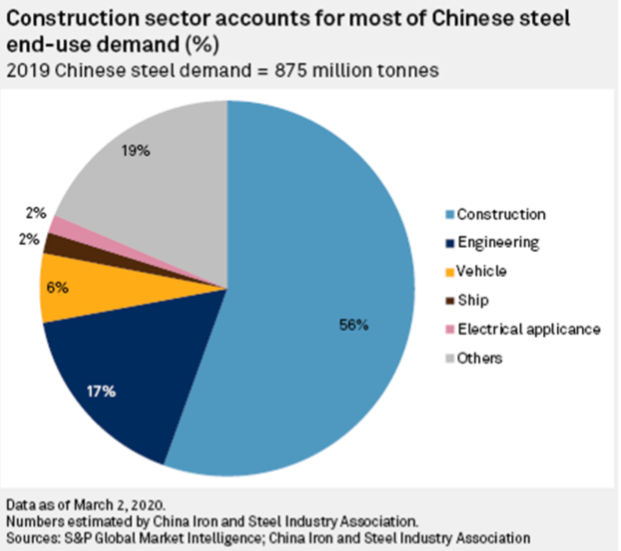
Highrise > Infrastructure
The big consumer of steel is high-rise buildings. Far more than other infrastructure – even railways are not that steel-intensive. Side note: bridges are steel-intensive, but there are just not that many built.
For example, CRU estimates $1T of US infrastructure will need about 6m tonnes of steel, 110t of copper per year. Both are less than 0.3% of the current world annual supply.
On the other hand, there will likely be less global demand for apartments and more for houses following COVID. Less demand for office highrise. Less demand for retail shopping centres. A small fall in demand for these buildings would provide all the steel and copper you need for a $1T US infrastructure package.
So, the completion of existing buildings is keeping demand strong right now. But is there a demand “air-pocket” to follow?
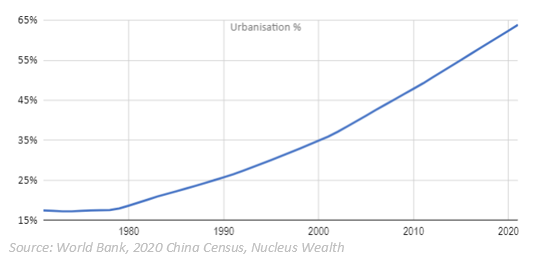
In China, urbanisation is the key.
China has moved an incredible number of people to cities in the last twenty years. In recent years it has been around 25m people per annum.
But the problem is demographic:
- China’s population growth is very low and likely to keep falling. It is expected to be negative before 2050.
- There are already almost 65% of people living in cities, up from 15% in the 1970s
Most countries top out in the low 80% urbanisation levels.
When will China slow its urbanisation?
There are 25m people per year moving to cities now. A smooth fall like we have seen in other developing nations would see 20m people or less moving to cities by 2025 and falling over time.
Or will it be a sudden stop? i.e. will China try to keep moving 25m people to cities until there are no more people left. The difference in the number of people is stark:
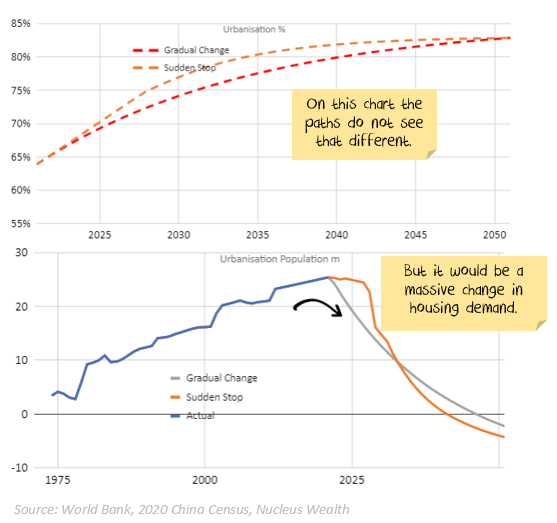
I don’t know which it will be. I’m guessing it will be the latter given China’s history – which means no short-term issues for prices. But the main point is that there is structural downside risk. i.e. the amount of commodities needed for building in China could halve in the next ten years. Which would be around 20% of the total worldwide demand for many commodities.
Empty Apartments
Estimates are that around 20% of Chinese apartments are unoccupied. This is about 50-60m apartments.
Chinese construction numbers are difficult to know how to assess. New starts have consistently been around double the completions. This means that the number of apartments “under construction” keeps growing, suggesting something wrong with the starts number. However, sales are about the same as starts. So maybe a Chinese habit of building an apartment but not installing the fixtures (painting, kitchens, electrical etc) is partly to blame? i.e. many investors own an unfinished apartment. When they rent it or move in, they can install the fixtures and not worry about depreciation in the meantime.
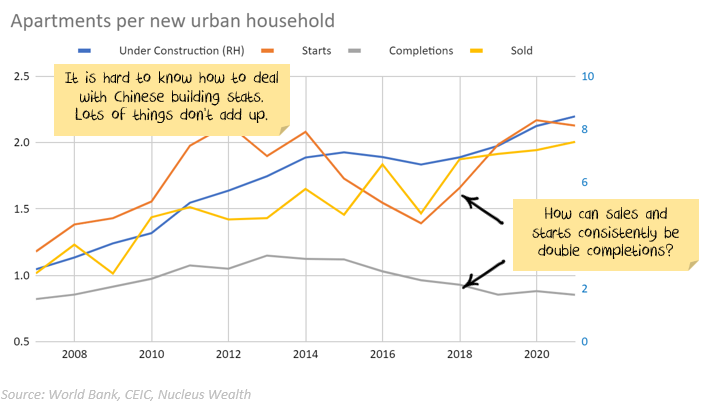
Additionally, apartment sizes are growing while people per household is shrinking. There are a lot of moving parts. What it does mean is:
- The number of apartments completed seems to be about the same as the number of people moving to cities.
- The number sold and started appears to be about double the number of people moving to cities.
- There is enough housing stock currently under construction to cater to about 9 more years of demand.
- There are enough empty apartments to cater to another 4-5 years of demand.
The net effect is that China can easily afford to slow down construction for years (decades?) without causing problems for its urbanisation plans.
Residential investment measured in dollars
Expressed another way, residential investment in China as a proportion of GDP is:
- double the level of Japan before its housing crash
- three times higher than the US before its housing crash.
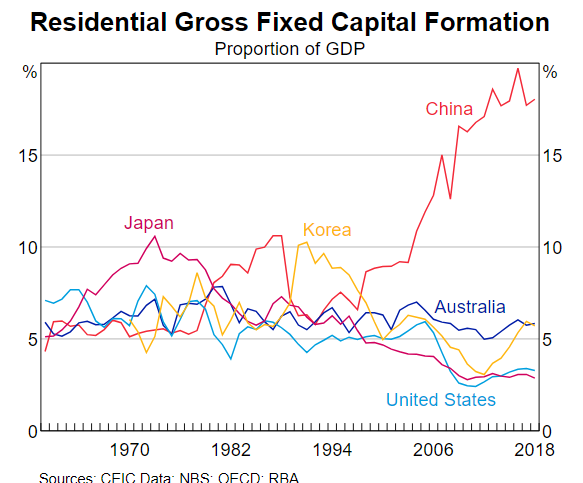
Again, on its own, this suggests a longer-term downside for commodity demand. But admittedly, there is no catalyst. The overspend could last for years.
One more thing to set the picture. Most of the recent spend has been driven by increased debt:
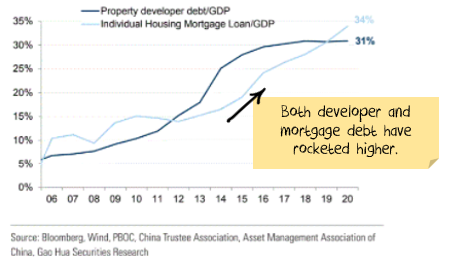
Is it just me, or is there now a short-term catalyst?
In 2020, China announced lending conditions on property developers called three red lines. These conditions are now being enforced. It is trying to slow the property lending market which has grown around 600% over the past decade.
The central bank also announced caps on property lending by commercial banks, effective Jan 1, 2021.
In Feb 2021, the Ministry of Natural Resources guided two dozen major cities to carry out land supply policy reform. This will likely help stabilize land and property prices.
China is trying to slow credit to the property sector.
So far, it is working! The credit impulse in China has hit zero. Any number of charts are out there showing that after the credit stops flowing:
- commodity prices fall
- producer price inflation falls
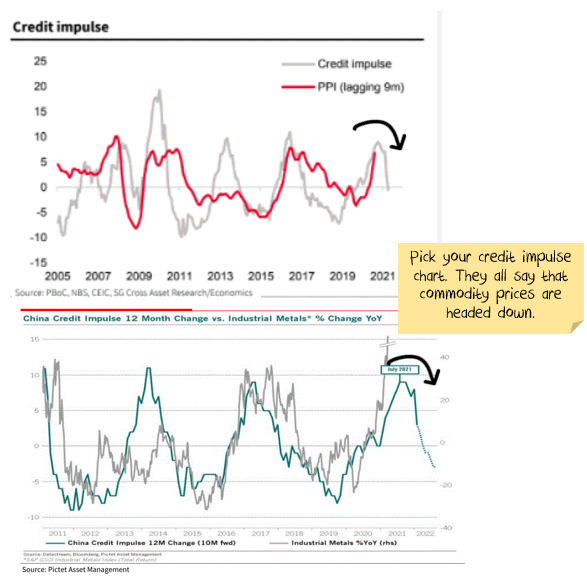
Note China will once increase credit again to the sector in the future. It is not a one-way ticket.
However, while the long-term trend will be down, it will be punctuated by bursts of credit to strengthen the Chinese economy when it weakens. We have just been through a credit burst which looks like it is finishing. So, the current trend is down.
There is a lag to both the change in credit and the effect of fewer new housing starts. Best guess is somewhere around 12 months. And credit started rolling over nine months ago.
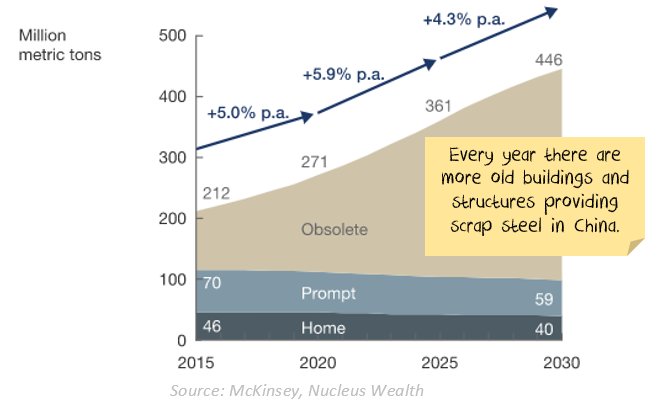
Chinese recycling rates
Recycling rates of metals are low in China due to a lack of existing supply. Moving a farmer to a city apartment creates significant steel and copper demand, but knocking down a rural hut doesn’t create much scrap. Over time China will be knocking down old apartments to put up new apartments – this does create scrap.
Additionally, China put restrictions on imports of all recycling materials in 2018 as a fight against pollution. This had the unintended consequence of increases the demand for raw copper and iron ore, which are much more energy-intensive. So, after making this mistake, China has now essentially reversed the policy. It reclassified scrap as a resource rather than waste and suspended import taxes created as part of the US trade war. Recycling in China will increase.
Estimates vary, but more metals every year are going to be recycled. Significantly more. McKinsey thinks by 2030 that China would need around 200m fewer tons of iron ore. About 13% of the global seaborne market.
Finally, recycling has also been affected by COVID. In particular, it significantly impacted eWaste recycling which is a major source of copper recycling.
China recently announced measures to help accelerate the transition to recycled metals. I note that accelerating the change:
- Reduces China’s reliance on imported metals. Particularly from Australia.
- Improves environmental outcomes.
- Uses less energy.
All are priorities for the Chinese leadership.
China’s impact through trade
China has routinely exported deflation, where China + Hong Kong now make up almost 20% of all goods exports:
Prices have been increasing from Chinese imports recently. However, inflation from Chinese imports has been lower than US inflation for almost every period in the last few decades. And last month was no exception:
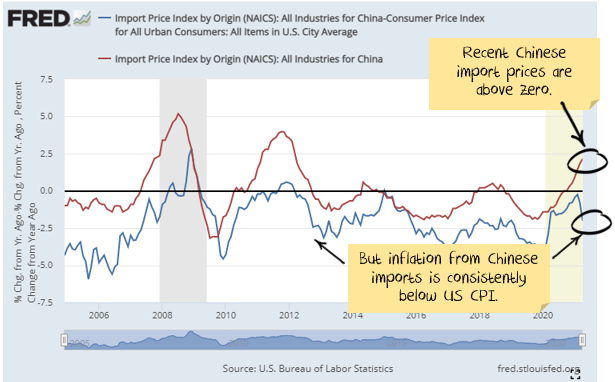
There is a second quandary for those who are concerned that the producer price index (which is increasing in China) is causing US consumer inflation. Why is the producer price index affecting American consumer inflation, but Chinese inflation is running below 1%?
This could change if supply chains continue to have problems. More on that in the next part of our series.
Long term commodity prices
You can get a range of different narratives from commodity prices.
Some argue that “it is different now” we have mined all of the easy stuff. I beg to differ. We have always mined all of the easy stuff:
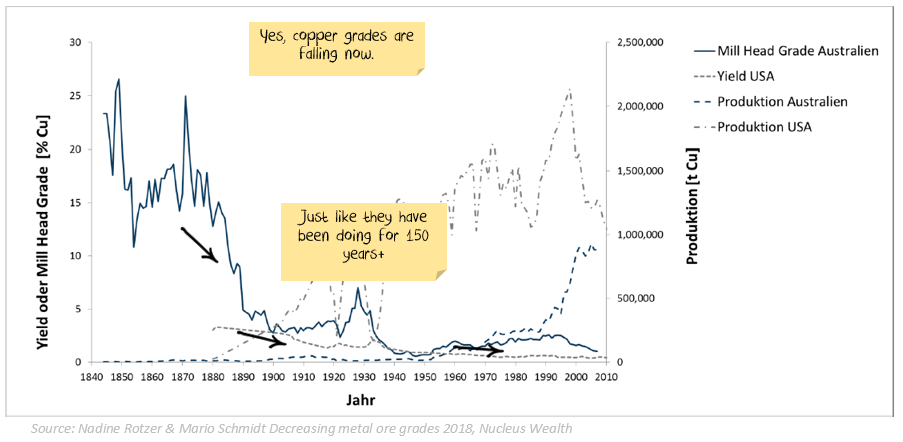
But that didn’t stop real prices from falling for most of the same time frame.
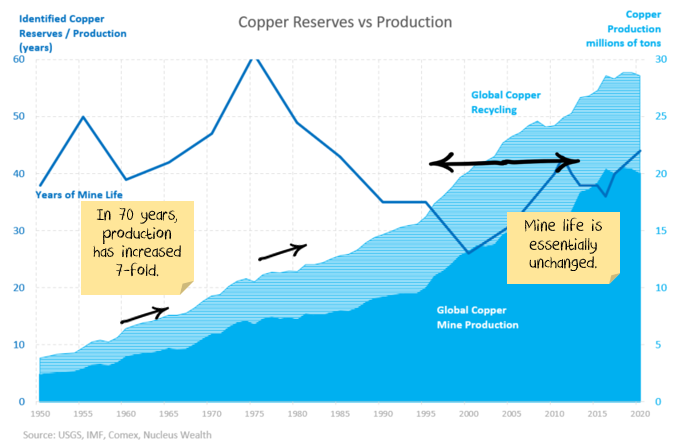
And even as the amount mined per annum increased exponentially, the years of future production has remained around 40 years due to new discoveries and more efficient mining:
My narrative is that commodity prices fell for 100 years in real terms up until the turn of the century as technological cost improvements trumped falling grades.
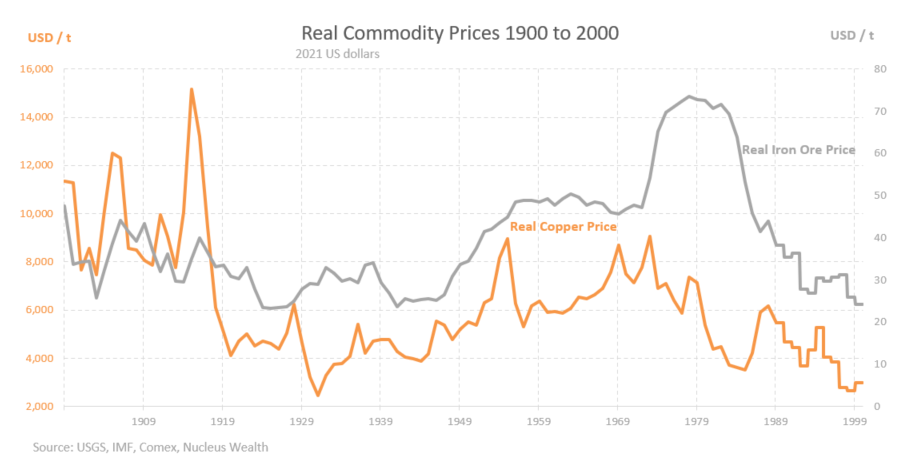
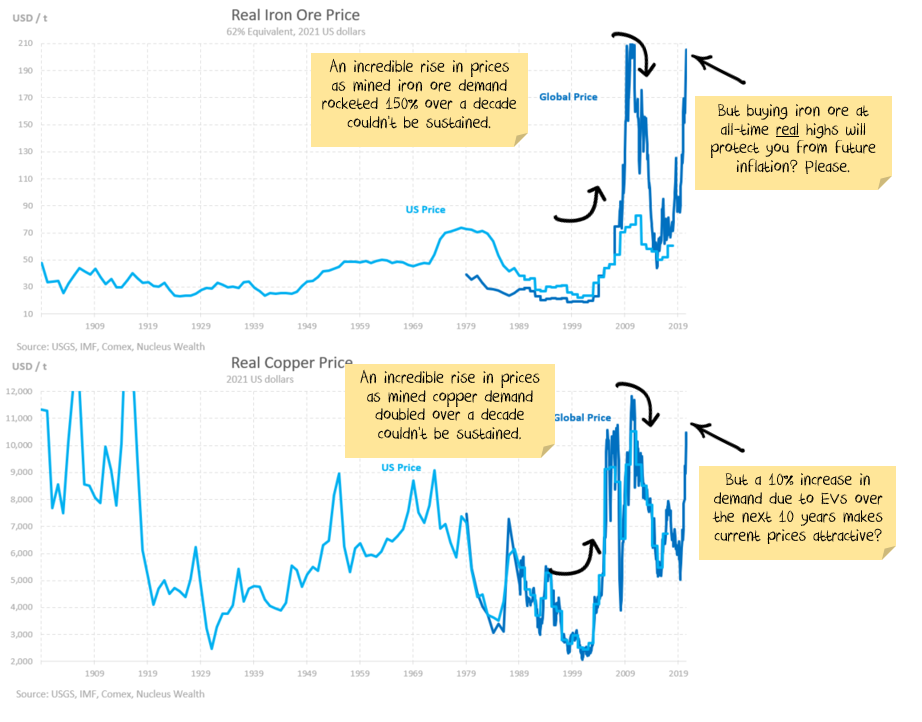
Then the rise of Chinese demand (in particular construction) saw prices spike to record levels on the back of a doubling and tripling of demand over a single decade.
But the market worked! The growth in volumes merely paused in 2015, and prices tumbled back to long-term averages or below.
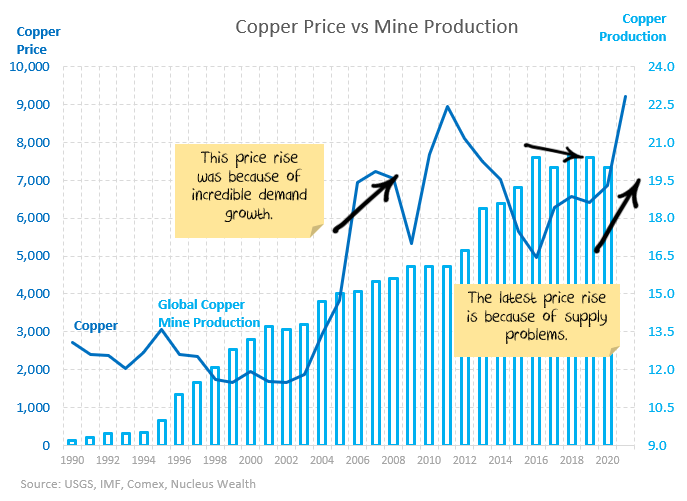
The latest spike in prices was not caused by a significant increase in demand. It has been about a mild demand increase running into supply problems.
Current prices do not look sustainable. Beware of those who tell you they are an inflation hedge:
The cavalry is coming. COVID hit mines will return to full production over the next few years. Chile (the largest copper mining country) is increasing its production 20%+. Vale (the largest iron ore miner) will return to 400mt of production from 300mt. Countless smaller operations are expanding or starting up, spurred on by higher metal prices.
What are the odds supply returns just as Chinese demand rolls over?
The most important investment questions
Others will have you believe that the most important investment question is whether commodities can protect you from inflation.
I have two different ones:
- What has changed (besides short term supply issues) that means the world can no longer produce commodities at lower and lower prices every year?
- How confident are you that Chinese construction demand won’t decline?
Yet:
- Many commodity prices are at supercycle levels.
- This has been mainly driven by supply shortages.
- Chinese construction is the most critical demand source in the world for commodities.
- Infrastructure spend in developed economies is less commodity-intensive than the market thinks.
- A range of different measures point to weakening Chinese demand. Quite possibly coming in the next few months.
Several investment banks are pitching the story that you need commodity exposure to protect you from rising inflation. A weak Chinese construction market will blow that story out of the water.
There are both long-term and short-term reasons for the construction cycle to be peaking in China and commodities are standing directly in its path.
—————————————-
Coming up next: the inventory rebuild/supply chain “pig in the python”. The price signals of today are creating the excess capacity of tomorrow.
To stay updated on the rest of this series, sign up to receive email updates from us via the form below:
————————————————-
Damien Klassen is Head of Investments at the Macrobusiness Fund, which is powered by Nucleus Wealth.
Follow @DamienKlassen on Twitter or Linked In
The information on this blog contains general information and does not take into account your personal objectives, financial situation or needs. Past performance is not an indication of future performance. Damien Klassen is an authorised representative of Nucleus Wealth Management, a Corporate Authorised Representative of Nucleus Advice Pty Ltd – AFSL 515796.