Via Credit Suisse comes some proof that the recent rally in risk has had nothing whatsoever to do with the scuttlebutt around US stimulus and everything to do with the collapse of Trump’s electoral prospects:
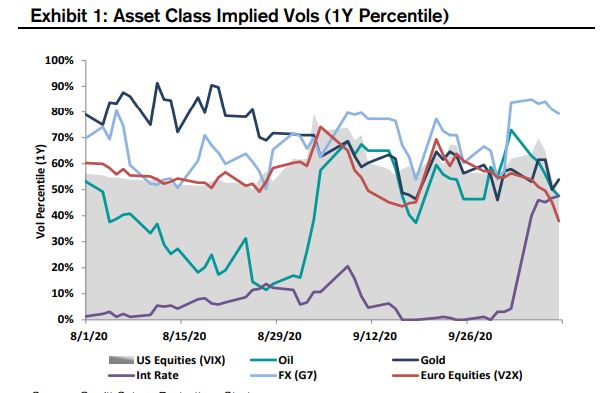
IMPLIED VOLS declined across asset classes last week with the notable exception of rates. US rate vol (CIRVE Index) saw its biggest weekly increase since March, up over 18nms, as a result of the US election risk premium now falling within the 1M tenor.
Not surprisingly, the increase was led by the long-end of the curve, with 1Mx30Y implied vol surging almost 30nms as the probability of a Democratic sweep increased and rate skew steepened to near 1-year high (see pg 18). In contrast, equity, oil, gold, and FX (G7) 1M implied vols all fell last week as the perceived election risk premium declined, with equity vol leading the way (VIX down 2.6 pts; V2X down 4.6 pts). See Exhibit 1.
EQUITY VOL: implied vols collapse; NKY led the decline in global index vol last week, with 1M ATM down almost 5 pts (see pg 8). SPX vols fell by a more modest 2 pts wk/wk, with 1M now trading at 21.1% while realizing 19.6%. Most of the flow have been concentrated on selling index vol, whether through VIX downside puts/put spreads (VIX put volumes outpacing calls by 1.6x over past week), S&P puts with vol knock-outs, or the usual over/underwriting activity. In RV space, the most persistent dislocation remains the richness of Tech vol, with QQQ-SPX vol
spread still screening ~99th percentile high (over past 10 years).
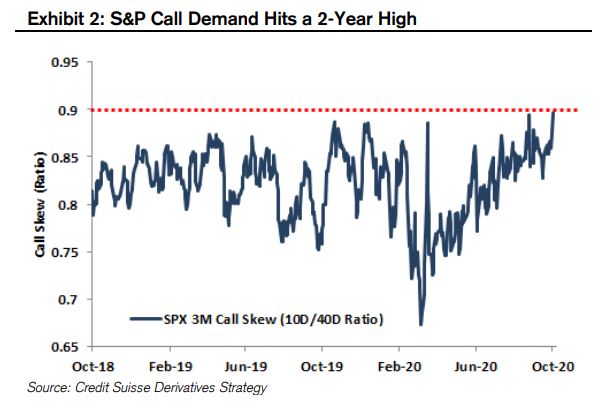
SKEW flattens further to 7-month low: Demand for upside calls picked up last week with the rally, with S&P call skew (3M 10D/40D ratio) surging to a 2-year high (see Exhibit 2). This helped drive skew down to its lowest level since Feb, with 3M 25D skew now in the 37th percentile low over the past year.
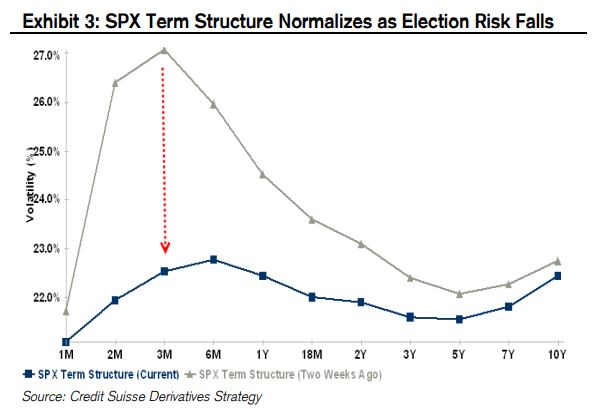
TERM STRUCTURE normalizes as election risk falls: S&P implied vols fell across maturities last week, with the most pronounced declines coming around the election tenors. The Dec kink in the term structure (where Dec was the highest point on the curve) disappeared as the risk of contested election fell with Biden’s polling lead widening to double digits. S&P 1M vol, which captures the Nov election, is now the lowest point on the curve (in sharp contrast with the rate vol term structure where 1M is the highest point). The S&P term structure is now upward sloping for the front 6M tenors with Mar’21 vol screening as the highest point on the curve. See Exhibit 3.
EQUITY CORRELATIONS fall on earnings: Implied correlation (1M) fell across sectors last week (led by Tech) in anticipation of earnings, with S&P 1M implied corr down 3.4 pts to 33.5% (see pg 13 for sector breakdown). SPX 6M implied corr fell even more notably, down almost 10 pts to 40%.
In other words, the equity market has told Trump ‘see ya and wouldn’t want to be ya’.
David Llewellyn-Smith is Chief Strategist at the MB Fund and MB Super. David is the founding publisher and editor of MacroBusiness and was the founding publisher and global economy editor of The Diplomat, the Asia Pacific’s leading geo-politics and economics portal.
He is also a former gold trader and economic commentator at The Sydney Morning Herald, The Age, the ABC and Business Spectator. He is the co-author of The Great Crash of 2008 with Ross Garnaut and was the editor of the second Garnaut Climate Change Review.