
Well, a big week for headlines about the employment impacts of COVID19 and Australian workplaces seems to have our media operating under the perception that the bulk of the impact is being worn by women, and from there that they are being shortchanged in the budget responses. A quick google of the headlines turned up the following….
- There are thousands of very credible women across Australia fighting for equal rights (Guardian)
- ‘Blue budget for pink recession’: Women ‘left out’ of budget focused on youth and male industries (SMH)
- Women miss out in budget despite ‘pink recession’ (AFR)
- Women bear biggest job losses from coronavirus, latest ABS data shows (ABC)
- Coronavirus sparked an economic recession that takes more jobs from women than men (ABC)
To be honest I hadn’t actually thought that much about it, but assumed it to be largely true. A generation ago I had traipsed across a few workplaces – both private and public – and seen as much myself. But knowing that there was a government agency compiling statistical data on the Gender balance of larger Australian employers, the Workplace Gender Equality Agency, it seemed some data might help shed light on the extent of the phenomena.
The Banks were the first cab off the rank. Most of the figures came from the 2019 reports, and they showed a slight female skew in gender profile.
| Banks | Female % | Male % | Employee Numbers |
| NAB | 52.1% | 47.9% | 28483 |
| ANZ | 53.7% | 46.3% | 20247 |
| CBA | 57.8% | 42.2% | 32845 |
| WBC | 57.2% | 42.8% | 29786 |
Then came the idea of sussing out the retailers.
| Retail | Female % | Male % | Employee Numbers |
| Coles Supermarkets | 51.3% | 48.7% | 115843 |
| Woolworths Group Limited | 54.5% | 45.5% | 171060 |
| Aldi | 43.2% | 56.8% | 12526 |
| JB Hi-Fi Group | 40.2% | 59.8% | 8381 |
| Metcash | 31.5% | 68.5% | 5912 |
Then the Telcos
| Telco | Female % | Male % | Employee Numbers |
| Telstra | 29.2% | 70.8% | 27279 |
| TPG | 21% | 79% | 1613 |
| Optus Administration | 30.1% | 69.9% | 6179 |
Accounting and Audit
| Accounting/Audit | Female % | Male % | Employee Numbers |
| Ernst & Young Services Trust | 50.9% | 49.1% | 7528 |
| KPMG AUSTRALIAN SERVICE TRUST | 49% | 51% | 7361 |
| PricewaterhouseCoopers Services Trust | 53.3% | 46.7% | 7803 |
| Deloitte Services Trust | 48.4% | 51.6% | 9017 |
Then a glimpse at Media
| Media | Female % | Male % | Employee Numbers |
| Nine Entertainment | 44.1% | 55.9% | 4621 |
| News Limited | 49.7% | 50.3% | 6312 |
| Network Ten | 48% | 52% | 1931 |
| ABC | 52.9% | 47% | 4649 |
| Southern Cross Austereo Services | 51.6% | 48.4% | 2340 |
Then a smattering of others to get a glimpse of the dynamics
| Selected Other | Female % | Male % | Employee Numbers |
| McDonald’s Australia | 51.4% | 48.6% | 18644 |
| Competitive Foods Australia | 49.7% | 50.3% | 16403 |
| Toll | 21.3% | 78.7% | 14704 |
| Linfox | 18.2% | 81.8% | 5704 |
| Powercor | 21.1% | 78.9% | 2034 |
| AGL | 32.9% | 67.1% | 3752 |
| Ashurst Australia | 67.1% | 32.9% | 902 |
| Corrs Chambers Westgarth | 69% | 31% | 959 |
Then of course it was obvious that it was the University sector which was taking a belting. Not all are in the database, but enough were to get a general idea of the size of the issue, and to note that Australia’s Universities tend to have more female than male members of staff.
| Selected Universities | Female % | Male % | Employee Numbers |
| Griffith University | 61.9% | 38.1% | 8003 |
| Murdoch University | 64% | 36% | 3214 |
| James Cook University | 63.3% | 36.7% | 3024 |
| University of Adelaide | 54.8% | 45.2% | 4350 |
| Flinders University | 67.4% | 32.6% | 3397 |
| Curtin University | 60.4% | 39.6% | 7476 |
| Australian National University | 52.2% | 47.8% | 5909 |
| Macquarie University | 58.3% | 41.7% | 5184 |
| University of NSW | 49.6% | 50.4% | 13854 |
| University of Melbourne | 58.3% | 41.7% | 14943 |
| Monash University | 57.1% | 42.9% | 15297 |
| Deakin University | 61.2% | 38.8% | 10612 |
| Edith Cowan University | 66.8% | 33.2% | 4648 |
| Charles Darwin University | 59.2% | 40.8% | 1626 |
From there it was worth thinking about the various State and Commonwealth Public Sectors. They wont (yet) be getting hammered by an economic downturn, but they will have generally the best superannuation outcomes, and usually greater employment surety.
Let us start with the Commonwealth – the APS. It provides good data each year in the State of the Service Reports, starting with State of the Service Report 2018-19 (APSC) which provides handy classification and gender data, which can easily be matched up against relative remuneration guidance (each APS Agency will have its own workplace agreement which determines specific remuneration outcomes). Note:- given the skill with which the APSC has made the data almost indecipherable to the lay reader I have taken the liberty of compiling a chart in excel from their data (with references underneath) accompanied by both salary and remuneration data from the same report so that those outside the public sector can get a sense of how their employment world stacks up alongside.
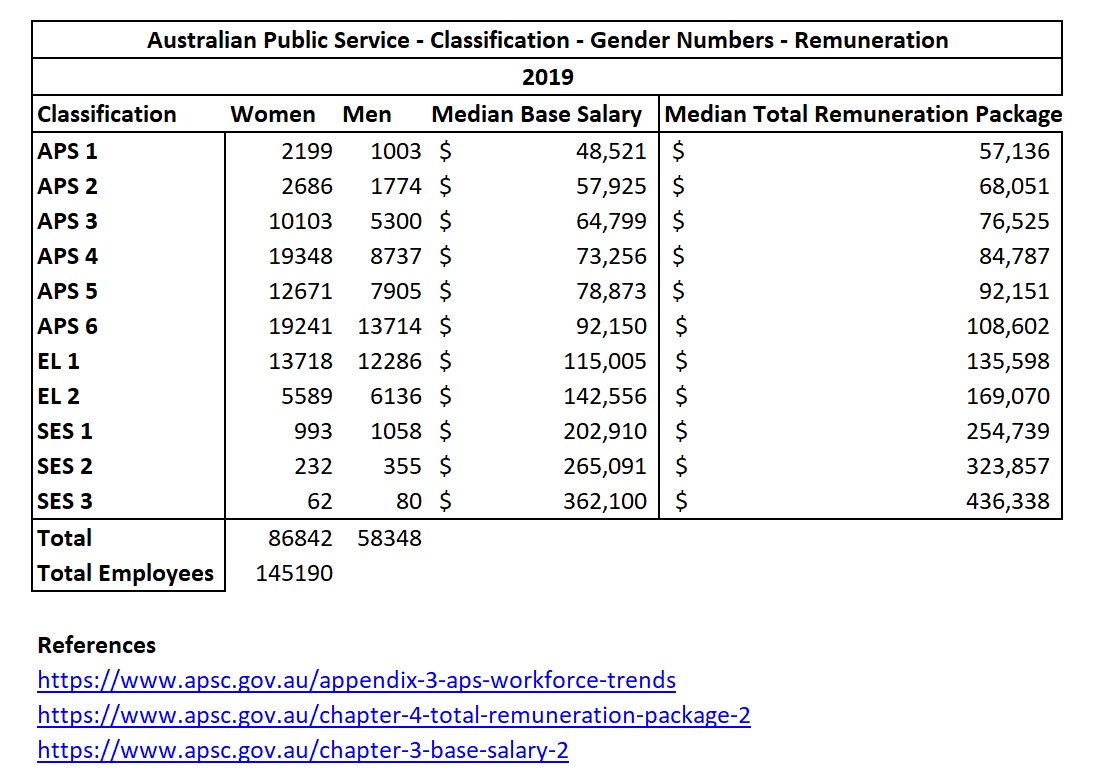
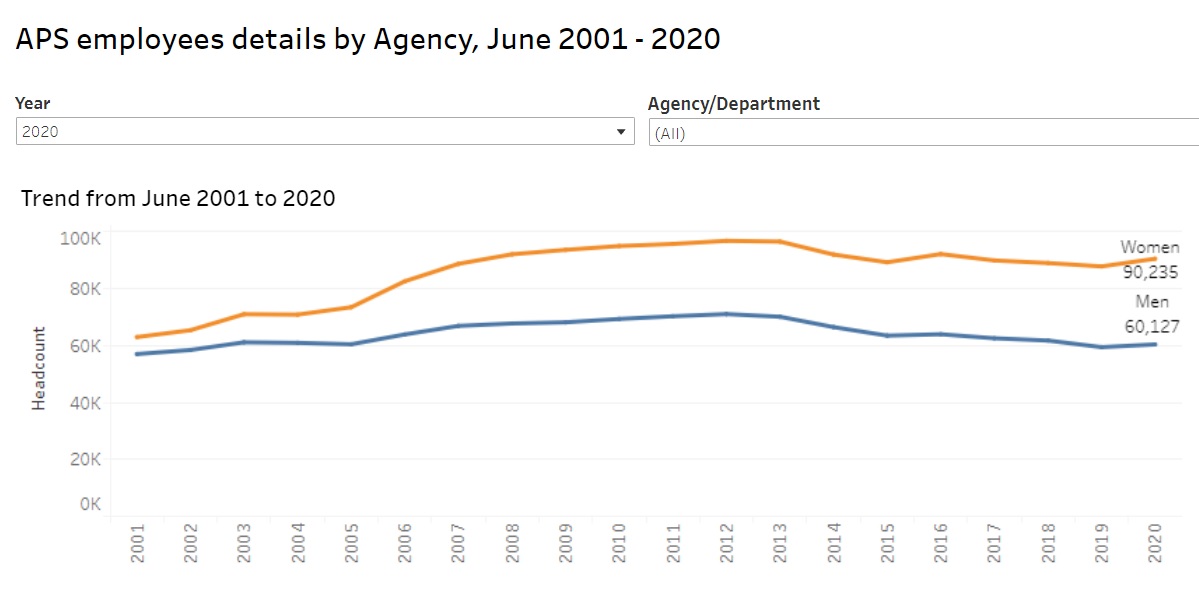
And that gap has opened up vastly over the last 20 years.
That tells us that above SES 1 (Senior Executive Service, or Assistant Secretary – bringing home more than $200k a pop) there are 1493 men outnumbering 1287 women. But the data is also suggesting that anywhere below that, amidst some of the safest and best superannuated positions in Australia, up to a remuneration level double the median income level for the Australian population as a whole – women outnumber men by up to 2 to 1. Suffice it to say women aren’t being hammered here, and if anyone is thinking that a load of fatcats are being pampered by serried ranks of secretaries or administrative staff it appears that conversely there are legions of aged ladies making up the upper echelons awaiting their chance to be the Humphrey Appleby of the future.
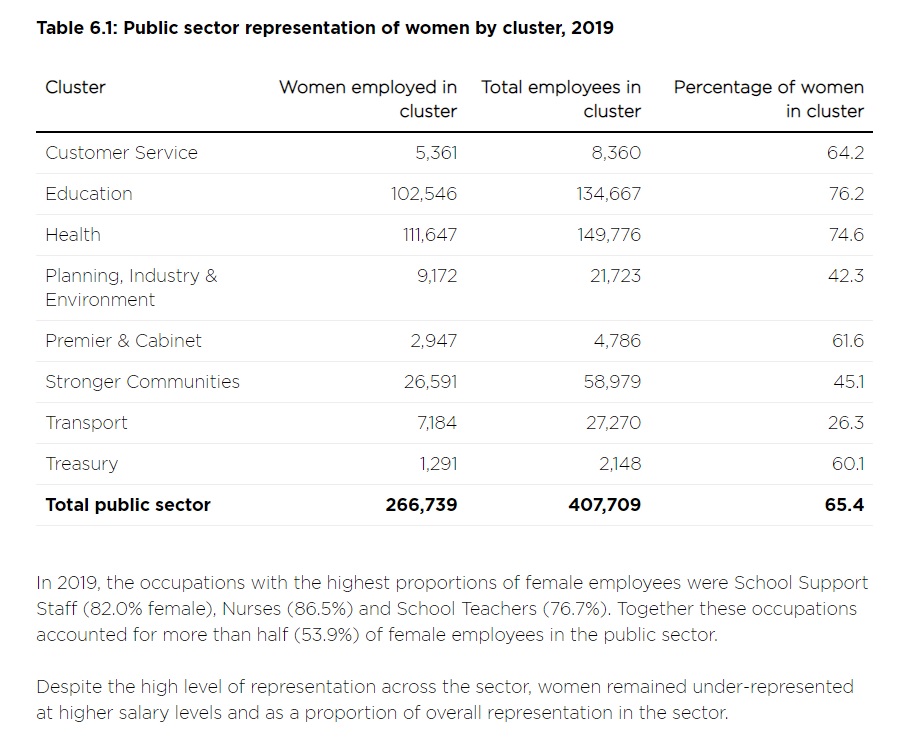
In the NSW public sector the Workforce Profile Report 2019 is telling us that much the same gender profile is in place. It is about 2 women for every guy.
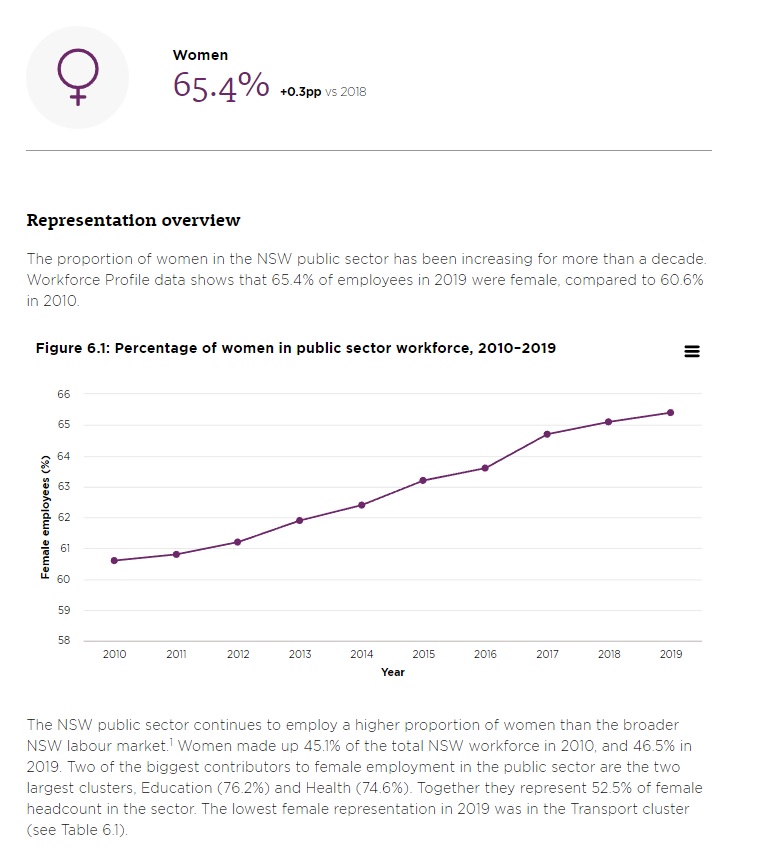
Some additional data tells us that outside Transport Employees, the Gender profile is either broadly in balance or skewed to women, and that for Nurses, Teachers or School Support Staff it runs at 3 out of 4.
So that tells us that in NSW there are far more women hunkered down for the downturn than there are men.
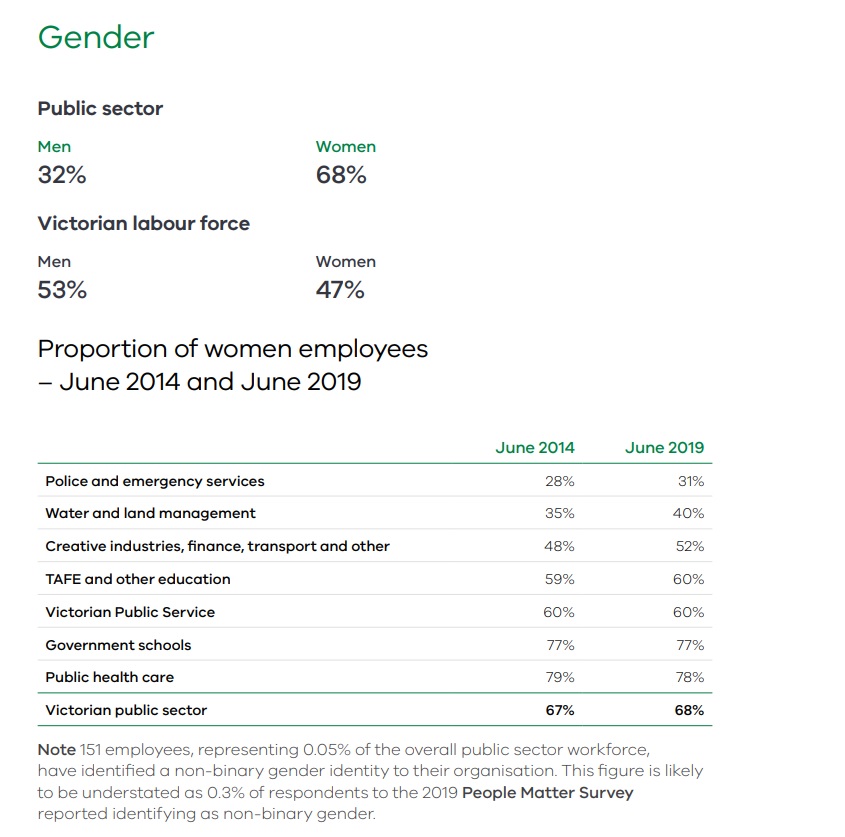
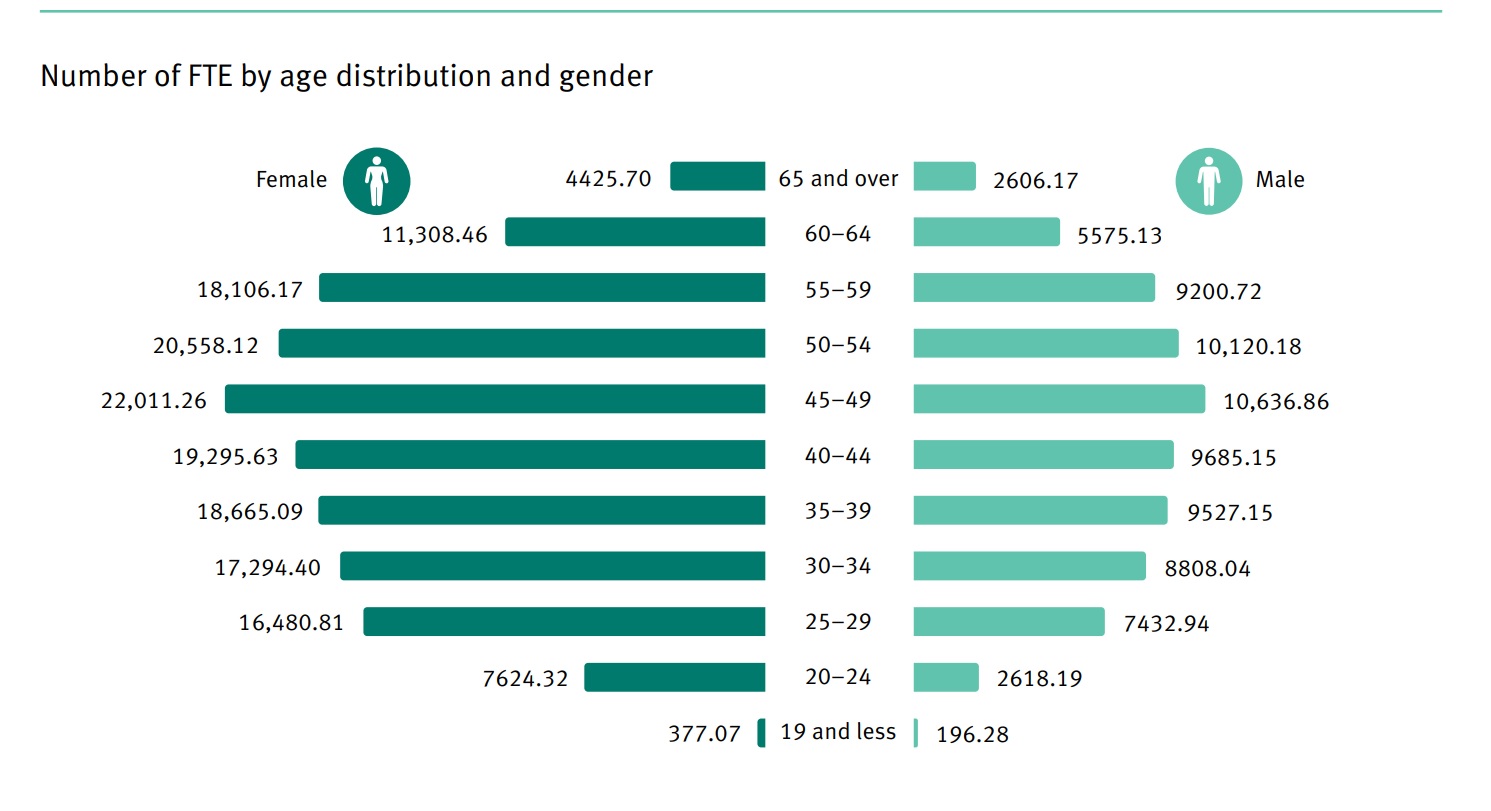
In Victoria The State of the Public Sector in Victoria 2018–2019 (P35) has the same story playing out south of the Murray.
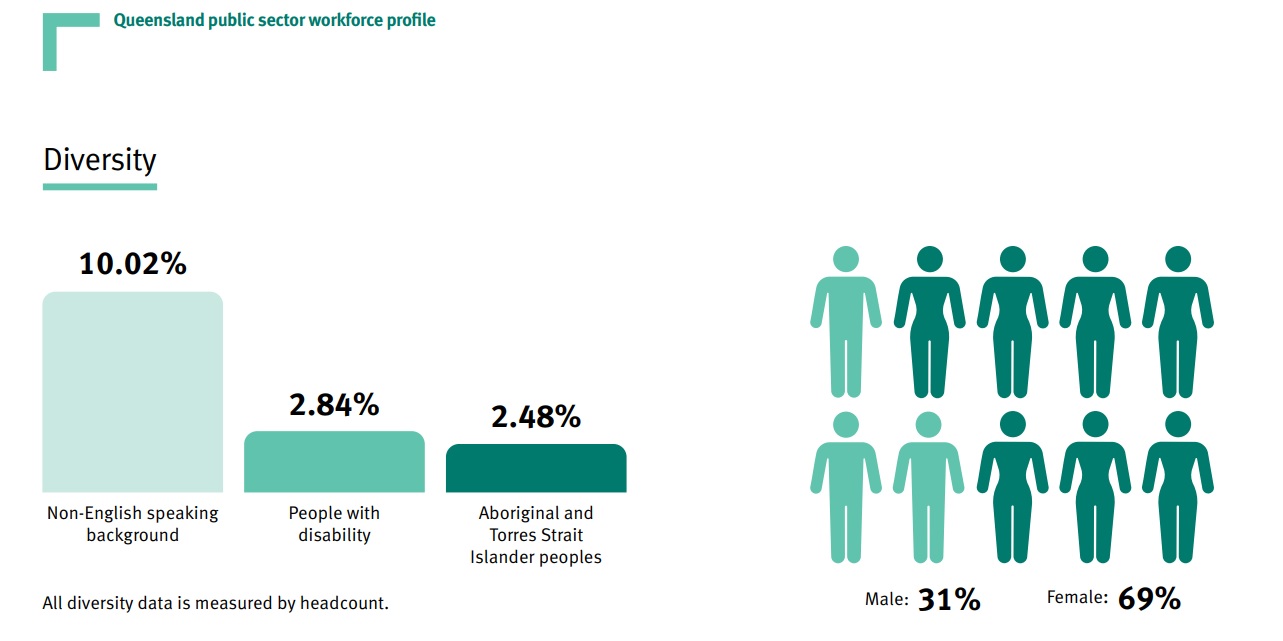
And Queensland replicates the aged and female skew with some 2020 data in March Biannual Workforce Profile (PDF, 793 KB) (QLD).
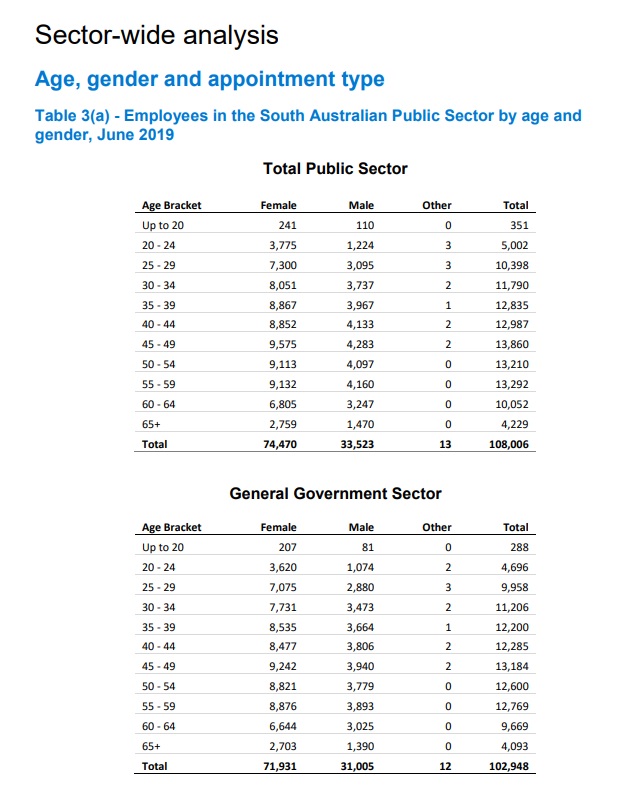
As does South Australia with the 2018-19 WORKFORCE INFORMATION REPORT (P16)
Over in Western Australia the State of the Western Australian Government Sector Workforce Statistical Bulletins (State of the Western Australian Government Sector Workforce 2018/19 Statistical Bulletin) doesnt produce glossy brochures but does have handy excel data which reveals.

Down in Tassie the State Service Workforce Report No 1 of 2020 (TAS) has the State public sector running at more than 70% female.
Now the above doesnt include Rio Tinto and BHP, who will presumably be very male heavy in their workplace profile and which data couldnt easily be found, and for sure many of the female employees in particularly the State Sectors – nursing and teaching in particular – will be in professions where there are simply more women than men.
But far from suggesting that women are bearing the brunt of the downturn it suggests that particularly in the public sectors, there are far more women bunkered down to ride out the economic impact of the COVID19 in relatively safe employment than there are men.
None of the above is to suggest that there wont be plenty of sisters, mothers, daughters, girlfriends and wives working in small business who certainly will be worrying about their employment and who almost certainly will be on shaky superannuation ground. Where females in employment would seem to be under significant potential threat is in the University sector, which once had good superannuation arrangements for employees (and presumably doesnt any more). Another area of large scale female employment would be the Local Government sector (anyone know where the stats are?)
Might be worth thinking about next time you see a headline proclaiming ‘pink recession’.