

By Chris Becker
Tops might be in across share markets as Wall Street leaped to a new before a sharp late reversal sent the risk complex reeling, taking precious metals with it as USD came back to strength. Stronger PPI data saw bond yields rise while continued stalemates over US fiscal measures and falls in commodity prices swamped investor sentiment, with the NASDAQ off by nearly 2%
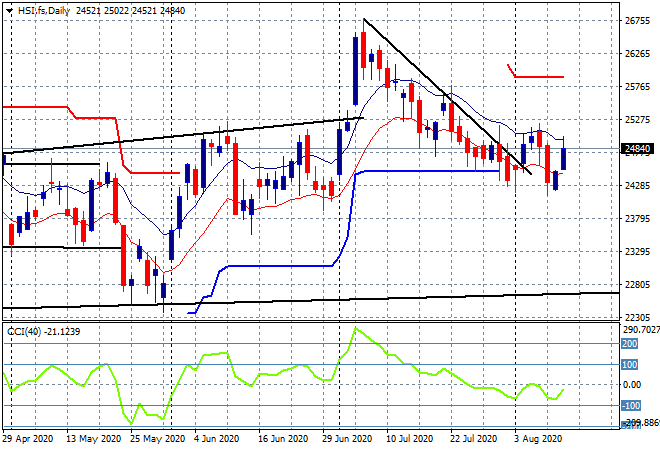
Looking at share markets in Asia from yesterday first where in mainland China, the Shanghai Composite was positive before the lunch break, but broke down towards the close, off by 1% to 3340 points, while in Hong Kong the Hang Seng Index swung wildly higher, launching over 2% to almost cross above 25000 points again. A solid move but still keeps price anchored near previous trailing daily ATR support as daily momentum remains in the negative zone. Note how price action still fails to breach the high moving average, so no new trend yet:
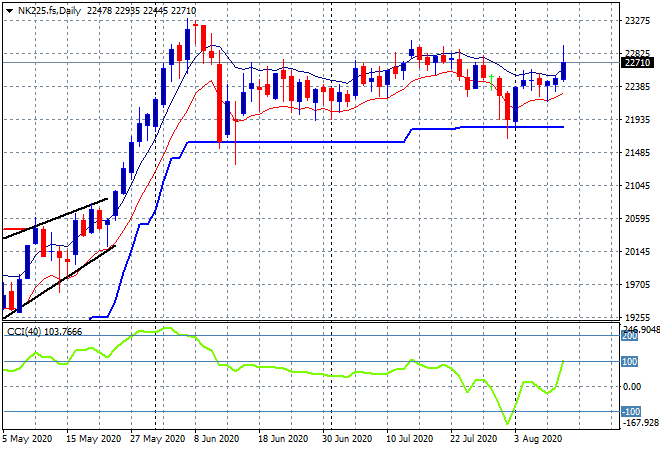
Japanese stock markets reopened from their long weekend break with the Nikkei 225 closing 1.9% higher at 22750 points. While a good breakout, futures are indicating a pullback in line with the hestitation on Wall Street, with price still unable to beat the July highs above the 23000 point level. Probability still points to a bullish case however:
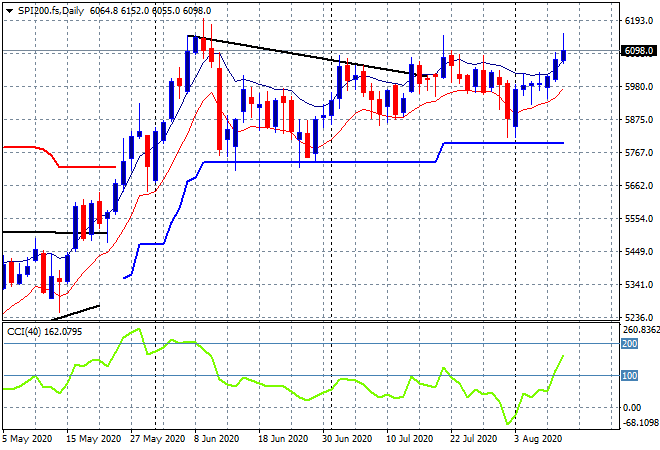
The ASX200 eventually finished 0.5% higher at 6135 points matching its July high and looking solid on the daily chart. SPI futures are suggesting a return to the 6100 point level so it will be interesting how the market – particularly gold miners and other commodity stocks – reacts to the moves on Wall Street. I’m still watching for a decent follow through here:
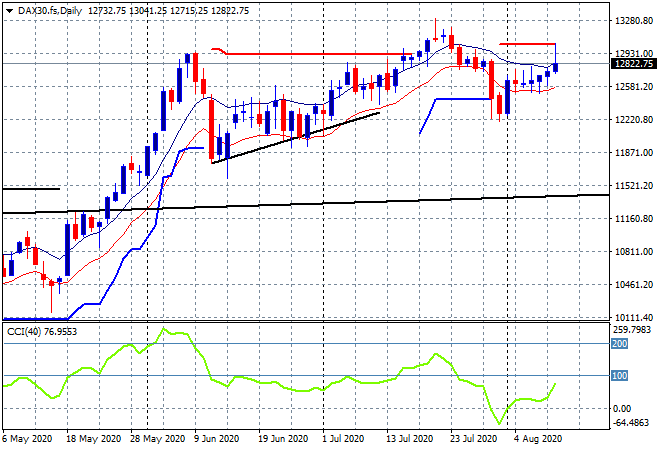
European markets finally found some direction after a modest start to the week, with broad gains as Euro fell back with the German DAX launching 2% to 12946 points before retracing significantly in post close futures. The daily chart remains confused and while momentum is nominally positive, price action refuses to gain proper headway here with significant resistance building at the 13000 point level from June through to now:
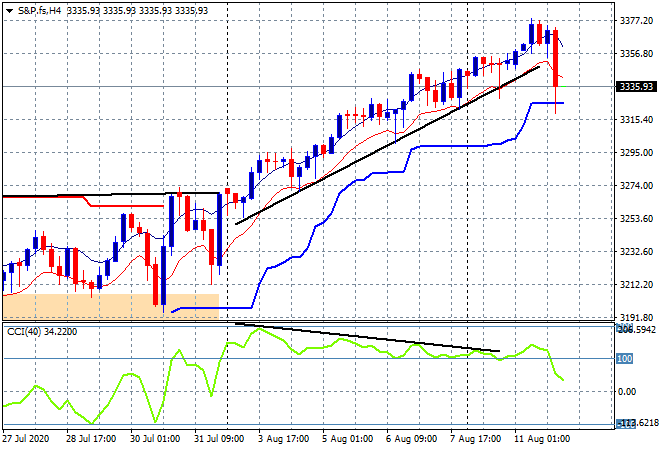
Wall Street had a significant session overnight with the S&P500 putting in a new monthly high before selling off sharply at the close, finishing 0.8% lower at 3333 points. The four hourly chart of S&P futures was showing some signs of slowing down and now shows a proper break of the week long trendline and action below the low moving average but not yet trailing ATR support at 3320 or so. Watch that level closely tonight for signs of a proper breakdown:
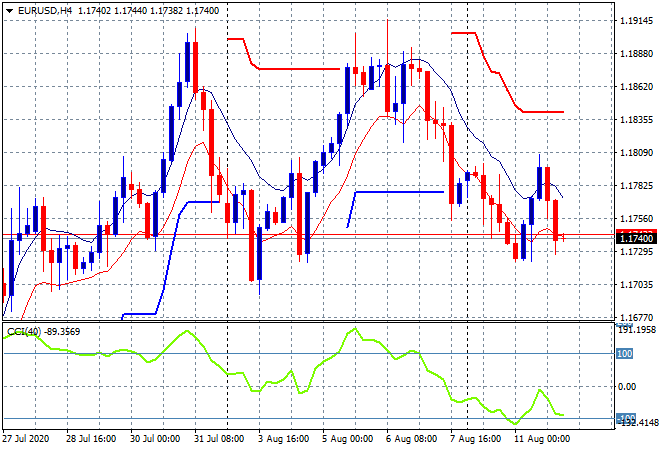
Currency markets remain in strong USD mode in the main, with Euro having a failed breakout up to but not above the 1.18 handle before reverting back to its intraweek low this morning. I still contend that the next level below on the four hourly chart to watch this week is support at the 1.17 zone as momentum remains negative in the short term, but tonights US CPI print could be a catalyst:
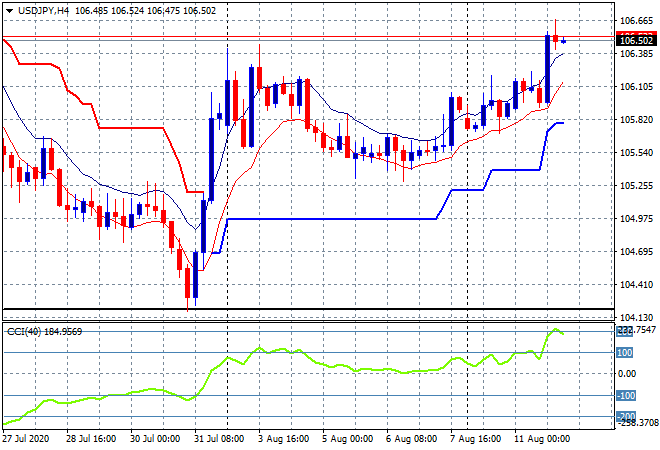
The USDJPY pair was trying to build some positive momentum yesterday and the cup pattern on the four hourly chart has come to fruition, with a solid to breakout above the 106 handle after the recent of Japanese traders and more bullish USD overall overnight. This has gone a little overbought and could retrace during the Asian session but the next level above is the mid-July anchor point at 107.40:
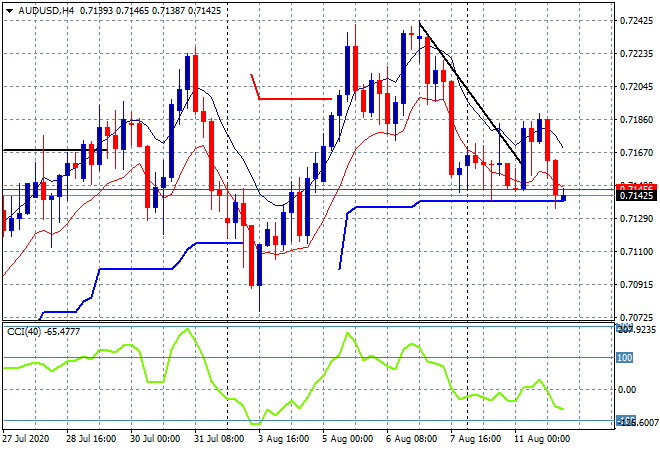
The Australian dollar remains the weakest against USD, with the unsure start to the trading week translating into a confused session overnight with some bullishness immediately sold off to be back at a weekly low at the 71.40 level. I’ve been saying for awhile that support must hold here or we’re likely to see a reversion to the recent lows at the 71 handle proper:
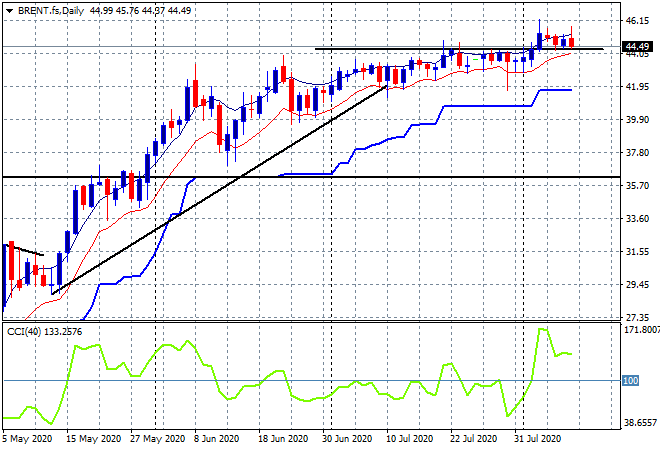
Oil futures remain retreated again with the Brent marker losing more than 1% to remain well below the $45USD per barrel level as the previous breakout remains a fizzer. The daily chart is still showing a sideways bullish trend but alongside WTI, the lack of any new daily highs and lots of intrasession selling near those highs is suggesting a breakdown is imminent:
Gold was sold off overnight….cough
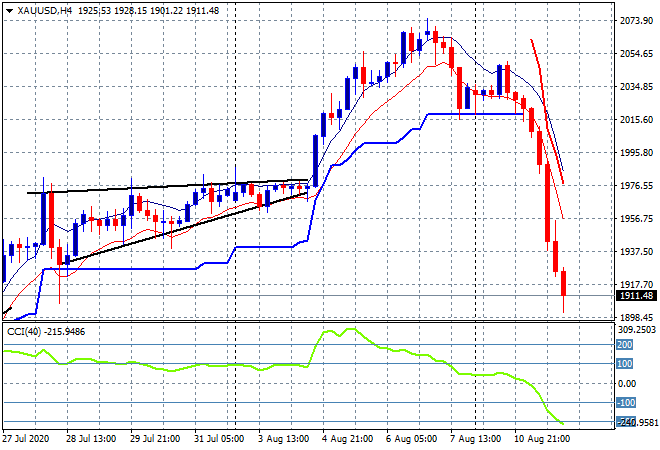
I mean that’s a correction if I ever saw one! Go read my gold/silver post here for more on the precious metal complex.
Glossary of Acronyms and Technical Analysis Terms:
ATR: Average True Range – measures the degree of price volatility averaged over a time period
ATR Support/Resistance: a ratcheting mechanism that follows price below/above a trend, that if breached shows above average volatility
CCI: Commodity Channel Index: a momentum reading that calculates current price away from the statistical mean or “typical” price to indicate overbought (far above the mean) or oversold (far below the mean)
Low/High Moving Average: rolling mean of prices in this case, the low and high for the day/hour which creates a band around the actual price movement
FOMC: Federal Open Market Committee, monthly meeting of Federal Reserve regarding monetary policy (setting interest rates)
BOJ/Abenomics: Bank of Japan, economic policy/direction enacted by PM Shinzo Abe
DOE: US Department of Energy
Uncle Point: or stop loss point, a level at which you’ve clearly been wrong on your position, so cry uncle and get out!