Welcome to the world of excess liquidity. World excess liquidity is defined as the the ratio of money supply to nominal output, aggregated across economies. It is a widely used concept that gets toward the idea of scarcity—too much money chasing too few goods. Monetarists, who view the world through the lens of the “equation of exchange”, identify it as the inverse of the velocity of money, or “Marshallian K”. And in a world where interest rates are at or below the zero “lower bound”, central banks are expanding their balance sheets, and policy responsibilities are being increasingly deferred to fiscal policy makers, quantities are becoming more relevant than prices—money supply is starting to matter more than rates in gauging financial conditions. We use narrow money (M1), or highly liquid deposits to proxy money supply, as it is the most consistent way to measure money supply across economies. We use industrial production (IP) to proxy real output, and convert this into a nominal output number by multiplying by the consumer price index (CPI). Therefore, our measure of world excess liquidity is world M1 divided by the product of world IP and CPI.
A great misnomer: excess liquidity is not about liquidity and is not necessarily excessive. Technically speaking, world excess liquidity is not really about liquidity. After all, liquidity really refers to the reserves banks use to settle transactions with one another, or the ability to convert certain types of securities into instant cash via markets. It does not strictly refer to deposits, or their liquidity. In principle, loans and government deficit spending create deposits, as do some forms of central bank intervention which directly inject cash into the public domain rather than into the banks. With this in mind, our measure of world excess liquidity is really a proxy for world debt-to-GDP, adjusted for central bank behaviour. And given that money created in the system is always held by someone, there is no such thing as “cash on the sidelines”. Even when money is used to purchase something, the buyer gets the purchase item, while the seller gets the cash. Cash does not disappear into the ether unless debt is extinguished. Nor can one say that there is too much money relative to debt in the system, because debt is money and money is debt. Finally, there is nothing out of the ordinary in the fact that world excess liquidity trends higher through time. If money is debt, and debt is a stock, while nominal output is a flow, it makes sense that the ratio of the stock to the flow should trend through time. Indeed, because debt is often used to purchase existing assets rather than new goods in the first instance, credit creation tends to fuel asset price inflation ahead of CPI inflation, and the rise in real asset prices tends to drive world excess liquidity higher. What matters is not so much the absolute level of excess liquidity, but rather, where it sits relative to trend. Therefore, whether or not there is truly excess liquidity—too much money or credit chasing too few goods—is an empirical question, dependent on how we estimate the trend, and deviation from trend in real time. Effectively, de-trending world excess liquidity is a way of controlling for the fact that agents in the economy get used to certain levels of credit availablity and asset prices in the economy, as well as certain patterns of behaviour from policy makers, before these factors finally spill over into goods spending.
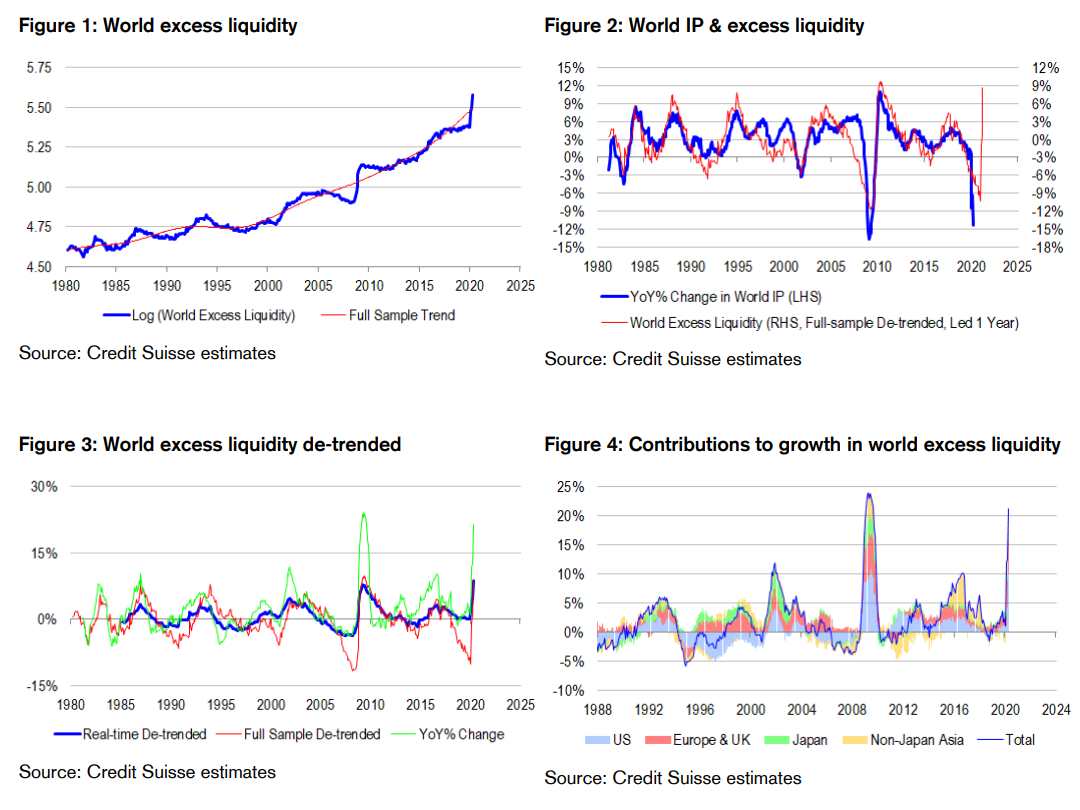
The best ever leading indicator of the cycle… if only we could measure it in real time. When we run a linear filter through world excess liquidity, we find that the de-trended series is actually an extremely powerful and accurate year-ahead leading indicator of world IP growth. When the money supply to nominal output ratio reaches critically high (low) levels, we tend to see spending and output growth rates accelerate (slow) in the period ahead, consistent with the spillover effects described earlier. Indeed, we believe that de-trended world excess liquidity is the single most powerful leading indicator of the cycle available. And right now, it points to such high levels of excess liquidity in the system, that we should expect world IP growth to rebound extremely sharply at a double-digit pace in 2021. The only problem however, is that predictive power is somewhat illusory because of over-fitting. Linear filters are like centred moving averages. They require complete historical and future data to work well—perfect hindsight and perfect foresight. In the absence of either, filters encounter “end point” estimation problems, because they are forced to change their behaviour to make the best use of the limited data available as the future or past “runs out” in the sample. And as the rather extensive output gap literature has shown us, these end point problems can cause significant real-time estimation errors. Therefore, we need to be extremely cautious about interpreting the de-trended level of world excess liquidity at any given point in time, and somehow allow for incorrect readings. Move over output gap literature. There is a new kid in town that requires even more of the same attention from investors and not just central bankers!
A “glass half full” real-time indicator… We estimate the real-time, de-trended level of world excess liquidity at every point in time over the past few decades, effectively embedding “end point” estimation errors into the series. When we compare the real-time series to the full-sample series, we find that they do tend to move together—but they also experience systematic divergences. Typically our real-time measure fails to reach the depths of its full-sample counterpart when financial conditions are at their tightest. In other words, if it is wrong, it is wrong because it tends to overstate the easiness of financial conditions and therefore future growth prospects. Interestingly, our real-time measure of de-trended world excess liquidity is highly correlated with the simple year-ended rate of change in the unadjusted level. And because debt-to-GDP trends higher, the year-ended rate of change in excess liquidity is positively biased as well.
Ignore at your peril. For all its real-time measurement flaws, we cannot dismiss the value of world excess liquidity as a signal, because in the backtests we run, it adds value to asset allocation and style rotation processes. The signal is especially additive when combined with leading indicators of passive or risk parity performance. Indeed, it is almost as if passive and risk parity drivers somehow compensate for the real-time measurement errors in excess liquidity…. Looking at specific investments, we find that excess liquidity is very useful in forecasting commodity prices, credit excess returns and small caps relative performance. It seems to capture forward-looking information about inflation and creative destruction processes that are highly relevant for these asset classes. However, excess liquidity is more of a contemporaneous than leading indicator of the property cycle, and does not always correlate well with bond returns. The failures are just as intuitive as the successes. After all, debt-to-GDP and rising real property prices are really two sides of the same coin—it is really the spillover effects on the real economy and cyclical asset classes that lag in a somewhat predictable way. Growth in world excess liquidity should ultimately be a source of cyclical inflation and negative for bonds—but the trend increase in debt-to-GDP underpinning growth in excess liquidity constrains where rates can go, and therefore works in the opposite direction from a secular perspective.
Cointegration not so “nerdy” this time around. On the topic of real-time measurement errors, it is important to remember that sometimes two or more wrongs make a right. Indeed, this is the point of the cointegration literature. Technically, cointegration is the idea that two or more different series might exhibit clear trends through time —but a linear combination of these series might actually be stationary, or exhibit no trend. Effectively, contegration occurs when the error structures of different variables meaningfully “cancel out”. And we think that we can borrow this concept for the purposes of understanding how world excess liquidity behaves in real time. Our real-time measure is far from perfect—but it is interesting to note that the imperfect measure is still an incredibly powerful predictor of commodity price inflation, if not world IP growth, in the year(s) ahead. This predictive power is particularly stunning because historically, commodity prices are highly correlated with world IP, and so we would think that failure to predict IP well means failure to predict commodity prices well. We think that the ability of world excess liquidity to forecast commodity prices, even when it fails to predict world IP, is due to several wrongs making a right. We can still have a situation of too much money chasing too few goods, even when we fail to capture the full extent of tightness in financial conditions today, and even when we fail to predict the severity or longevity of downturns. Whatever we get wrong on the sufficiency of money supply is usually offset by what we get wrong on potential output. After all, history tells us that when IP falls more sharply than we expect, productive capacity also gets destroyed. The output gap widens initially on the shock to IP, and then narrows on recovery and capacity tightening. In this tightening process, we often see inflation recover ahead of time, and this supports inflation hedge asset classes like commodities. To be sure, we can and do see commodity prices undershoot the rate of inflation implied by world excess liquidity from time to time—but even when they do, they more than make up for the undershooting in years further out. And commodity investors can be incredibly forward looking.
Overwhelming or underwhelming force? Recently, world excess liquidity has moved sharply higher, partly because world IP (the denominator) has collapsed in every major economy, but partly also because of unconventional central bank balance sheet expansion directly engaging with the non-bank private sector. Mathematically, if excess liquidity continues to climb higher, the trend line will get revised higher, while the current deviation from trend will get revised lower. The prospect of strong recovery would get pushed out. These dynamics present a great dilemma for fiscal policy makers and central bankers. Ideally, they could taper their fiscal and balance sheet expansion plans at an opportune time when output is recovering and reflation is taking hold. World excess liquidity would stop increasing at its current rate, allowing the level to surpass the trend line. The “money illusion” would take hold resulting in imminent and strong growth recovery. Perhaps this explains why policy makers are so keen to re-open their economies as soon as possible, because imminent re-opening would provide an impulse to the economy on top of fiscal and monetary stimulus, eroding excess liquidity without getting the private sector too used to a “new norm” of extraordinary stimulus. Instead, they might embrace the “old norm” of a pre-COVID-19 world. But on the other hand, if policy makers keep up stimulus at its currently aggressive pace, and nominal output fails to respond in kind, world excess liquidity would rise sharply, and the trend line with it. At some point down the track, the actual level would rise above the trend line consistent with stimulation and reflation—but in the meantime, agents in the economy would get used to the new normal. They might look through to the bad news behind stimulus. And perhaps most importantly, the stimulus could be perversely stifling. We think in particular of the potential deflationary effects from monetary stimulus, because conventional quantitative easing and low rates hurt savers relative to borrowers by starving the private sector of net interest income. But there are other negative side effects such as perverse incentives for corporates not to invest to outgrow their valuation premia. All things considered, we can easily concoct scenarios where overwhelming force proves to be rather underwhelming. Nevertheless, we suspect that the “overwhelming force” option represents the path of least resistance for now, because central bankers do not want to risk higher bond yields and the consequences of them, having just seen bond yields spike higher in March with disastrous consequences for passive investors. Indeed, they do not want to risk this option, even though term risk premia in bonds are deeply negative, there is latent inflation risk from supply side destruction, and bond yields should naturally be higher but for central bank intervention. Again, at the risk of digression, we see that passive investing signals are powerful complements to world excess liquidity in real time…But our main point is to highlight that policy makers are at a critical juncture, facing incredibly high uncertainty, with inflation as the key balancing item. And in our view, very little of this forecast dispersion is fully reflected in bond or commodity pricing just yet.
Overweight commodities relative to bonds. Not only is world excess liquidity a powerful leading indicator of commodity prices – it is also highly correlated with the slope of the yield curve. On a real-time basis, world excess liquidity is at its highest levels in recorded history. It is consistent with material commodity price inflation in the years ahead, as well as a much steeper yield curve. And with short rates anchored at zero, a steeper yield curve means higher bond yields. Of course, central bank quantitative easing is a factor suppressing bond yields at present—but as we have demonstrated in recent articles, deliberate suppression of bond yields and bond volatility only puts more upward pressure on gold prices. However we look at the state of play, we see commodity exposures outperforming bond exposures.
Constructive on small caps, wary about credit and value. In isolation, the sharp rise in world excess liquidity favours small caps over large caps and credit over government bonds. There are other factors to consider in assessing the attractiveness of size and credit risk premia of course. But the strength of excess liquidity is a good place to start. We think that small caps are largely untainted by the push towards passive investing in recent years, and may be a good place to hide should we see more de-risking and de-leveraging in this space. Indeed, the recent sharp downturn in the economy may be a sufficient cleansing event to enable stronger businesses in the small caps universe to come to the fore. However, we are a little more concerned that credit risk premia may not be sufficiently large enough yet to warrant a foray into this space in such a fluid macro environment. Similar worries carry over to value investing, because value tends not to work well in de-leveraging environments, when credit is underperforming, because in such regimes asset prices drive fundamentals rather than the other way around.
David Llewellyn-Smith is Chief Strategist at the MB Fund and MB Super. David is the founding publisher and editor of MacroBusiness and was the founding publisher and global economy editor of The Diplomat, the Asia Pacific’s leading geo-politics and economics portal.
He is also a former gold trader and economic commentator at The Sydney Morning Herald, The Age, the ABC and Business Spectator. He is the co-author of The Great Crash of 2008 with Ross Garnaut and was the editor of the second Garnaut Climate Change Review.