Advertisement
Last night’s crash in the S&P 500 was one for the ages and saw the index plunge by nearly 12%:
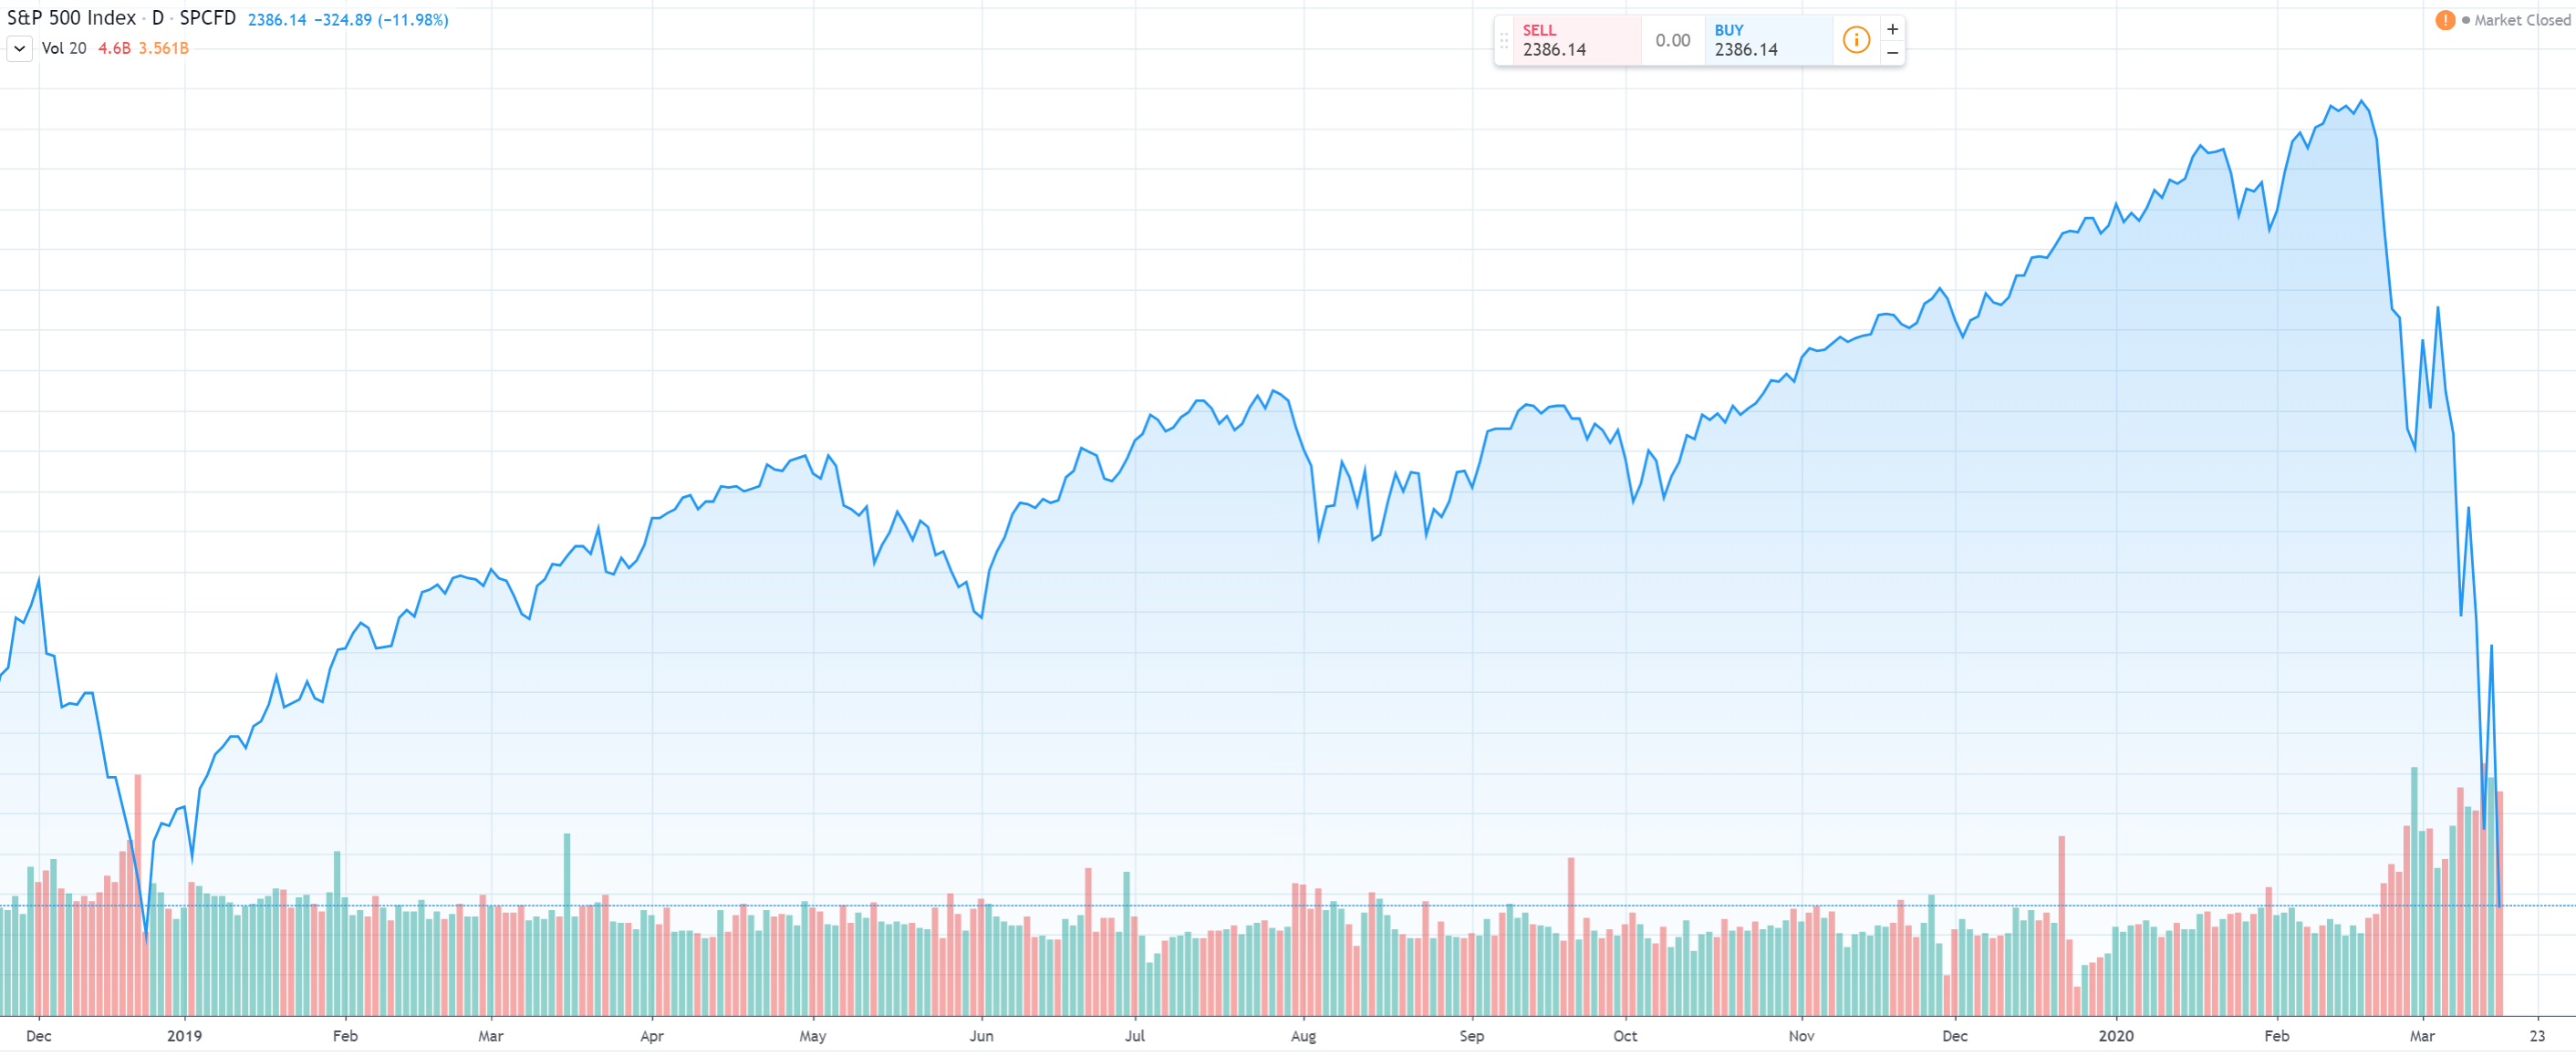
The S&P 500 has now plunged 30% from its 19 February peak and has erased all of 2019’s gains, which were the second best over the 11-year bull run.
The next chart shows how yesterday’s crash compares with prior events:
Advertisement
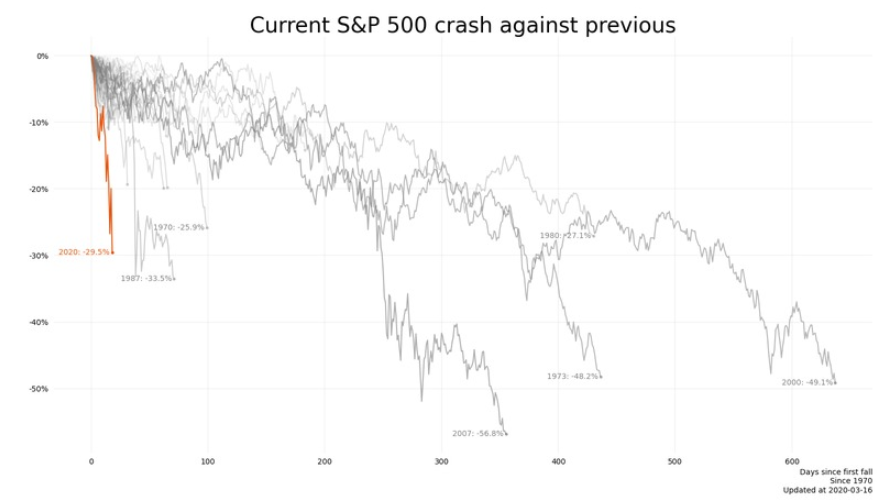
As you can see, this current crash is the steepest on record but not yet the deepest.
Goldmans believes the S&P will bottom-out at around 2,000 points. If true, this would represent a 41% peak-to-trough decline.
Advertisement
Personally, I believe a decline closer to 50% should be expected.
About the author

Leith van Onselen is Chief Economist at the MB Fund and MB Super. He is also a co-founder of MacroBusiness.
Leith has previously worked at the Australian Treasury, Victorian Treasury and Goldman Sachs.
Advertisement