From a deeply awry Scott Morrion at the AFR yesterday:
Scott Morrison has ruled out a fiscal stimulus package as the government announced that the economic effect of the coronavirus would be worse than that of the bushfires and all but conceded the forecast budget surplus had gone.
At the same time, Mr Morrison hinted that the travel ban in place for China could be lifted earlier than anticipated when he spoke of the resounding success of Australia in keep the disease at bay so far.
Mr Morrison said 30,000 Australian citizens, residents and immediate family members had entered Australia from China since the travel ban was imposed on February 1 and the self-isolation under which they quarantined themselves for 14 days had resulted in no human-to-human transfer of the disease.
History is a wonderful teacher. If you listen to it. As COVID-19 escapes quarantine worldwide, Australia faces a winter conundrum unlike anything it has confronted in a century. Thankfully there are historical experiences to draw from in the archives.
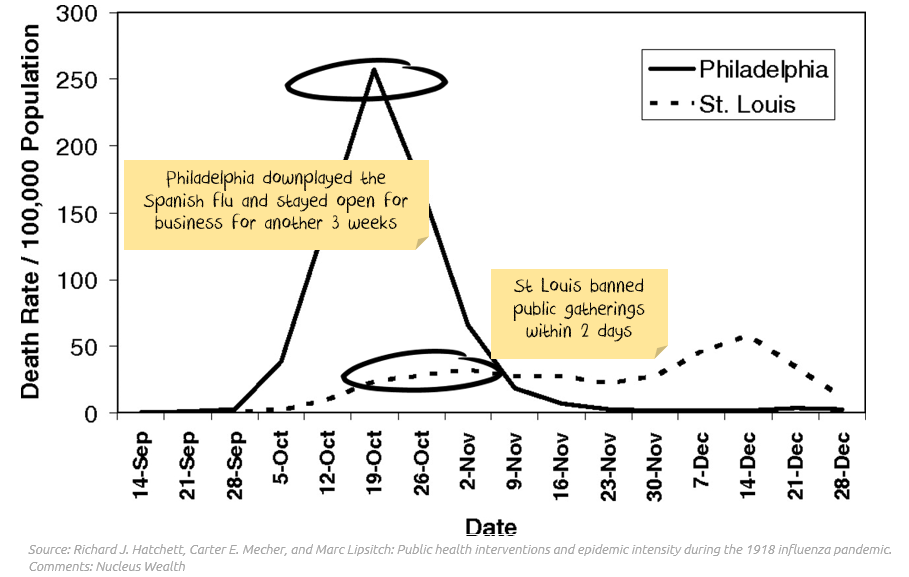
One such is Public health interventions and epidemic intensity during the 1918 influenza pandemic by Richard J. Hatchett, Carter E. Mecher, and Marc Lipsitch which examines how different US cities responded to the lethal influenza outbreak of 1918. The comparison made between Philadelphia, which played down the outbreak and stayed open, and St Louis, which immediately shut down, is instructuve:
Abstract
Nonpharmaceutical interventions (NPIs) intended to reduce infectious contacts between persons form an integral part of plans to mitigate the impact of the next influenza pandemic. Although the potential benefits of NPIs are supported by mathematical models, the historical evidence for the impact of such interventions in past pandemics has not been systematically examined. We obtained data on the timing of 19 classes of NPI in 17 U.S. cities during the 1918 pandemic and tested the hypothesis that early implementation of multiple interventions was associated with reduced disease transmission. Consistent with this hypothesis, cities in which multiple interventions were implemented at an early phase of the epidemic had peak death rates ≈50% lower than those that did not and had less-steep epidemic curves. Cities in which multiple interventions were implemented at an early phase of the epidemic also showed a trend toward lower cumulative excess mortality, but the difference was smaller (≈20%) and less statistically significant than that for peak death rates. This finding was not unexpected, given that few cities maintained NPIs longer than 6 weeks in 1918. Early implementation of certain interventions, including closure of schools, churches, and theaters, was associated with lower peak death rates, but no single intervention showed an association with improved aggregate outcomes for the 1918 phase of the pandemic. These findings support the hypothesis that rapid implementation of multiple NPIs can significantly reduce influenza transmission, but that viral spread will be renewed upon relaxation of such measures.
Influenza pandemics have occurred periodically in human populations, with three pandemics in the 20th century. The 1918 influenza pandemic resulted in unprecedented mortality, with an estimated 500,000–675,000 deaths in the U.S. and 50–100 million deaths worldwide (1–3). The spread of H5N1 avian influenza has provoked public concern (4) and accelerated efforts to plan for the next pandemic. Because antiviral medications and effective vaccines may not be widely available at the beginning of a pandemic, many authorities have suggested using nonpharmaceutical interventions (NPIs; i.e., voluntary quarantine of infected households, closure of schools, bans on public gatherings, and other measures) to decrease disease transmission. This approach is supported by mathematical models, which suggest that multiple simultaneous NPIs applied early in an epidemic may significantly reduce disease transmission (5). A recent review, however, concluded that the evidence base for recommending such interventions is limited, consisting primarily of historical and contemporary observations, rather than controlled studies (6).
The intensity of the 1918 pandemic, whether assessed as total excess deaths, the rate of increase in the epidemic curve, or peak death rates, varied widely among U.S. cities. Cities also varied widely in their choice and timing of implementation of NPIs designed to reduce disease spread. Many cities closed schools, churches, theaters, dance halls, or other public accommodations; made influenza a notifiable disease; banned funerals or other public gatherings; or introduced isolation of sick persons. In some cases, these NPIs were put in place in the first days of epidemic spread in a city, whereas in other cases, they were introduced late or not at all (Table 1).
In Philadelphia the outbreak burned out faster, given it was allowed to run through the population unimpeded, but residents died in much greater numbers. On the other hand, St Louis contained the speed of infections by closing down. This allowed it to deployed its support resources more effectively, even though the epidemic ran for an extra month.
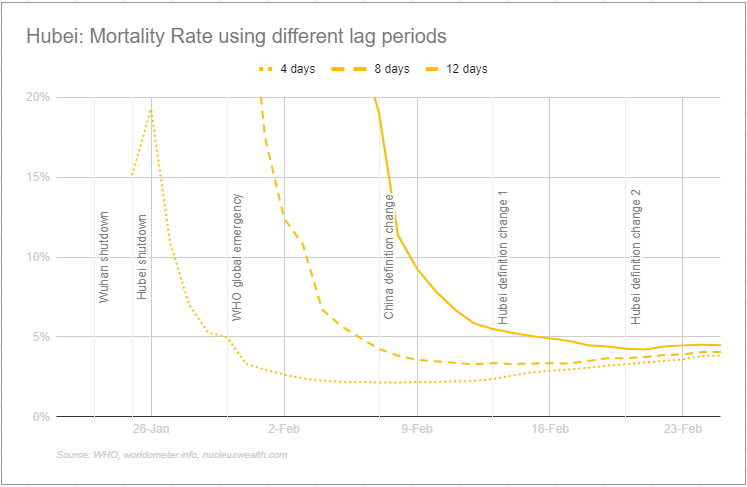
The St Louis approach has already been vindicated in China for COVID-19. Hubei loosed the pathogen, was overwhelmed, and its mortality rates skyrocketed:
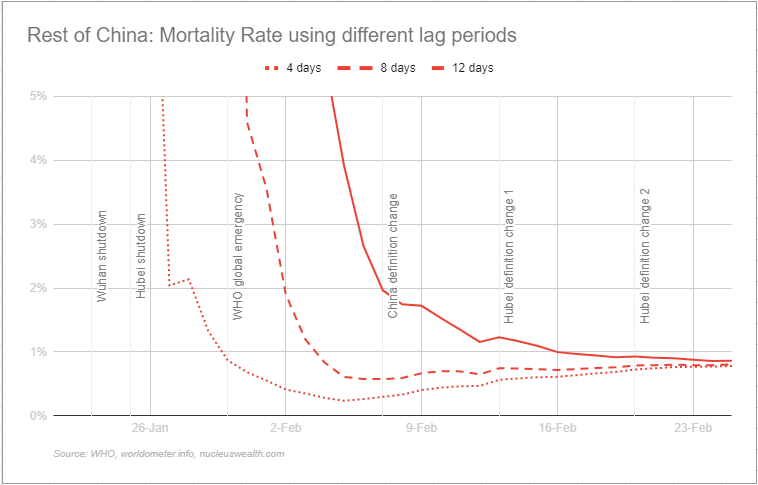
Greater China did not and its mortality rate is four times lower:
Likewise, the Australian travel ban has so far limited the outbreak to just 22 infections, only three local transmissions and no deaths. It would not have been so rosy without the ban and an additional 200k Chinese arrivals.
The lesson is clear. As it spreads globally, COVID-19 will very probably arrive in Australia leading into Autumn and Winter. Australian mortalities will be much greater if we keep the border open to affected countries. If we keep the Chinese ban in place, and expand it to other sick nations, as well as deploy sensible controls at home, then our dead will be much lower.
There will be a higher economic price to pay for the bans. But that is easily managed with a sizeable fiscal stimulus package. For specific public goods cases like the univerisites, they should compensated for lost revenue.
Worrying about the fiscal balance amid such a profound national interest duty is absurd. Especially so with rate cuts and quantitative easing looming, which will buy government debt anyway.
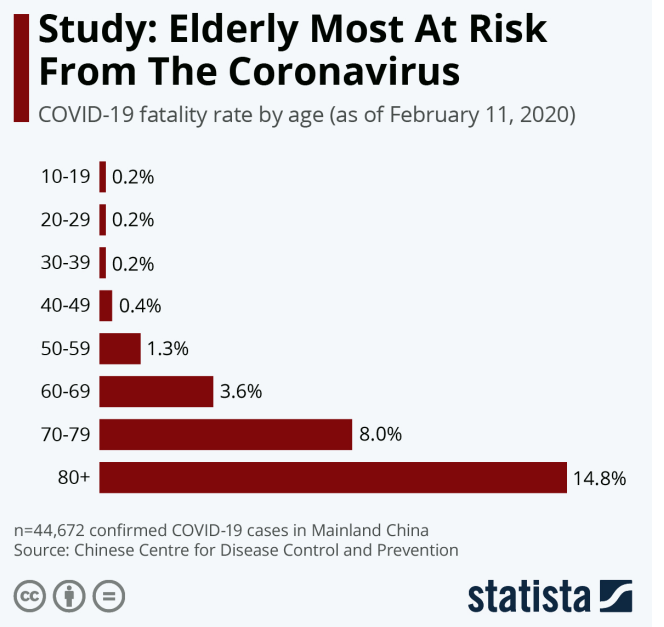
Yet the Morrison Government’s fiscal obsession and desire to limit economic harm puts it on the path of Philadelphia instead of St Louis. Australia’s elderly are the collateral damage in this plan:
ScoMo should expand border controls like St Louis did in 1918 or a lot more people will die.
Rightly, his government and perhaps political party, with them.
———————————————–
The full document is reproduced below.
Summary of interventions and their timing across 17 cities
We noted that, in some cases, outcomes appear to have correlated with the quality and timing of the public health response. The contrast of mortality outcomes between Philadelphia and St. Louis is particularly striking (Fig. 1). The first cases of disease among civilians in Philadelphia were reported on September 17, 1918, but authorities downplayed their significance and allowed large public gatherings, notably a city-wide parade on September 28, 1918, to continue. School closures, bans on public gatherings, and other social distancing interventions were not implemented until October 3, when disease spread had already begun to overwhelm local medical and public health resources. In contrast, the first cases of disease among civilians in St. Louis were reported on October 5, and authorities moved rapidly to introduce a broad series of measures designed to promote social distancing, implementing these on October 7. The difference in response times between the two cities (≈14 days, when measured from the first reported cases) represents approximately three to five doubling times for an influenza epidemic. The costs of this delay appear to have been significant; by the time Philadelphia responded, it faced an epidemic considerably larger than the epidemic St. Louis faced. Philadelphia ultimately experienced a peak weekly excess pneumonia and influenza (P&I) death rate of 257/100,000 and a cumulative excess P&I death rate (CEPID) during the period September 8–December 28, 1918 (the study period) of 719/100,000. St. Louis, on the other hand, experienced a peak P&I death rate, while NPIs were in place, of 31/100,000 and had a CEPID during the study period of 347/100,000. Consistent with the predictions of modeling, the effect of the NPIs in St. Louis appear to have had a less-pronounced effect on CEPID than on peak death rates, and death rates were observed to climb after the NPIs were lifted in mid-November (7–9).
To investigate whether early implementation of individual interventions or of multiple measures reduces disease transmission during influenza pandemics, we analyzed the NPIs used in a collection of U.S. cities during the fall wave of the 1918 pandemic, identifying the NPIs used in each city as well as the timing of their implementation [details of individual city outcomes and interventions are included in supporting information (SI) Appendix]. We then related this information to the observed outcomes of the peak weekly death rate and CEPID during the period September–December, 1918. Excess death rates were used as a proxy for case incidence because of the more accurate reporting of deaths than cases. We hypothesized that early implementation of multiple NPIs in an immunologically naïve population would slow the progression of the epidemic, resulting in a flatter epidemic curve, but that over time aggregate outcomes would approach those observed in cities not implementing such measures, until roughly comparable levels of herd immunity were achieved.
Results
Effect of Early Interventions on Epidemic Spread.
We assessed the relationship between the timing of NPIs and three measures of epidemic outcome: (i) the peak weekly rate of excess P&I deaths per 100,000 population (peak death rate) during the study period; (ii) the “normalized” peak weekly excess P&I death rate (peak weekly death rate during the study period divided by the median weekly rate during the period); and (iii) the CEPID per 100,000 population during the study period. The stage of the epidemic at the time of each intervention was defined as the CEPID from the start of the study period until the date on which the intervention was announced. Thus, early interventions in a given city were those that were implemented when relatively few individuals had died, whereas later ones were those implemented after more excess P&I deaths had occurred.
In comparisons across cities (Fig. 2a, Table 2), we found that aggressive early intervention was significantly associated with a lower peak of excess mortality (Spearman ρ = −0.49 to −0.68, P = 0.002–0.047; see Table 2, Number of interventions before, for the number of NPIs before a given CEPID cutoff vs. peak mortality). Cities that implemented three or fewer NPIs before 20/100,000 CEPID had a median peak weekly death rate of 146/100,000, compared with 65/100,000 in those implementing four or more NPIs by that time (Fig. 2a, P = 0.005). The relationship was similar for normalized peak death rates and for a range of possible cutoffs (see Table 2, CEPID at time of intervention), although the relationship became weaker as later interventions were included. Cities with more early NPIs also had fewer total excess deaths during the study period (Fig. 2b, Table 2, 1918 total), but this association was weaker: cities with three or fewer NPIs before CEPID = 20/100,000 experienced a median total excess death rate of 551/100,000, compared with a median rate of 405/100,000 in cities with four or more NPIs (P = 0.03).
The association of early intervention and lower peak death rates was also observed when cities were ranked according to the CEPID in each city at the time of the second, third, fourth, or fifth intervention (Table 2, CEPID at time of intervention). Similar relationships were again detected for the normalized peak death rate [Table 2, CEPID at time of intervention/Normalized peak]. Again, the relationship with total death rate was weaker and in this case not statistically significant.
Effects of Individual Interventions.
To assess whether particular NPIs were associated with better outcomes, we calculated a Spearman rank correlation coefficient between outcome measures and the stage at which individual NPIs were implemented in each city (cities that never implemented a given intervention were ranked last in each analysis). Results are shown in Table 2, CEPID at time of. Early school, church, or theater closure was associated with lower peak excess death rates (Spearman ρ = 0.54–0.56, P = 0.02). Cities that made each of these interventions before they reached 30/100,000 CEPID had a median peak death rate of 65–68/100,000, compared with median peaks of 127–146/100,000 for cities that made these interventions later or not at all (Fig. 2a, P = 0.005–0.01). Announcements of school, church, and theater closures were linked in most cities, occurring within a span of ≤6 days in the majority, and this near simultaneity of implementation precludes multivariate analysis or strong inference about the relative importance of the individual NPIs. Early bans on public gatherings were also associated with lower peak excess death rates, but the statistical significance of this result depended on the test used [Table 2, CEPID at time of, and Fig. 2a]. Of the other NPIs considered (closure of dance halls, other closures, isolation of cases, bans on public funerals, and making influenza notifiable), none showed a statistically significant association between the stage of implementation and the peak or cumulative excess death rates (Table 2, CEPID at time of, and Fig. 2).
Other Predictors of Epidemic Severity.
We assessed the correlation between peak mortality rate and each of the following variables: latitude, longitude, 1910 population density, 1920 population density, 1918 population size, and epidemic start week, defined as the first week in which excess P&I mortality exceeded 10/100,000. Of these variables, only longitude (Spearman ρ = −0.61, P = 0.009) and epidemic start week (Spearman ρ = −0.55, P = 0.02) were significantly associated with the peak weekly excess P&I mortality rate, and these two variables were strongly associated with one another (Spearman ρ = 0.66, P = 0.004), indicating that eastern U.S. cities were hit earlier in our data set. In addition, cities whose epidemics began later tended to intervene at an earlier stage of their epidemics (Spearman ρ = 0.77, P = 0.0003), presumably because local officials in these cities observed the effects of the epidemic along the Eastern seaboard and resolved to act quickly.
In linear regressions of peak death rates vs. stage of the epidemic at the time of interventions (number of NPIs before CEPID = 20/100,000) and timing of epidemic onset, the association of peak with intervention stage was statistically significant and stronger than that with epidemic onset in univariate models (SI Table 3). If both predictors are used in a bivariate regression, the point estimate for interventions remains unchanged while the p value increases to 0.13; no independent effect of week of onset is seen in this bivariate model. Similar results are found for longitude (data not shown). Subject to the caveats of performing a linear regression on only 17 cities with such highly correlated explanatory variables, this finding suggests that the relationship between early intervention and lower peak death rates is explained by factors of geography or timing of epidemic onset only to the extent that these factors influenced the quality of the public health response.
Sensitivity Analyses.
Similar results were obtained when the intervention date was defined as the date public health orders were promulgated (Table 2) or the last date a particular type of gathering was permitted (e.g., Sunday church service; SI Table 4). Results were identical or improved when 7- and 10-day lags in assessing CEPID were introduced to account for the lag between infection and death (SI Tables 5 and 6).
Relationship Between Interventions and Subsequent Waves.
Although it was not the primary intent of this paper to analyze pandemic wave dynamics, it is possible to formulate descriptive observations from the data at hand (SI Table 7). In offering these observations, it is important to underscore that in some cities, information about the dates of relaxation of the interventions used was incomplete.
All cities showed some fluctuation in mortality rates after the main wave of the 1918 pandemic subsided. The peak weekly mortality rates observed in “second waves” in the cities we studied ranged from 13.60 to 79.69/100,000, as compared with 31.29–256.96/100,000 during the first wave. There was a statistically significant inverse correlation of the height of the first and second peaks (Spearman ρ = −0.53, P = 0.03), so that cities that had low peaks during the first wave were at greater risk of a large second wave. Cities that had lower peak mortality rates during the first wave also tended to experience their second waves after a shorter interval of time, ≈6–8 weeks after the first peak vs. 10–14 weeks for cities with higher peak mortality rates (Spearman ρ = −0.84, P < 0.0001). These patterns were also observed in cities that implemented NPIs sooner [as assessed by ranking the cities according to their CEPID at school closure (Spearman ρ = 0.63, P = 0.006) or CEPID at time of the fourth intervention (Spearman ρ = 0.52, P = 0.03)]. Finally, and this is perhaps the most important observation, no city in our analysis experienced a second wave while its main battery of NPIs was in place. Second waves occurred only after the relaxation of interventions.
Discussion
Comparisons across 17 U.S. cities show that the first peak in excess P&I death rates during the fall wave of the 1918 influenza pandemic was ≈50% lower in cities that implemented multiple NPIs to control disease spread early in their epidemics than in cities that made such interventions late or not at all. This finding suggests that such interventions may be capable of significantly reducing the rate of disease transmission so long as they remain in effect.
If NPIs were maintained indefinitely once they were put in place, one would expect that early interventions would be associated with a reduction in both the peak incidence (and therefore peak death rate) and also in the cumulative incidence or cumulative excess death rate. However, NPIs used in 1918 did not last indefinitely; rather, most of the NPIs in the study cities appear to have been relaxed within 2–8 weeks, whereas opportunities for reintroduction and transmission of the pandemic virus extended for many months. If highly effective NPIs are put in place early in the epidemic, and these result in a smaller epidemic, then a large proportion of the population will remain susceptible to the renewed spread of the virus once interventions are relaxed. In the absence of an effective method of otherwise inducing immunity in the uninfected population (i.e., a well matched vaccine), such an epidemic is likely to have two phases, with the first phase mitigated by NPIs and the second commencing after NPIs are relaxed. In our review of 17 cities, we observed that cities that implemented NPIs sooner had lower peak mortality rates during the first wave and were at greater risk of a large second wave. These cities also tended to experience their second waves after a shorter interval of time. As described above, no city in our analysis experienced a second wave while its main battery of NPIs was in place, and second waves occurred only after the relaxation of NPIs.
A mitigated two-phase epidemic may result in a cumulative burden of morbidity and mortality less than that observed in a single unchecked epidemic because of reduced epidemic overshoot (7–9). However, the relationship between the timing of transiently maintained NPIs and final outcomes will be complicated and not necessarily monotonic (10). Because our goal was to assess the evidence for an effect of NPIs on transmission, rather than to assess whether the particular NPIs in 1918 were sustained long enough to prevent epidemic spread altogether, we defined peak death rates a priori as the main outcome measure. Consistent with these expectations, the relationship between intervention timing and peak death rates was stronger and statistically more convincing than that with total death rates in 1918.
The most important limitation of our study is that we used observed weekly excess fatality rates as a proxy for weekly community morbidity rates, which are not available for the study period. We believe that untransformed excess mortality rates are the most reliable (and least assumption-laden) record of the effects of the pandemic, but it is important to note that case fatality proportions (CFP) in 1918 appear to have varied between populations [being higher, for example, among the Inuit than in the general United States population (1)], likely as a result of differing levels of general public health, and it is possible that they varied between cities in the United States for similar reasons. Varying patterns of bacterial colonization or other, unidentified factors could also have contributed to variation in CFP. Differences in CFP between the cities could introduce a systematic error into our results (because they would lead to higher total deaths at a given stage of the epidemic, and higher peaks, in the same subset of cities). Our use of a normalized peak death rate was designed to avoid this error. If our results were artifacts of city-to-city variation in CFP, then the associations found should become weaker after this normalization; in fact, each of the strongest associations was at least comparably strong after the normalization (Table 2, Normalized peak), suggesting that variation in CFP did not create the associations we found.
More generally, a possible explanation for our findings is that inherently small epidemics (i.e., epidemics with flatter and smaller overall mortality curves, because of variation in CFP or in other factors not considered in our analysis) could appear to be associated with earlier interventions as an artifact of how we defined “early.” If this were the case, however, even ineffectual NPIs, considered individually, should correlate with lower peak mortality rates. In fact, NPIs that seem less likely to block transmission directly (e.g., making influenza a notifiable disease, closing dance halls, and bans on public funerals) had no such association. That several individual interventions were found not to be associated with lower peaks suggests this statistical artifact is not present.
Previous authors have noted that epidemics that started later tended to be milder and have speculated that this might be due to attenuation of the causative virus (3). Although viral attenuation may explain changes in the CFP over the course of the pandemic period (which extended to approximately March 1920), this mechanism seems an unlikely explanation for the striking variability of outcomes during the 1918 fall wave, given the marked transmissibility of the lethal virus and the short intervals between the onset of epidemics in different cities. A potentially more plausible explanation is that public health and political authorities in cities that were struck later responded more quickly and aggressively because they had several weeks’ notice of the severity of the pandemic. Subject to the caveats attendant on a linear regression in such a small data set, we found that the stage of the epidemic at the time of interventions predicted peak mortality better than timing of epidemic onset. This finding suggests that the association between early intervention and lower peak mortality may be explained in large part by the fact that later-hit cities responded more promptly. Similar results were obtained when longitude was included in the analysis along with or in place of time of epidemic onset. Although we do not know of any mechanistic hypothesis connecting longitude directly to epidemic severity, our analysis similarly suggests that longitude is not an important confounder of our results.
In a related vein, the analysis of second peaks adds credence to the inference that NPIs were responsible for the observed lower first peaks in cities that implemented NPIs promptly. If lower first peaks were attributable to some other mechanism (e.g., a less virulent virus, seasonal changes in transmission, etc.), it is difficult to explain why, upon relaxation of NPIs, these low-peak cities tended to have larger second peaks. On the other hand, if NPIs curtailed the first wave, leaving more susceptibles in the early-intervention cities, then one would expect a more severe second wave in these cities, as was observed. Altogether, we take these findings as evidence that NPIs were capable of reducing influenza transmission in 1918, but that their benefits (as one would expect) were limited to the time they remained in effect.
In sensitivity analyses, we found that associations between early intervention and better outcomes were strengthened when we timed interventions based on the cumulative excess deaths up to 7 or 10 days after the intervention, an effort to account for the delay expected from case incidence (which is affected by interventions) to mortality. In part, this strengthening likely is due to the fact that delayed death figures better reflect the true stage of the epidemic at time of intervention. However, use of a delay time in this fashion raises concerns about reverse causality. If a delay longer than the shortest time from infection to death is used (e.g., the median, rather than the minimum, time to death), then the number of deaths before intervention, the independent variable in our analysis, is affected by the intervention itself. To avoid such difficulties, we took as our primary analysis the simpler, more conservative approach of defining the stage of the epidemic based on the date of intervention, with no delay. This choice has the additional benefit that in future pandemics, the cumulative excess death rate at the time of an intervention is in principle knowable in nearly real time, whereas the delayed death rate cannot by definition be known at the time of an intervention.
The implications of our analysis should be interpreted with care. Our univariate analyses of the relationship between individual NPIs and outcomes are consistent with the hypothesis that social distancing through closure of particular institutions (schools, churches, and theaters) led to reduced transmission, but the similarities in timing of various NPIs within a given city make it very difficult to discriminate the relative contributions of individual interventions (Fig. 2). Similarly, it was not possible to evaluate the effects of NPIs that were undertaken only in a small number of cities, or that were generally implemented only late in the epidemic, if at all, such as mass transit interventions (rules forbidding crowding and introduction of staggered business hours to reduce crowding on mass transit) or mask ordinances. Whether these NPIs might have made a difference in particular cities where they were implemented early, such early implementation was not common enough to evaluate whether it was associated with better outcomes. A third consideration is that the historical record is not seamless, and it is possible that our source material did not capture the full range of interventions used or reflect the true timing of implementation of those it identifies. Finally, we note that causality may be complicated; the interventions used may themselves have produced the observed effects, or they could have worked by shaping perceptions about the epidemic and causing changes in unmeasured private behaviors. Despite these caveats about the details of interpretation, the relationships detected in our analyses strongly suggest that the aggressive implementation of NPIs resulted in flatter epidemic curves and a trend toward better overall outcomes in the fall of 1918.
To the extent that these results provide evidence that multiple NPIs can reduce influenza transmission and mitigate the impact of a pandemic, they should inform current efforts related to pandemic preparedness. In particular, our results underscore the need for prompt action by public health authorities. The strongest relationship between peak death rates and timing of NPIs was observed for the number of interventions in place before the CEPID exceeded 20/100,000. If we assume a 2% CFP, this approximately corresponds to interventions undertaken before the deaths caused by infections in 1% of the population in a given city had occurred. Given the rate of growth of the pandemic and the lag between infection and death, perhaps 3–6% of the population would have been infected at this time. This finding emphasizes the need for very rapid interventions to stem the spread of the disease. Communities that prepare to implement layered NPIs aggressively are likely to achieve better outcomes than communities that introduce such interventions reactively, and they may be better positioned to manage the disruption caused by the more stringent interventions, such as school closure.
Finally, an important practical issue that requires further study is the question of when such interventions can be relaxed. The implication of patterns observed in the timing and severity of second waves in 1918 seems clear, however. In the absence of an effective vaccine, cities that use NPIs to mitigate the impact of a pandemic remain vulnerable. In practice, and until emergency vaccine production capacity increases, this means that in the event of a severe pandemic, cities will likely need to maintain NPIs for longer than the 2–8 weeks that was the norm in 1918.
David Llewellyn-Smith is Chief Strategist at the MB Fund and MB Super. David is the founding publisher and editor of MacroBusiness and was the founding publisher and global economy editor of The Diplomat, the Asia Pacific's leading geo-politics and economics portal.
He is also a former gold trader and economic commentator at The Sydney Morning Herald, The Age, the ABC and Business Spectator. He is the co-author of The Great Crash of 2008 with Ross Garnaut and was the editor of the second Garnaut Climate Change Review.