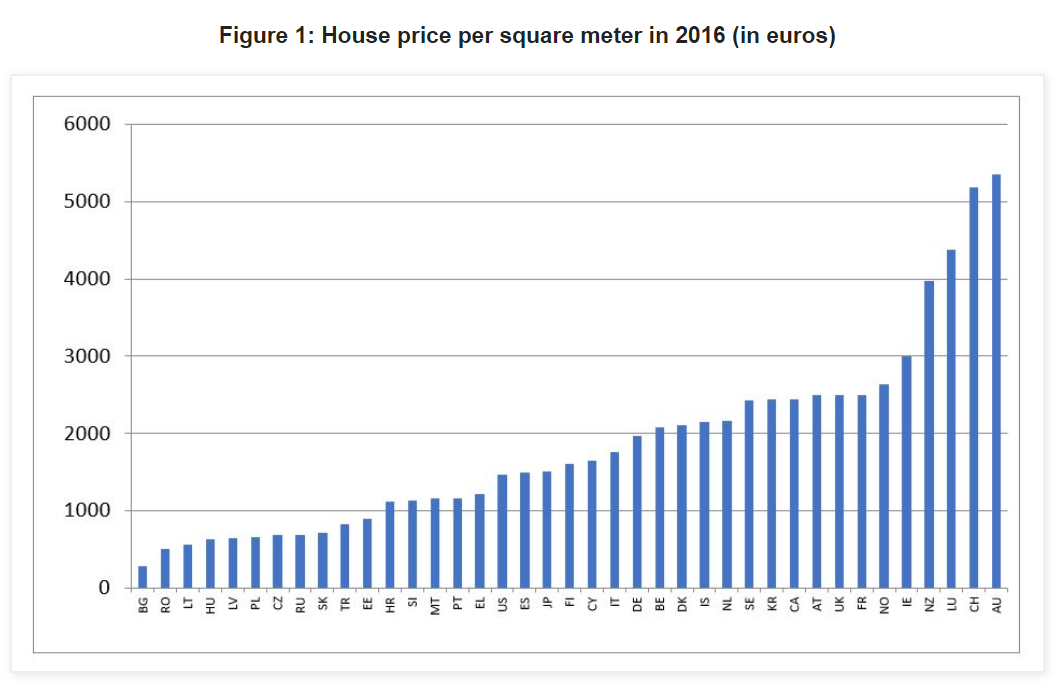
A new data set comparing house prices across countries has ranked Australia as the second most expensive on a per square metre basis:
A new data set called HouseLev put together by Jean-Charles Bricongne, Alessandro Turrini and Peter Pontuch fills the gap. It provides the average price per square meter of housing in 40 countries, from as far back in 1970 for most countries to the most recent available, generally 2017 or 2018.
The authors use two methods, top-down and bottom-up, with the latter intended to provide a check on the former or a back-up estimate when the top down method is not feasible due to missing data.
The top-down method computes the average price as the ratio of the total value of dwellings and associated land to the total floor area of dwellings. The total value of dwellings and land (‘the numerator’) is generally taken from the national income accounts of countries; the total floor area (‘the denominator’) is from the census data of countries. Divide one by the other and, presto, you have the average price of a house.
So now we have an answer to the first question posed earlier. As shown in Figure 1, it turns out that the cost of the average house price in the United States is under 1500 euros per square meter and over 5000 euros per square meter in Australia. (For metrically-challenged U.S.-centric readers, that’s about $150 per square foot in the United States.)
Of the countries in the data set, houses in Bulgaria are the cheapest at under 300 euros per square meter and the most expensive houses are in Hong Kong (SAR)—prices there are literally off the charts—nearly 30,000 euros per square meter!—and hence not shown in Figure 1.
How reliable are these estimates? Here’s where the bottom-up approach comes in. The authors have painstakingly gone through the websites of real estate agents and collected the data on sales offers in different locations. These data are then aggregated up to give a country-level average. Reassuringly, for most countries, the top-down approach and the bottom-up approach give similar estimates of house prices—the median difference in only 7 percent and the biggest difference is 12 percent.
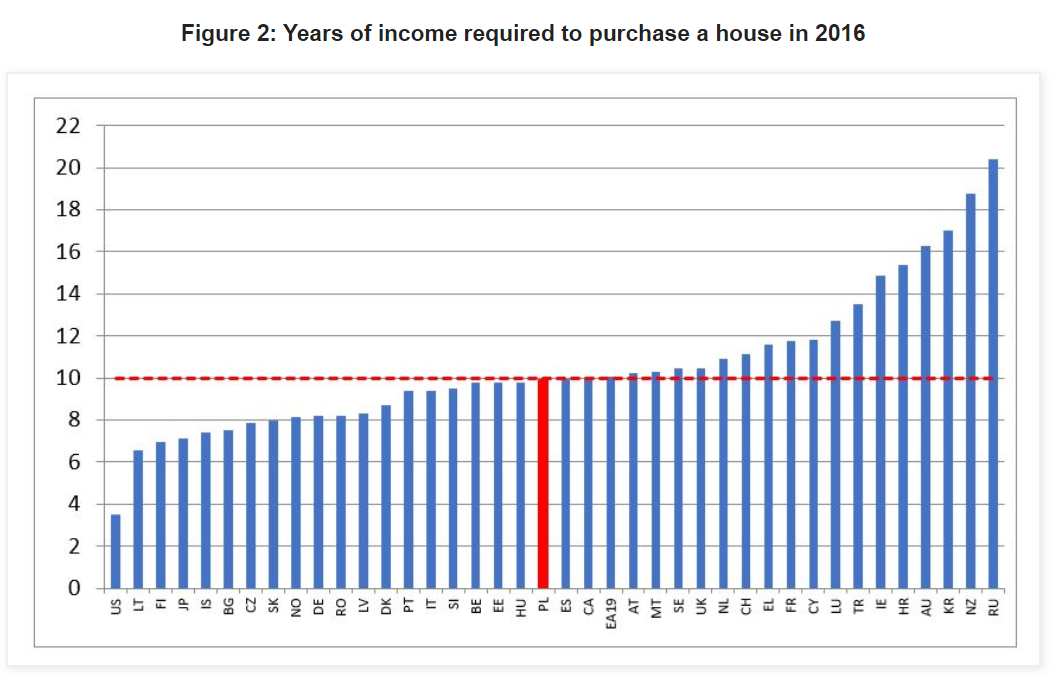
Figure 2 shows that it takes under 4 years of average income to buy a house of average size in the United States and over 16 years in Australia. The median across countries is 10 years.
The creators of the data set also looked into whether high ratios of house prices to incomes can signal a correction in house prices. They find that if the ratio is greater than 10, there is concrete risk of a significant downward correction of house prices in the following three years (see their paper, Bricongne et al. (2019), for the details).
Leith van Onselen is Chief Economist at the MB Fund and MB Super. He is also a co-founder of MacroBusiness.
Leith has previously worked at the Australian Treasury, Victorian Treasury and Goldman Sachs.