Australian capital city dwelling prices, led by Sydney and Melbourne, have risen sharply since mid-2019. RBA rate cuts, coupled with extra borrowing capacity from the APRA induced changes to loan serviceabilityassessment anda surprise election outcome that removed some taxation risksaround housing causedhome buyer interest return in force.
Back in Julywe updated our dwelling price forecasts and extendedthe profile to end-2020.Our assessment at the time was thatafter a national peak-to-troughfall of 10%, prices would rise modestly over H2 2019 and 2020. We flaggedthat therisks to our forecastprofilewere to the upside, but a V-shaped recovery was not our central scenario. Our working assumption was that potential home buyer exuberance would be somewhat tempered by the previous two years of deflating prices, some lingering restrictions on credit availability and concerns about excess dwelling supply.As a result, our forecasts sat on the conservative side of the fence.
History, however, will show that the rebound in demand has been phenomenal, particularly in Sydney and Melbourne. Auction clearance rates are high, the flow of credit has picked up markedly and both house price expectations and home buyer intentions have spiked. It looks like an element of FOMO (fear-of-missing-out) has returned to the market! As a result, our original price targets have beenachieved sooner than expected.
In this note we re-benchmarkour dwelling price forecasts. Our quantitativeassessment of the residential market,overlaid with our qualitativeviews,means we now expectnational property prices to riseby around 6% in 2020. Within the mix, however, there is likely to be significant variation in outcomes by capital city. We expect Sydney and Melbourne, underpinned by strong population growthand low unemployment,to outperform relative to the nationalaverage.There are scenarios that could see prices both undershoot or overshoot our forecasts –these are discussed.
Recent developments
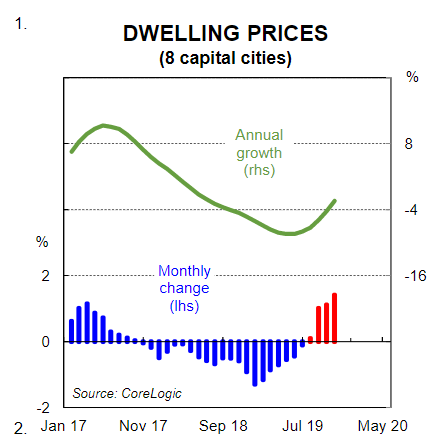
National dwelling prices have risen strongly over the past three months.Prices rose by 1.4%in October, 1.0% in September and1.0% in August(chart 1).Prices nationally now sit 3.7% above their June 2019trough(see here). But they remain 7% below the September 2017peak.
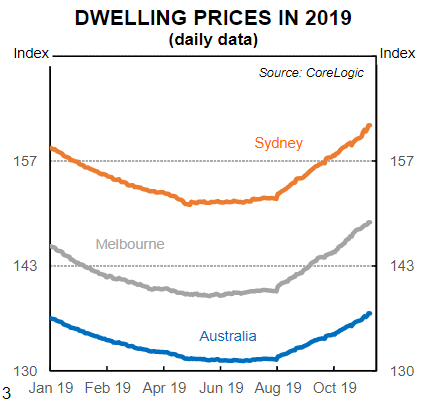
Price rises have been greatest in Sydney and Melbourne over the past three months(chart 2). And house prices have risen faster than unit prices.Turnover has remained relatively thin, however (chart 3). And listing are well down on year ago levels. Tight supply is no doubt amplifying the impact of the lift in demand.
The flow of credit is key
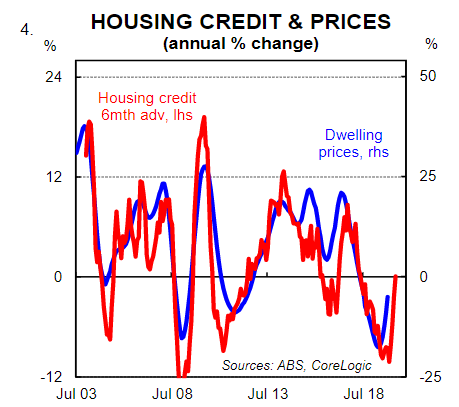
The flow of credit (i.e. new lending) has a clear impact on dwelling prices. More specifically, the annual change in the flow of credit has a close leading relationship with the annual change in dwelling prices by around six months(chart 4).
New lending is driven by the supply and demand for credit. The latest ABS lending data indicatesthat the flow of housing credit has picked up materially over the past fourmonths.Indeed over the four months to September it grew at an annualised pace of 52%!It has been a broad-based increase across investors and owner-occupiers(including first home buyers).
Throughout the two year period to mid-2019 when dwelling prices were falling and the flow of credit was slowing, we argued that the decline was driven primarily by falling demand for credit rather than a tightening in lending standards. We took that view because:
(i)both the valueand numberof loans were in decline (amore rigorous assessment of living expenses should have weighedon the valueof lending. But it should not in and of itself have had a material impacton the number of loans written);
(ii)household expectations around house prices hadfallen to multi-year lows(if households as a collective expect prices to fall then the demand for credit wanesand the flow of new lending falls); and
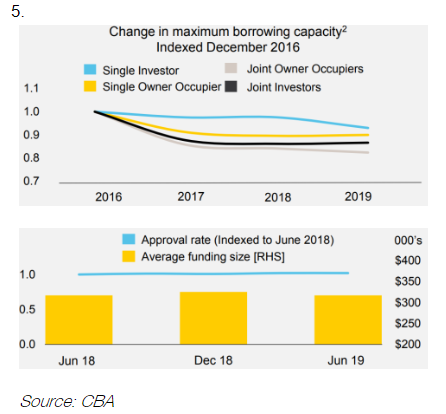
(iii)the maximum borrowing capacity for CBA customers hadbeen broadly stable over thepastfewyears.Indeedthere hasbeen minimal changes in both our average loan size and approvals rates (chart 5).
Fast forward to today and there has been asharplift in the demand for credit which is being reflected in a big lift in monthly lending. This trend is set to continue based on the leading indicators of momentum.We believe that the single biggest factor driving the liftin demand is the cumulative75bps ofRBA interest rate cuts since June which have resulted in a fall in mortgage rates to both owner-occupiers and investors.
Momentum has picked up
Like all asset markets, there is clearly a momentum to the property market. It is often the case that both owner-occupiers and investors wait until they see a positive momentum in the market before they transact. This of course creates a self-fulfilling dynamic –as the market firms, would-be buyers are more confident to purchase and this brings other buyers into the market. Price rises are the inevitable outcome and this creates a positive feedback loop that can continue for an extended period, particularly in an RBA easing cycle, until there is a circuit breaker (e.g. interest rate hikes, macro-prudential tightening) or general fatigue.
And over the past fourmonths the key indicators of momentum that we monitor have all strengthened. Auction clearance rates are sitting at levels consistent withclose todouble-digit dwelling price growth. And both the CBA home buying measure in our Household Spending Intentions Survey (chart 7) and the house priceexpectations index from the WBC/MI Consumer Sentiment survey have surged.
Our price outlook
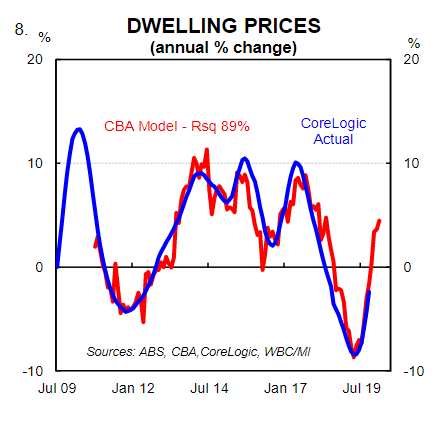
Our dwelling price model puts the annual change in national dwelling prices as a function of the annual change in mortgage rates (1 year advanced), the annual change in the flow of credit (six months advanced), auction clearance rates (four months advanced) and the house price expectations index from the WBC/MI Consumer Sentiment survey (2 months advanced). The model explains trends in dwelling prices very well (chart 8).
Clearly, we can’t forecast auction clearance rates or the household perception around the future path of dwelling prices. But we have the latest data on both of those measures which helps us to project near term movements in prices. In addition, the flow of credit and changes in mortgage rateshave historically had a lagged impact on dwelling prices of between six and twelve months. So we believe that we can forecast dwelling prices over the near term with a reasonable degree of confidence.
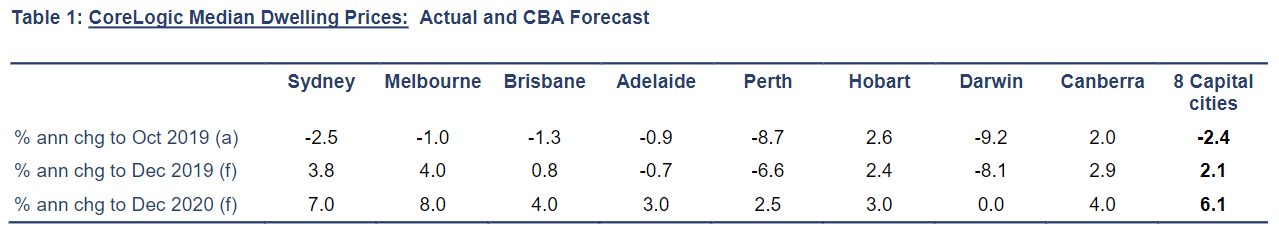
Our base case for property prices in Sydney and Melbourne has them rising by 7% and 8% respectively over 2020. For Brisbane and Perth, we see prices rising more modestly. Nationally, we think prices will rise by 6%. Table 1 details our point forecasts by capital city.There are both upside and downside risks to our forecasts, but we think the balance of risks are tilted to the upside.
Population growth (underlying demand) and dwelling construction (supply)
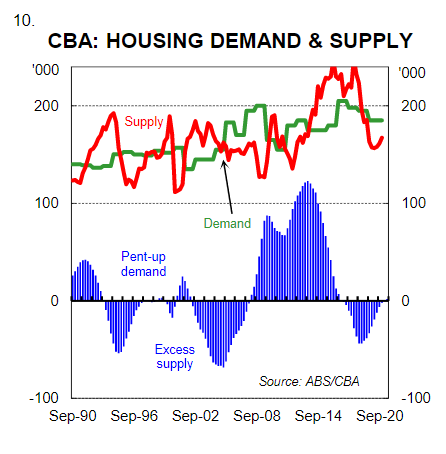
Population growth remains strong in Australia. In the year to Q3 2019 (latest available), Australia’s population grew by 1.6% (i.e. 389k). Net overseas migration accounted for 64% of that increase (chart 9). A high population growth rate meansthat residential construction must run at elevated levels or else a housing shortage will manifest itself.
Residential construction is presently in decline which means thatgrowth in new construction as a share of the population is falling. On our calculations the decline in residential construction is taking place at a time when the excess supply of dwellings is relatively small(chart 10). This means that it won’t be long until the excess supply has been eroded. Our estimates point to an undersupplyof housing from late-2020 (see here). In time this should put downward pressure on vacancy rates and upward pressure on rents and dwelling prices.
Risks
Downside risks: In our view there are twokey downside risks to our view on property prices. First,the reintroduction ofmacro-prudential measures to slow the growth in lending.Measures introduceda few years agoto slow both the rate of growth in lending to investorsandthe rate of growth in interest-only lending were successful in slowing dwelling price appreciation. Second, a lift in the nationalunemploymentrateabove 5.5% would likely result in dwelling prices not lifting as much as we expect.
Upside risks: We consider there to be two key upside risks to our property forecasts. First, unconventional monetary policy (UMP) that resultsin lower borrowing costs.We expect one further 25bp cut to the cash rate in Q1 2020which should result in a further reduction in mortgage rates. But any move to UMP that results in mortgage rates moving lower than we expect would likely result in dwelling prices inflating by more than we anticipate. Second, any further policy changes to boost housing demandsuch as first-home-owner grants or lower stamp duty (to domestic or foreign buyers) is an upside risk to our base case.
David Llewellyn-Smith is Chief Strategist at the MB Fund and MB Super. David is the founding publisher and editor of MacroBusiness and was the founding publisher and global economy editor of The Diplomat, the Asia Pacific's leading geo-politics and economics portal.
He is also a former gold trader and economic commentator at The Sydney Morning Herald, The Age, the ABC and Business Spectator. He is the co-author of The Great Crash of 2008 with Ross Garnaut and was the editor of the second Garnaut Climate Change Review.