
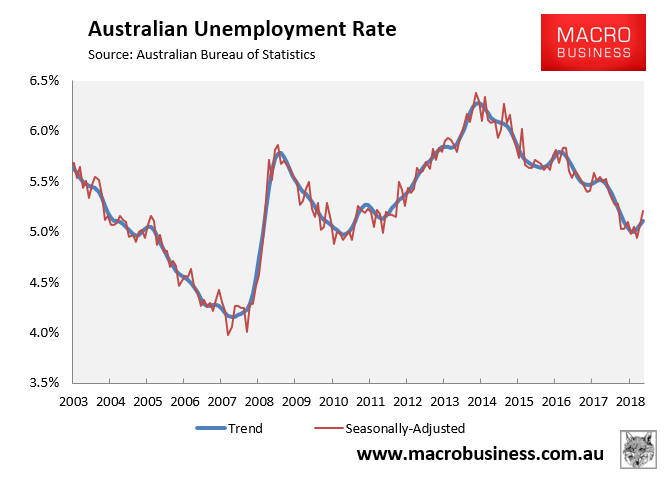
As summarised earlier, the Australian Bureau of Statistics (ABS) today released its labour force report for April, which registered a solid 28,400 increase in total employment but a 0.1% increase in the headline unemployment rate to 5.2%, partly driven by a 0.16% rise in labour force participation.
The underemployment rate also jumped by 0.3%, whereas labour underutilisation jumped by 0.4%.
In trend terms, the unemployment rate rose to 5.1%:
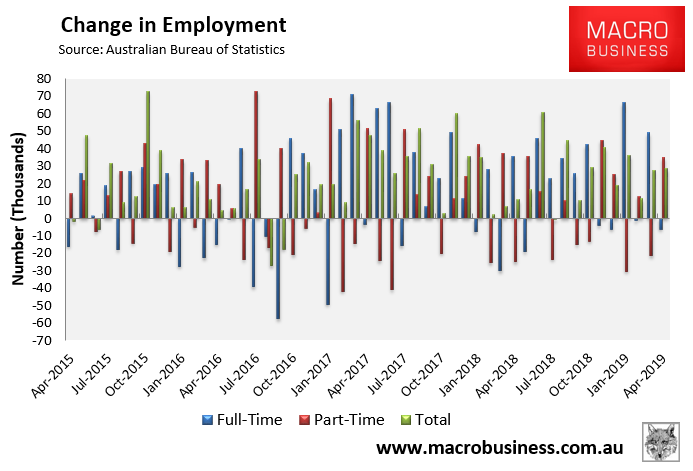
Again, total employment rose by a seasonally adjusted 28,400 to 12,822,900. Full-time jobs fell by 6,300, whereas part-time employment increased by 34,700:
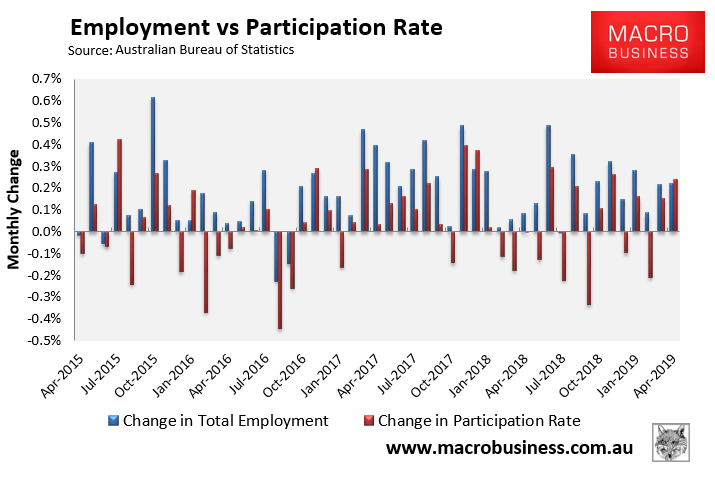
The participation rate rose by 0.16% to 65.85%, which is the reason why the unemployment rate rose:
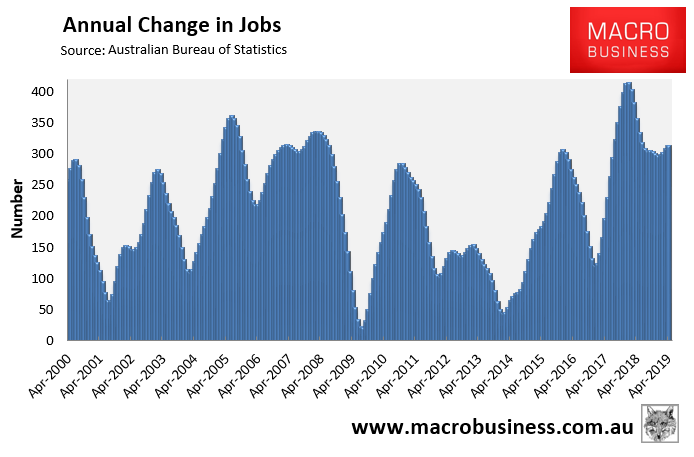
Total employment continues to trend higher, with actual annual jobs growth rebounding:
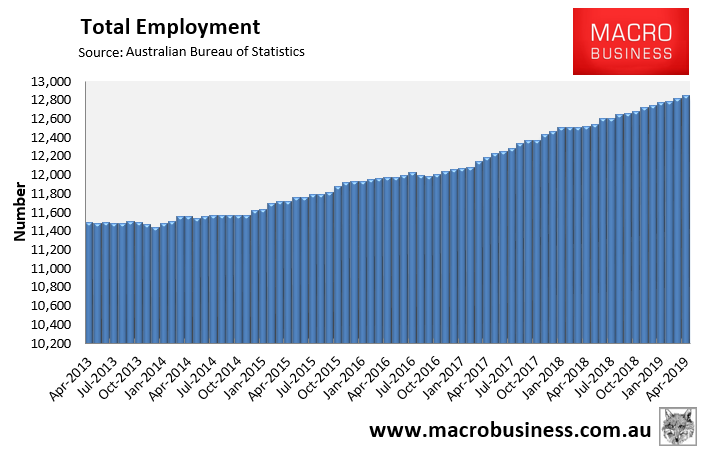
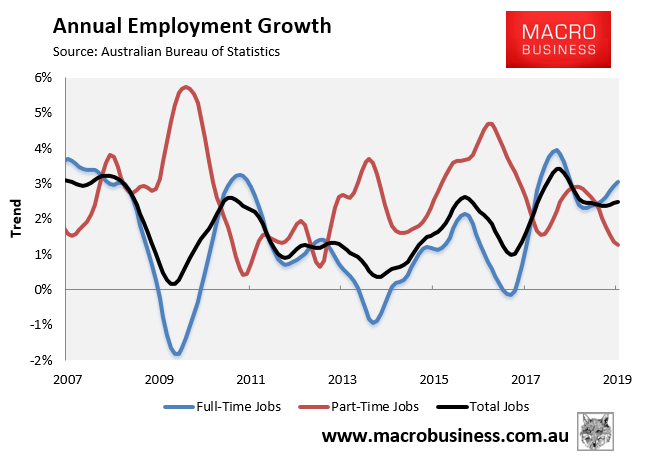
The trend annual growth rate is rising at 2.5%, with full-time employment rebounding (+3.1%) while part-time employment (+1.3%) is fading:
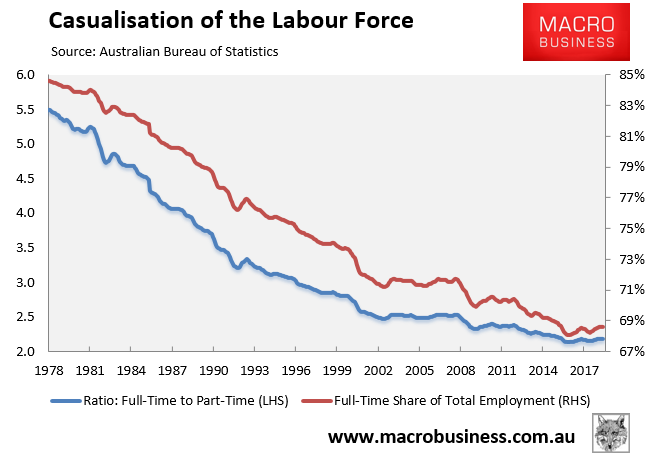
The proportion of the population in full-time work is slowly rebounding from all-time lows:
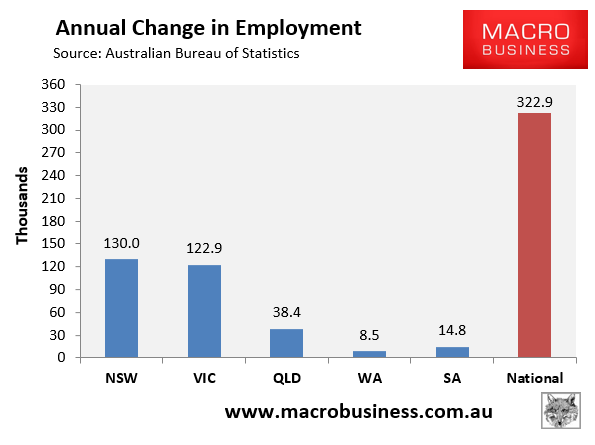
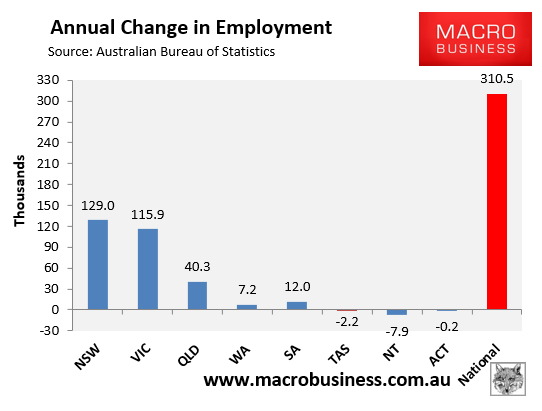
In April, the major eastern states easily led jobs growth over the past year in seasonally-adjusted terms:
The state seasonally-adjusted figures are notoriously volatile and subject to a big margin of error. As such, the below chart tracks state jobs growth in trend terms. Here, NSW and VIC have once again driven the jobs growth:
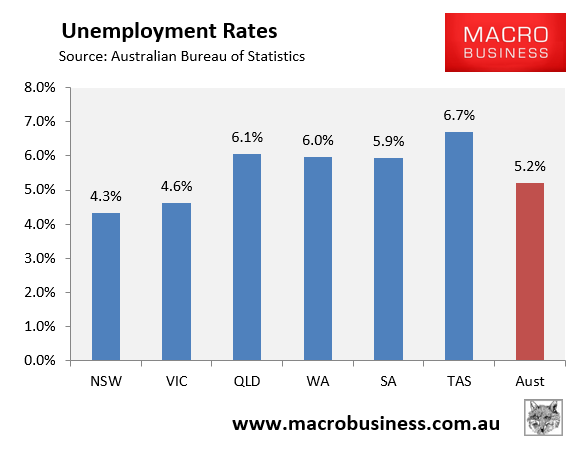
TAS and QLD have the highest seasonally adjusted unemployment and NSW and VIC the lowest:
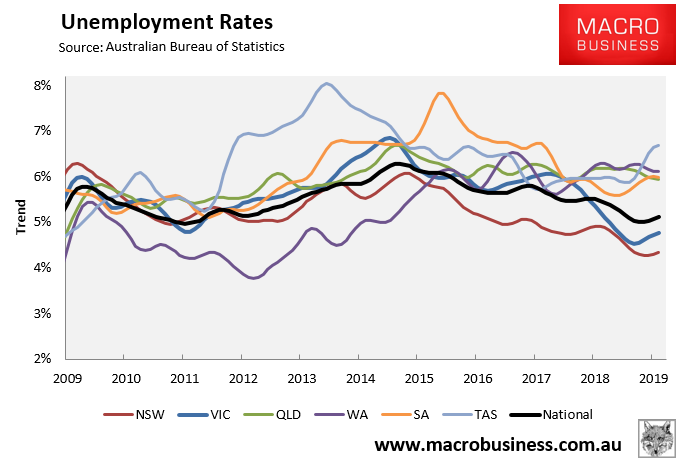
The below chart shows the ABS’ more reliable trend unemployment rates, which shows NSW and VIC with the lowest unemployment and WA and TAS with the highest:
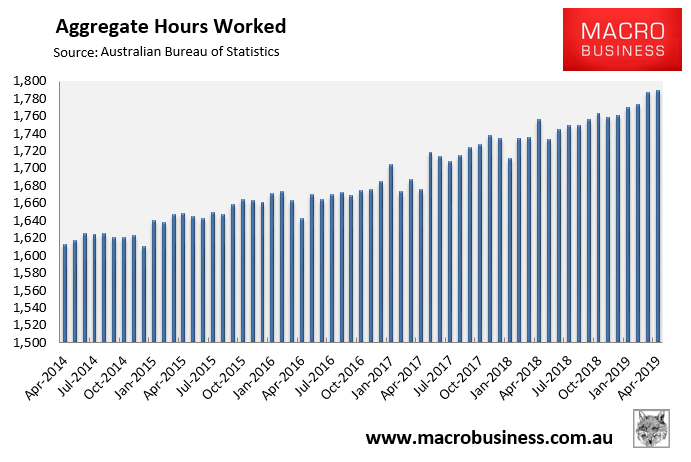
The aggregate number of hours worked rose by 2.5 million hours (0.14%) in April, with total hours worked rising 1.9% over the past year:
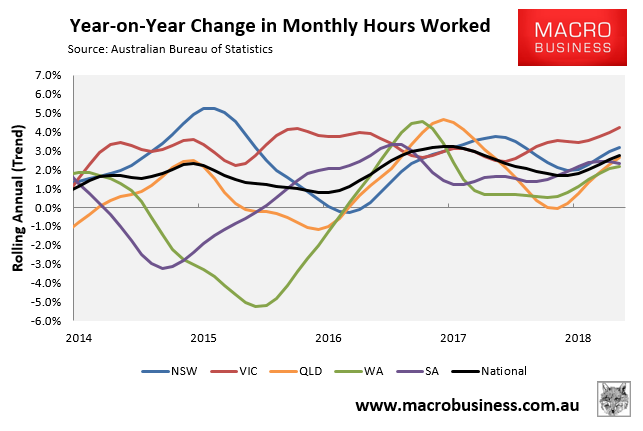
The below chart, which tracks the annual change in hours worked on a trend basis, paints a mixed picture, with differing growth across jurisdictions and 2.8% growth recorded nationally and trending upwards:
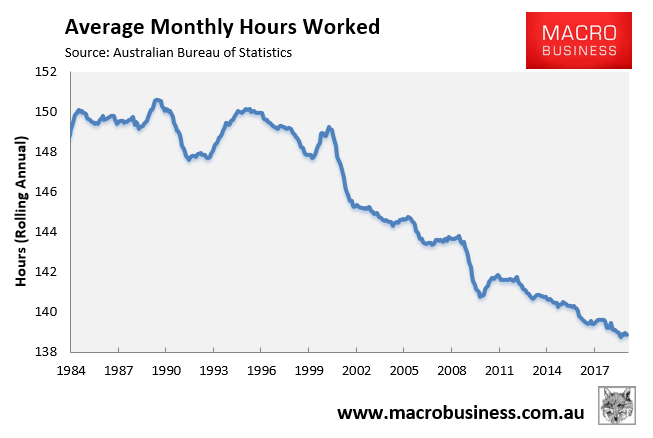
Average hours worked is fading again:
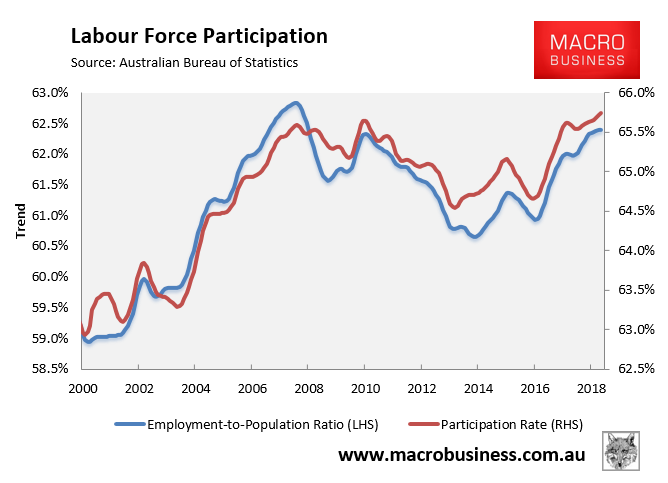
Workforce participation is still tracking near all-time highs in trend terms:
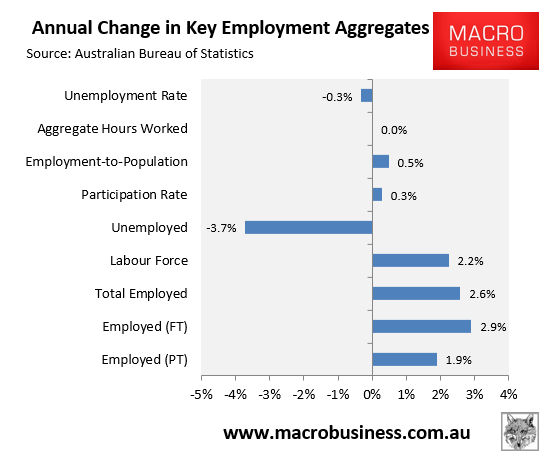
The next chart summarises the annual change in the key employment aggregates on a seasonally-adjusted basis, which shows a broadly improved labour market:
Finally, the ABS has switched to monthly reporting of underemployment and labour underutilisation. This shows a deterioration in the underemployment and underutilisation rate:
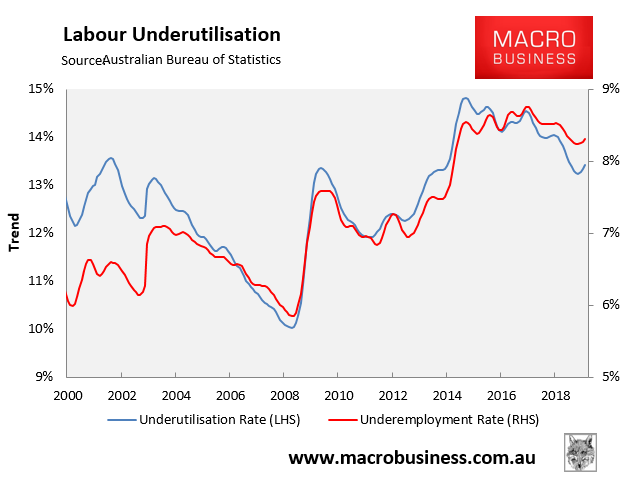
Given the strong correlation between underemployment and wages growth, this suggests that wages will remain in the gutter in spite of the strong jobs growth.
Moreover, with the housing market experiencing crashing prices, sales and approvals, and most leading indicators pointing to weaker jobs growth, it’s only a matter of time before jobs growth craters and unemployment rises.
unconventionaleconomist@hotmail.com
