How US shale controls oil prices

Advertisement

It is captured in this one chart from Art Berman:

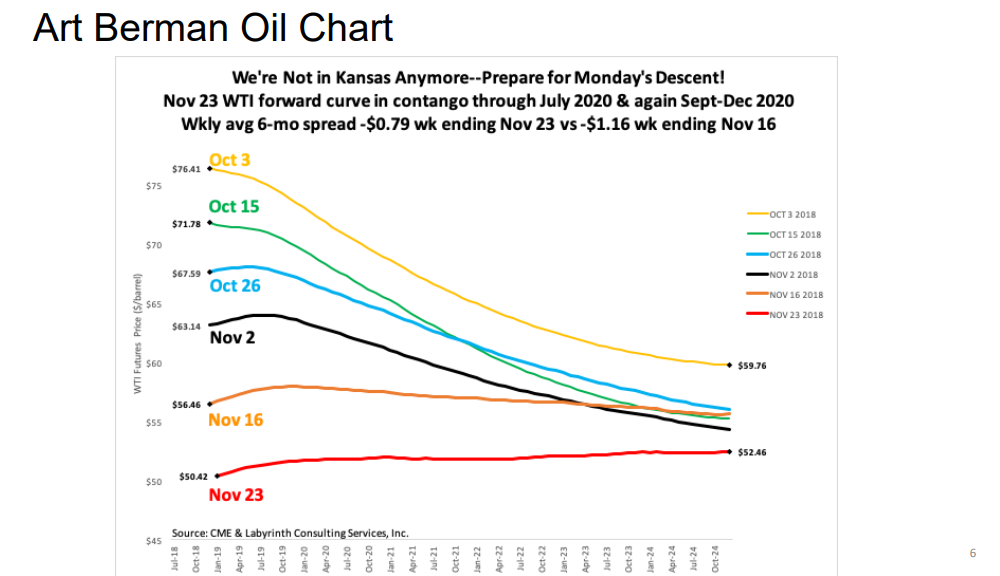
This one chart is the US shale revolution in global oil markets. What it shows is the forward curve for oil sales over time. As you can see, the curve has been smashed lower and flatter in recent weeks.

What US shale does is find a pot of money for rigs and drilling. It then forward sells roughly the same amount of oil to cover that cost. It can then pocket any remaining remaining profit from the cash flow of any given well. That’s why the curve is always in steep backwardation.

Advertisement

The full text of this article is available to MacroBusiness subscribers

$1 for your first month, then:
Cancel at any time through our billing provider, Stripe
About the author
David Llewellyn-Smith is Chief Strategist at the MB Fund and MB Super. David is the founding publisher and editor of MacroBusiness and was the founding publisher and global economy editor of The Diplomat, the Asia Pacific’s leading geo-politics and economics portal. He is also a former gold trader and economic commentator at The Sydney Morning Herald, The Age, the ABC and Business Spectator. He is the co-author of The Great Crash of 2008 with Ross Garnaut and was the editor of the second Garnaut Climate Change Review.