
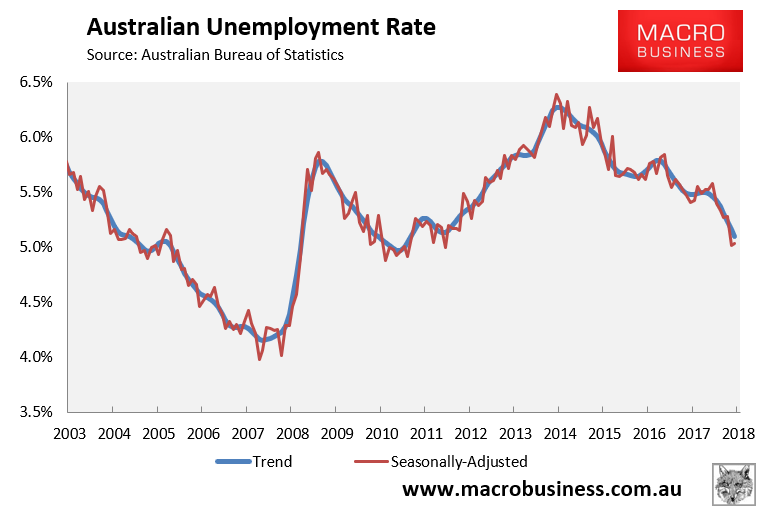
As summarised earlier, the Australian Bureau of Statistics (ABS) today released its labour force report for October, which registered a solid 32,800 increase in total employment but no change in the headline unemployment rate (still 5.0%), driven by a 0.1% rebound in labour force participation.
In trend terms, the unemployment rate fell marginally from 5.16% to 5.10% – a six year low:
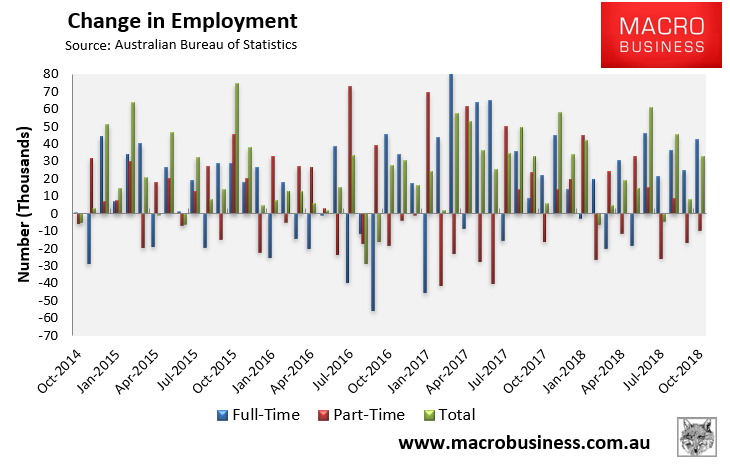
Again, total employment rose by a seasonally adjusted 32,800 to 12,671,500. Full-time jobs increased by 42,300, whereas part-time employment decreased by 9,500:
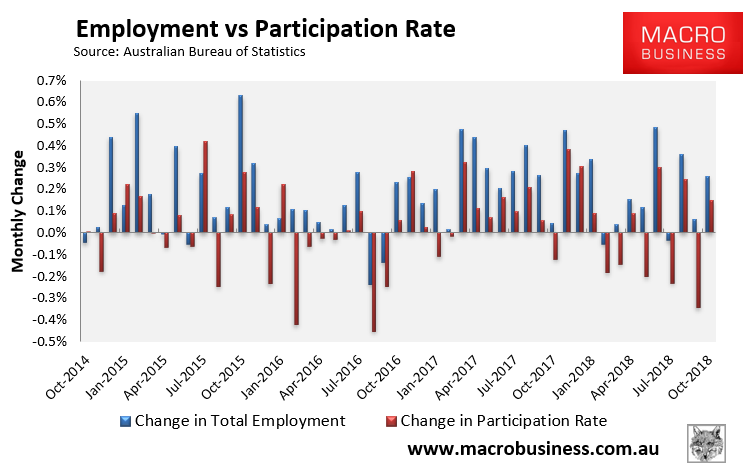
The participation rate rebounded by 0.10% to 65.56%, which is the main reason why the unemployment rate remained steady despite solid jobs growth:
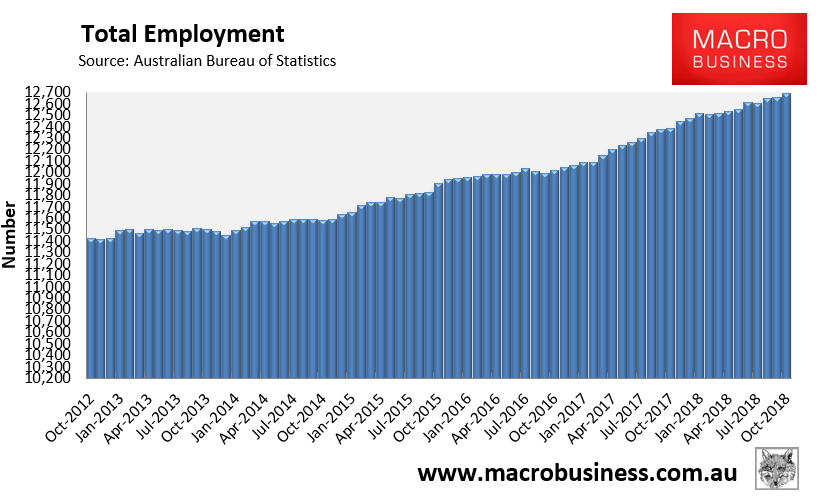
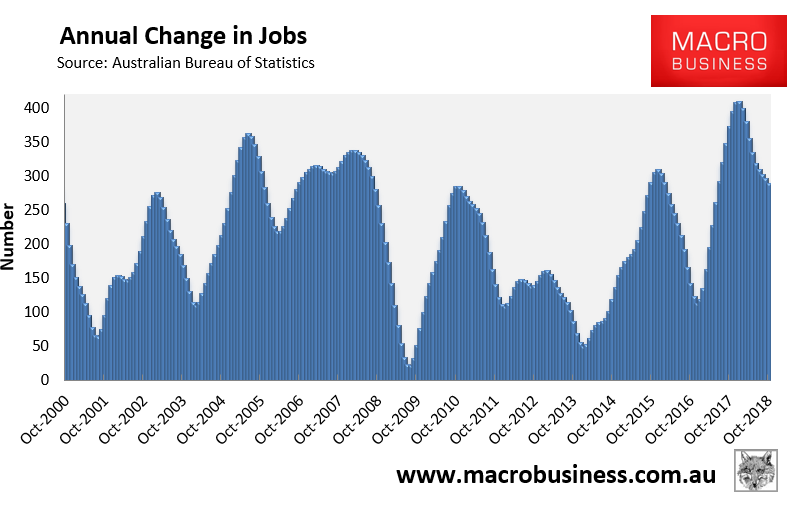
Total employment continues to trend higher, although actual annual jobs growth is falling:
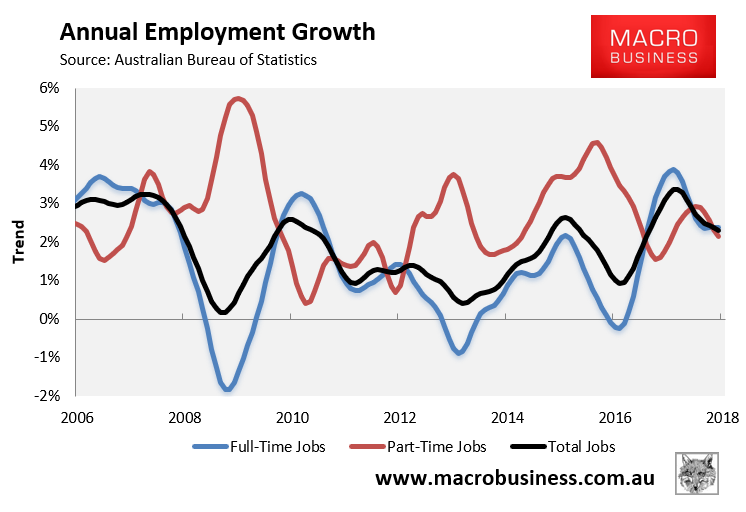
The trend annual growth rate has faded to 2.3% on the back of softening part time jobs (+2.1%), with full-time jobs growing more quickly (+2.4%):
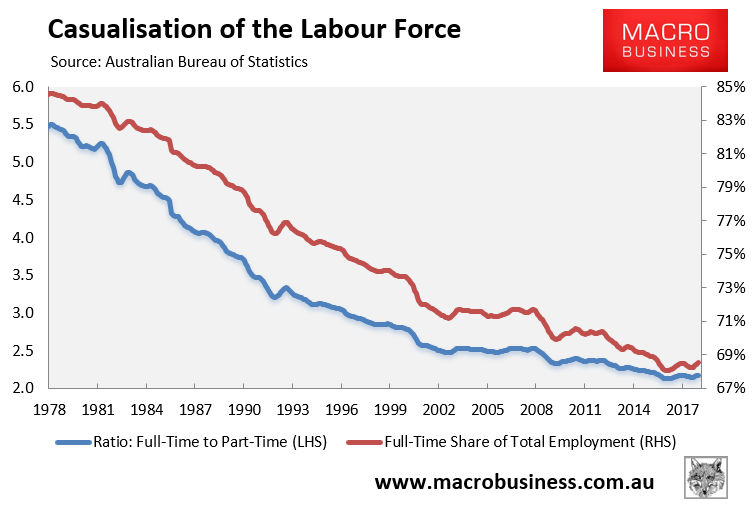
The proportion of the population in full-time work has rebounded a little:
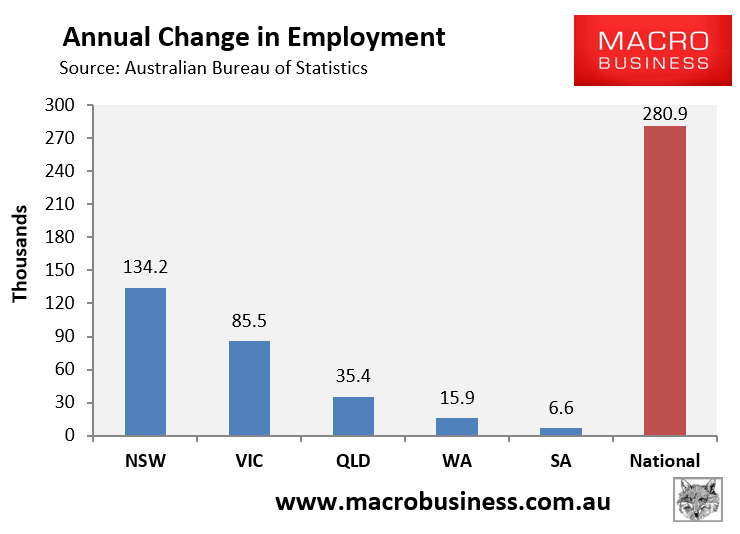
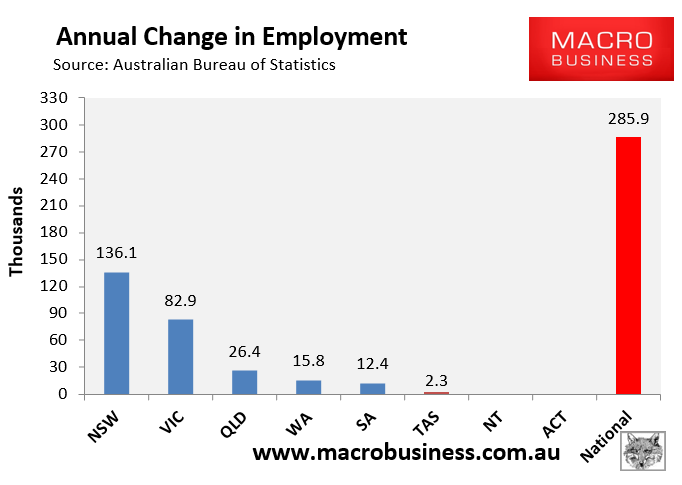
In October, NSW easily led jobs growth over the past year in seasonally-adjusted terms:
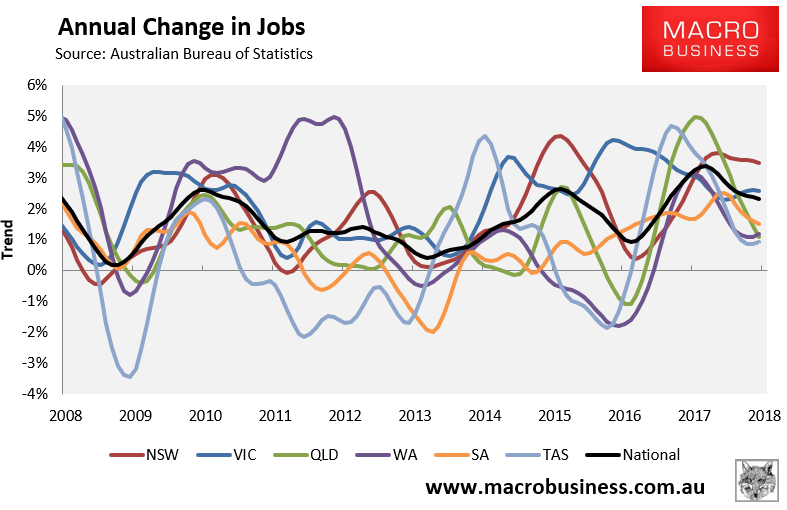
The state seasonally-adjusted figures are notoriously volatile and subject to a big margin of error. As such, the below chart tracks state jobs growth in trend terms. Here, NSW has once again driven the jobs growth, followed by Victoria:
All states are experiencing annual jobs growth in trend terms, although growth is mixed across most jurisdictions:
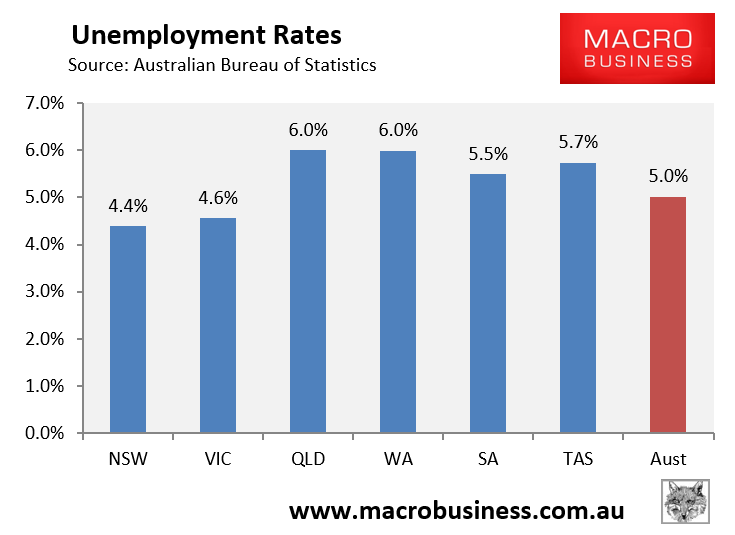
QLD and WA now have the highest seasonally adjusted unemployment and NSW and VIC the lowest:
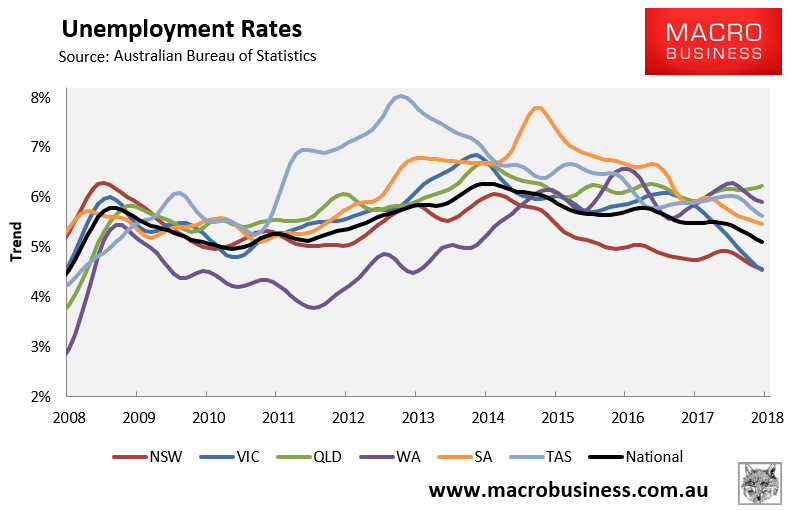
The below chart shows the ABS’ more reliable trend unemployment rates, which again shows NSW and VIC with the lowest unemployment and QLD and WA with the highest:
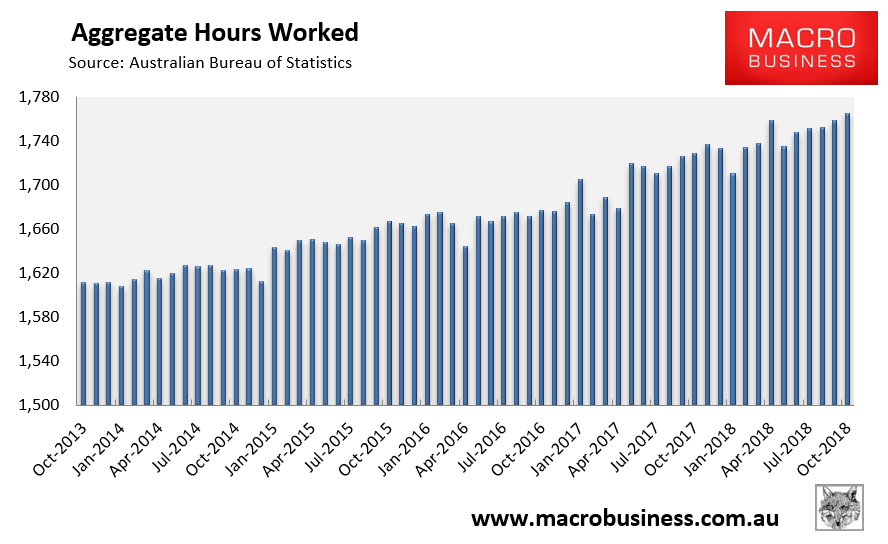
The aggregate number of hours worked has finally recovered from May’s heavy fall. It rose 6.1 million hours (0.35%) in October, with total hours worked rising by a solid 2.1% over the past year:
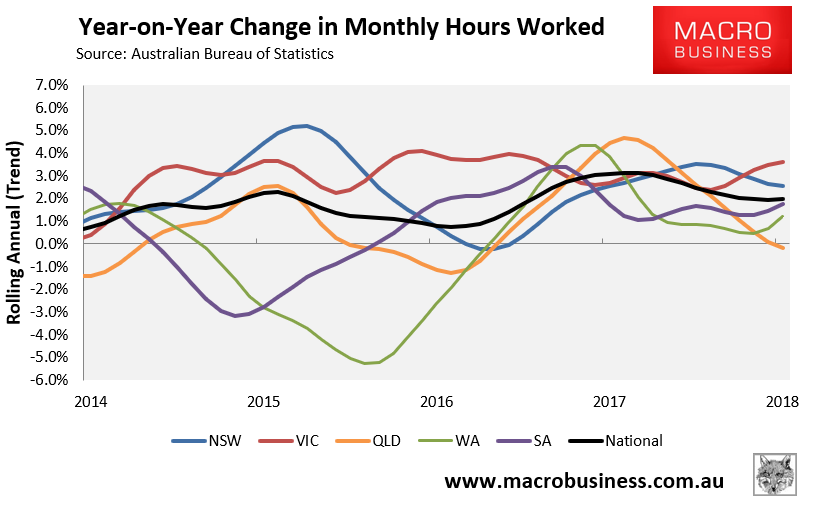
The below chart, which tracks the annual change in hours worked on a trend basis, paints a mixed picture, with differing growth across jurisdictions but 2.0% growth recorded nationally, with a stable trend:
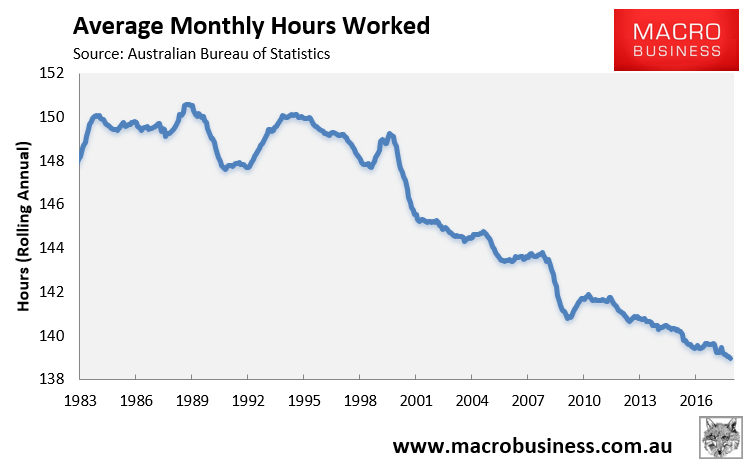
Average hours worked is stuck near all-time lows:
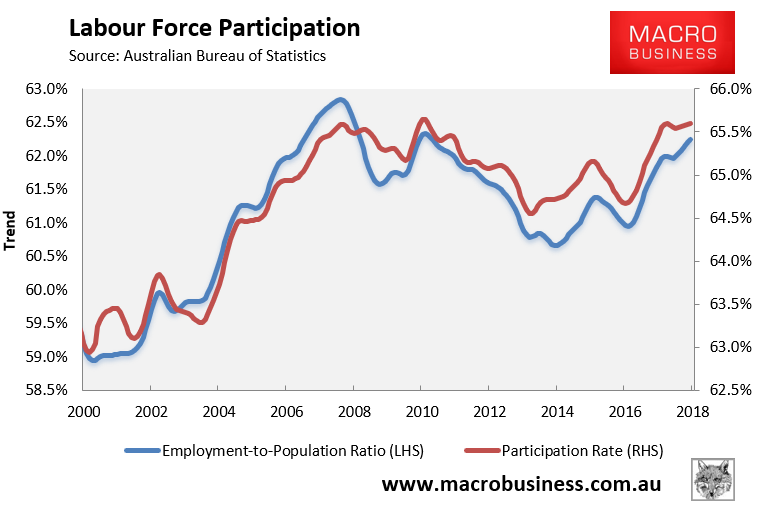
However, workforce participation is tracking near all-time highs in trend terms:
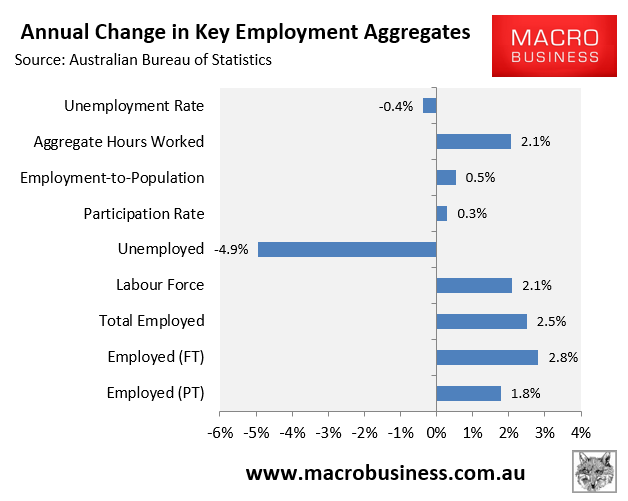
The next chart summarises the annual change in the key employment aggregates on a seasonally-adjusted basis, which shows a broadly recovered labour market:
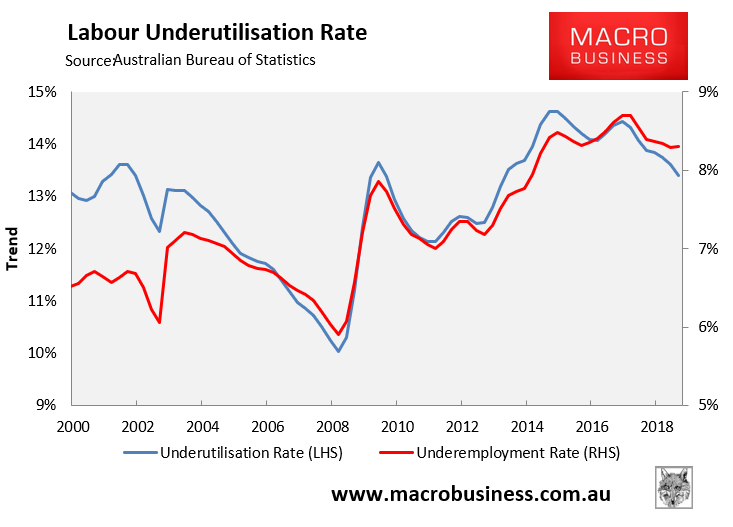
And finally, the ABS has switched to monthly reporting of underemployment and labour underutilisation. This shows a modest improvement in the underutilisation rate but little improvement in underemployment:
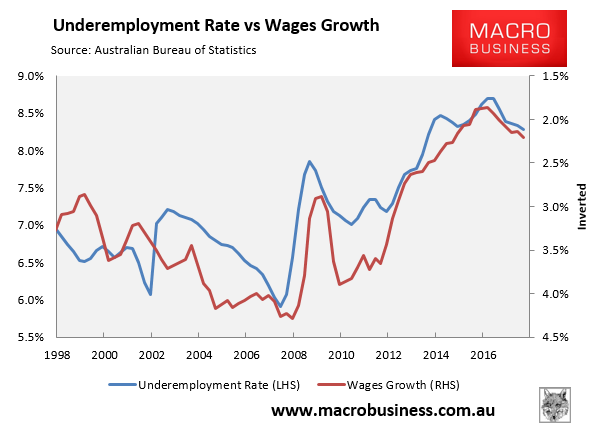
This augers badly for wages growth given wages are most strongly correlated with the underemployment rate:
The data suggests that Australia’s labour market is humming along quite well. Albeit, not at a pace necessary to suck up the labour market slack and accelerate wages growth.
