AMP’s, Shane Oliver published a piece in which he revised up his expectations of the housing price correction from peak to trough to 20% in Sydney and Melbourne, and 10% nationally, a downgrade from their previous expectation for a 5% national average fall.
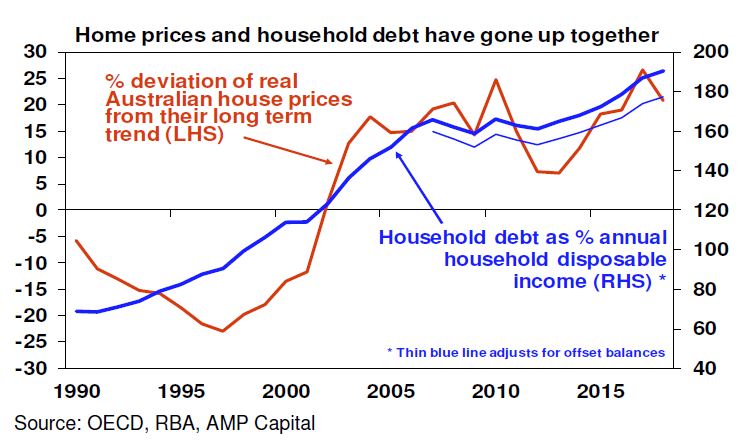
He has, along with a number of other economists progressively raised his expectations of the falls across the market as new data comes to hand. And specifically, he highlights the link between climbing home prices and credit availability. He says “this has taken the household debt to income ratio from the low end of OECD countries to the top end. The shift to overvaluation and high debt mostly occurred over the 1995-2005 period”.
We have taken his projections and run them across our Core Market Model. If his forecast were to eventuate, we think around 17% of borrowing households would fall into negative equity – meaning their outstanding mortgage would be greater than their property value.
Negative equity is tricky, because it limits households ability to refinance, trade up or down, as well have reducing overall economic activity and confidence. After the GFC, we saw many households in the UK locked into their properties for several years, the same could happen here.
In addition, of course there are implications for the banks (should they be adjusting their risk and capital models?) as well as for Lenders Mortgage Insurers, who cover the banks exposures above 80% of loan to value, unless they are covered by their captive insurers. In a falling market the insurers would likely be hit with higher levels of claims. Note of course there is not a one to one link between property price falls and defaults, the risks are much more complex.
But the results from our modelling are worth looking at in more detail, remembering we are using data from our household surveys and other sources. Around 560,000 households would be impacted, and we can slice and dice the data to begin to understand their profiles.
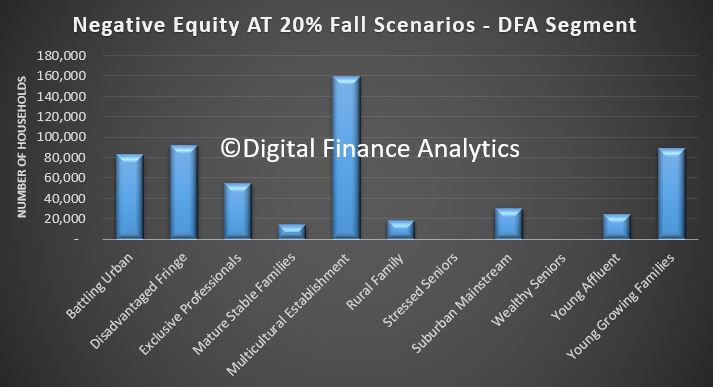
Our core segmentation highlights that Multicultural and Young Families would be hit most severely, in terms of the numbers of households in negative equity, with the Battling Urban and Disadvantaged Fringe following closely. But we also see a fair number of affluent households also caught in a negative equity trap. They are often highly leveraged.
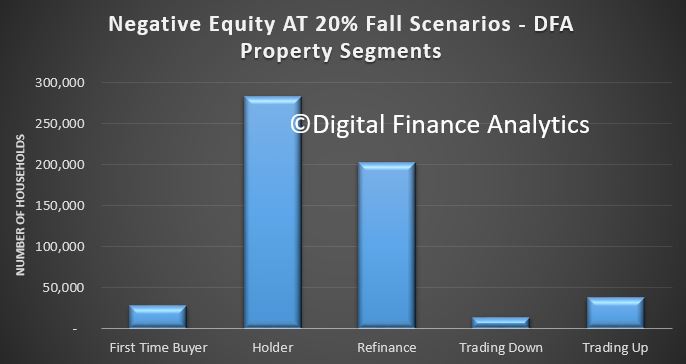
Across our property segments, those holding property without an intent to trade up or down figure as the largest sector, plus those who have refinanced recently. The first time buyer cohort also shows up, but this is a smaller count.
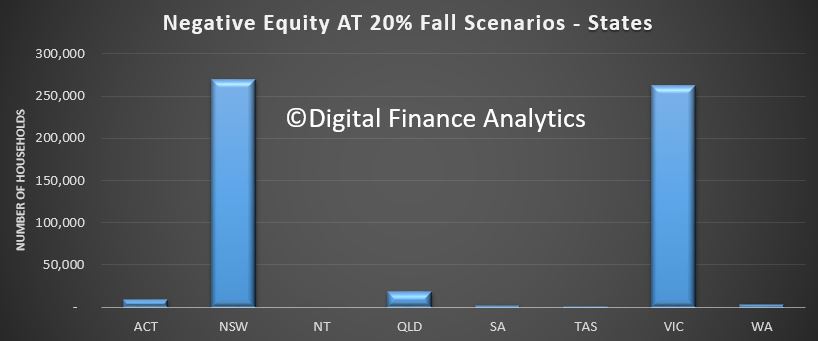
Two states NSW and VIC see the bulk of the negative equity, both states with a strong recent run in prices, and now significant reversals. AMP says 20% falls are likely here.
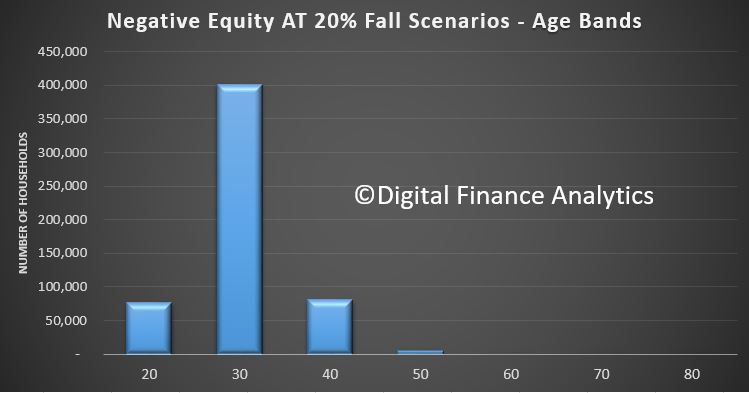
Across the age bands, it is younger households who are most exposed.
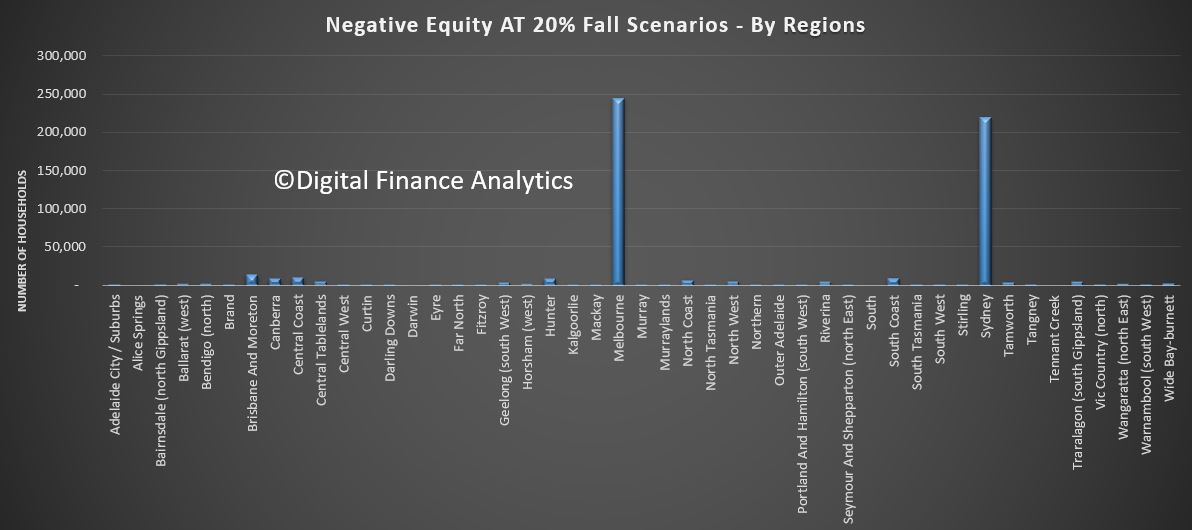
We can also see the more granular regional view showing the same.
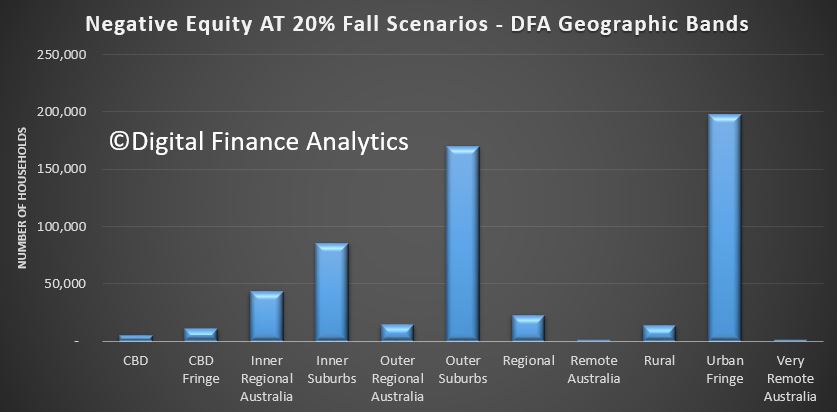
Looking across are geographic bands, we see the urban fringe and outer suburban rings most impacted.
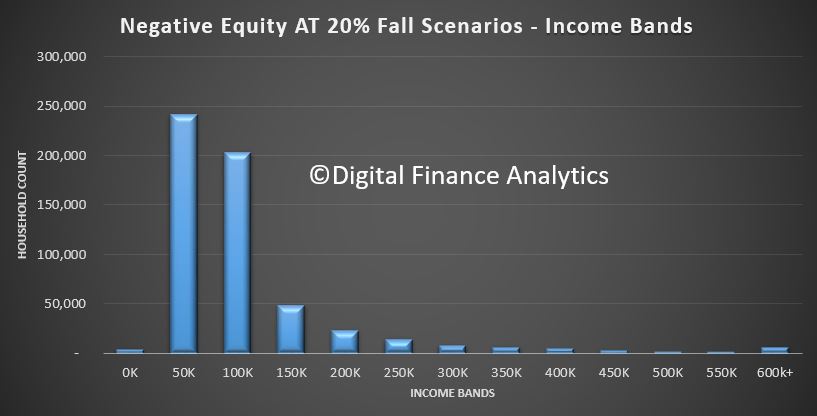
Finally, in terms of income bands, those in the $50-100k and $100-150k bands are most strongly represented.
So, in a nutshell, younger households with more limited incomes are more likely to be exposed to negative equity, especially if they live in the main urban centres of Sydney and Melbourne, and they are more likely to be located in the outer suburban rings.
And finally, if we ran a uniform 20% fall across the country, the number impacted would more than double. Personally I think the smaller centres are also likely to fall further. But we will see!
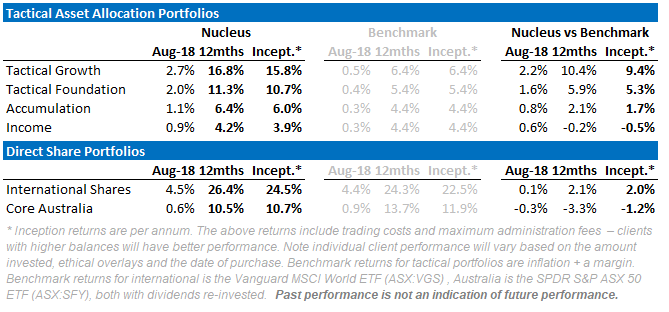
David Llewellyn-Smith is chief strategist at the MB Fund and MB Super which is long US equities that will benefit from a falling Australian dollar so he is definitely talking his book (or Shane Oliver is!). Below is the performance of the MB Fund since inception:
If the ideas above interest you then contact us below.
David Llewellyn-Smith is Chief Strategist at the MB Fund and MB Super. David is the founding publisher and editor of MacroBusiness and was the founding publisher and global economy editor of The Diplomat, the Asia Pacific’s leading geo-politics and economics portal.
He is also a former gold trader and economic commentator at The Sydney Morning Herald, The Age, the ABC and Business Spectator. He is the co-author of The Great Crash of 2008 with Ross Garnaut and was the editor of the second Garnaut Climate Change Review.

He has, along with a number of other economists progressively raised his expectations of the falls across the market as new data comes to hand. And specifically, he highlights the link between climbing home prices and credit availability. He says “this has taken the household debt to income ratio from the low end of OECD countries to the top end. The shift to overvaluation and high debt mostly occurred over the 1995-2005 period”.
We have taken his projections and run them across our Core Market Model. If his forecast were to eventuate, we think around 17% of borrowing households would fall into negative equity – meaning their outstanding mortgage would be greater than their property value.

Across our property segments, those holding property without an intent to trade up or down figure as the largest sector, plus those who have refinanced recently. The first time buyer cohort also shows up, but this is a smaller count.

Two states NSW and VIC see the bulk of the negative equity, both states with a strong recent run in prices, and now significant reversals. AMP says 20% falls are likely here.

Across the age bands, it is younger households who are most exposed.

We can also see the more granular regional view showing the same.
Looking across are geographic bands, we see the urban fringe and outer suburban rings most impacted.

So, in a nutshell, younger households with more limited incomes are more likely to be exposed to negative equity, especially if they live in the main urban centres of Sydney and Melbourne, and they are more likely to be located in the outer suburban rings.