…a new Reserve Bank paper has lifted the lid on what it’s like for young people entering the workforce today.
…History shows that at times of weakness in the economy, the two jobless rates tend to diverge. Indeed, in times of weakness, the youth jobless rate tends to move up twice as much as the general rate.
Why? Although young workers are cheaper, they also have fewer skills and less experience and are often the first to be shown the door. As the Reserve Bank paper puts it: “The heightened sensititivity of younger workers to demand conditions may reflect a ‘last in, first out’ practice.”
Tougher economic times, as we are currently experiencing, also hit young workers in other ways. First, they are disproportionately more likely to be working in the service and retail sectors, which are inherently more cyclical.
And second, in recent times, employers have increasingly opted to reduce the hours of existing workers, rather than fire them. Because young people are already more likely to be working in part time positions, this leaves them more exposed to “underemployment”.
…The Reserve Bank paper also makes it clear that many younger Australians are finding it harder to make the leap from university to full-time employment.
So, in addition to expensive housing, younger Australians have yet another reason to question whether the current economic system is delivering outcomes in their favour.
It’s a good RBA paper. One of the reasons why is that it mentions what Jess Irvine won’t:
The large increase in net overseas migration over the past decade has added significantly to the supply of younger workers to the labour market. More than half of the net migrants to Australia in recent years have been people younger than 25 years old. This can be explained by the steady increase in student visa holders. There are currently around 350,000 students in Australia on temporary visas (Graph 6). There are some work restrictions around those on a temporary visa, which also includes those on working holidays. For example, foreign students are permitted to work a maximum of 40 hours per fortnight when their course is in session, and are unrestricted otherwise. Census data suggest that the participation rate of those younger people that have very recently migrated to Australia (2 years or less) is much lower than those who were either born in Australia or migrated some time ago. Furthermore, the unemployment rate of recent, younger migrants is also noticeably higher than for other young people. Taking these factors together, estimates based on the Australian Bureau of Statistics’ (ABS) Characteristics of Recent Migrants survey suggest that temporary visa holders aged 15–24 represented around 10 per cent of the total labour force for this age group in late 2016. This represents an increase of 2 percentage points from late 2010.
The question of how much the increased supply of foreign labour has affected labour market outcomes for incumbent younger workers in Australia is beyond the scope of this article. The fact that immigrants increase demand for goods and services (leading to an increase in labour demand) is an important factor in this assessment. A recent Productivity Commission paper found there was inconclusive evidence of younger incumbent workers being displaced by immigrant workers, in part because such a hypothesis is always difficult to test (Productivity Commission 2016).
Advertisement
Here is what inconclusive looks like when you pull your head out of your posterior:
The issue culminated in 2016 when the Senate Education and Employment References Committee released a scathing report entitled A National Disgrace: The Exploitation of Temporary Work Visa Holders, which documented systemic abuses of Australia’s temporary visa system for foreign workers.
Mid last year, ABC’s 7.30 Report ran a disturbing expose on the modern day slavery occurring across Australia.
Meanwhile, Fair Work Ombudsman (FWO), Natalie James, told Fairfax in August last year that people on visas continue to be exploited at an alarming rate, particularly those with limited English-language skills. It was also revealed that foreign workers are involved in more than three-quarters of legal cases initiated by the FWO against unscrupulous employers.
Then The ABC reported that Australia’s horticulture industry is at the centre of yet another migrant slave scandal, according to an Australian Parliamentary Inquiry into the issue.
The same Parliamentary Inquiry was told by an undercover Malaysian journalist that foreign workers in Victoria were “brainwashed” and trapped in debt to keep them on farms.
A recent UNSW Sydney and UTS survey painted the most damning picture of all, reporting that wages theft is endemic among international students, backpackers and other temporary migrants.
A few months ago, Fair Work warned that most of Western Sydney had become a virtual special economic zone in which two-thirds of businesses were underpaying workers, with the worst offenders being high-migrant areas.
Dr Bob Birrell from the Australian Population Research Institutelatest report, based on 2016 Census data, revealed that most recently arrived skilled migrants (i.e. arrived between 2011 and 2016) cannot find professional jobs, with only 24% of skilled migrants from Non-English-Speaking-Countries (who comprise 84% of the total skilled migrant intake) employed as professionals as of 2016, compared with 50% of skilled migrants from Main English-Speaking-Countries and 58% of the same aged Australian-born graduates. These results accord with a recent survey from the Bankwest Curtin Economics Centre, which found that 53% of skilled migrants in Western Australia said they are working in lower skilled jobs than before they arrived, with underemployment also rife.
The Australian Bureau of Statistics (ABS) latest Characteristics of Recent Migrants report, revealed that migrants have generally worse labour market outcomes than the Australian born population, with recent migrants and temporary residents having an unemployment rate of 7.4% versus 5.4% for the Australian born population, and lower labour force participation (69.8%) than the Australian born population (70.2%).
ABC Radio recently highlighted the absurdity of Australia’s ‘skilled’ migration program in which skilled migrants have grown increasingly frustrated at not being able to gain work in Australia despite leaving their homelands to fill so-called ‘skills shortages’. As a result, they are now demanding that taxpayers provide government-sponsored internships to help skilled migrants gain local experience, and a chance to work in their chosen field.
Then there is new research from the University of Sydney documenting the complete corruption of the temporary visas system, and arguing that Australia running a “de-facto low-skilled immigration policy” (also discussed here at the ABC).
Note that nearly all of these jobs are unskilled and competing with local youth. There’s more of it today at Jess Irvine’s own paper:
Domino’s Pizza Enterprises group chief executive Don Meij can’t guarantee that no worker at its 733 franchised stores is being underpaid, despite being updated on their sales every 15 seconds.
During an hour-long grilling in Melbourne on Friday at the Senate inquiry into the franchising sector, which was called partly in response to allegations of widespread wage fraud and visa scams at Domino’s stores, Mr Meij said it was a franchisee’s responsibility to hire, train and remunerate their workers.
“What we can do as a franchisor is educate them, and encourage people to bring us evidence of wrongdoing because we are very keen to act on it,” Mr Meij said.
I delivered pizza’s for a while as a kid. Now I’d have to compete with a coolie prepared to work for a negative wage as he pays the franchisee for his visa.
Indeed, it has gotten so bad that foreign youth is now flooding out, via the ABC:
Residents are abandoning Australia at record levels, according to new figures released by the Australian Bureau of Statistics.
Almost 85,000 people formally departed Australia in the final three months of 2017 — almost 9,000 more than in the same period in 2016.
But experts are unsure about exactly what is causing the increase.
The ABS measures a resident as someone who has been in Australia for 12 out of the past 16 months, so includes many foreign students and workers on temporary visas.
Anthony Grubb, director of demography at the ABS, said these “preliminary” figures show a “significant increase” in departures of foreign students.
Approximately one-third of departures in recent years have been Australian citizens moving overseas, while almost one-half are temporary visa holders like overseas students, foreign backpackers and 457 visa workers ending their stays.
“It may be that with the tightening of the criteria of employer nominations that there is less of a flow-on from previous 457 visas to permanent visas, and other temporary residents getting permanent resident visas through that route,” he said.
Hopefully the outflow will accelerate.
There is one more dimension to the hollowing out of youth Aussie labour that Jess Irvine fails to mention. It has been described many times by her stablemate, Ross Gittins, who is not so squeamish. It is that foreign labour destroys the motivation for business to train or up-skill local youth:
The fact is, if you’re going to run a massive citizenship export sector explicitly targeting youth in an economy with serious overcapacity, and allow it to destroy industrial relations standards to boot, then you’d have to be either utterly corrupt or a complete idiot to expect anything other than higher youth unemployment:
Jess, at least do us the favour of not pretending to care.
Here’s the full RBA paper:
Introduction
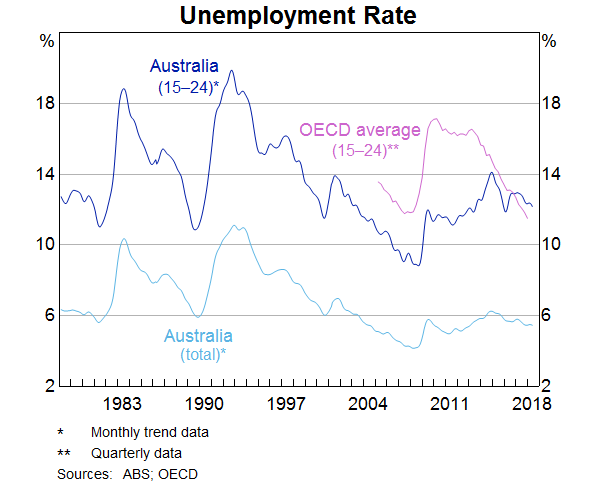
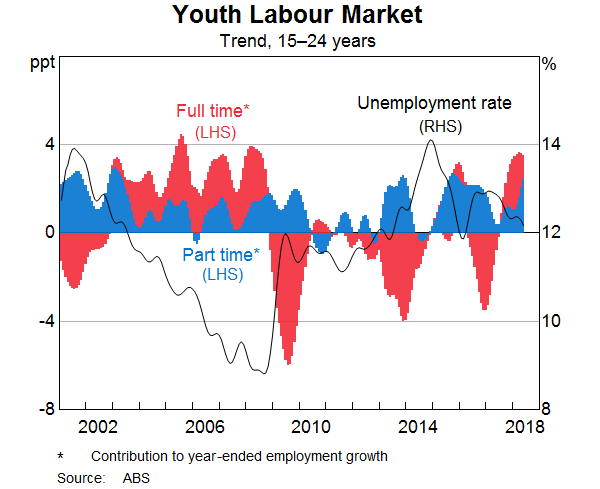
The unemployment rate for younger people in Australia (defined here as 15–24 year olds) has historically been higher than for the rest of the population; it is currently around 7 percentage points above the national unemployment rate (Graph 1). This difference tends to increase when economic conditions slow and narrow when conditions improve. In 2017, the unemployment rate for younger people in Australia was around 12½ per cent, and is now a little higher than the average of OECD economies.
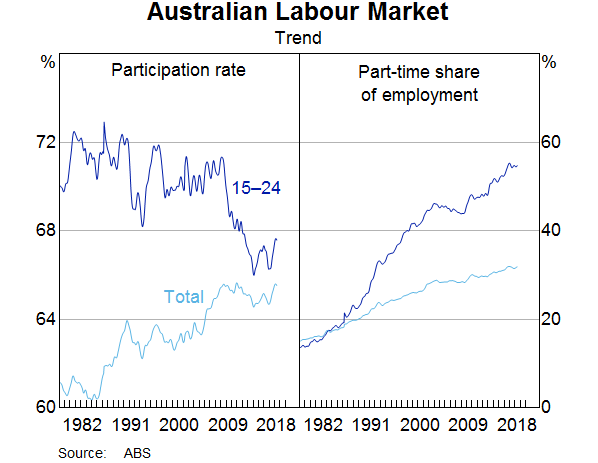
Over recent decades, labour market outcomes for younger people in Australia have changed significantly. This group now accounts for a lower share of the labour force – around 15 per cent, compared with around 25 per cent in the early 1980s – reflecting both the gradual ageing of the population and a decline in the participation rate of younger workers (although the participation rate of younger people in Australia is still well above the OECD average). The basis of young people’s employment has also changed noticeably; more than half now work part time, up from around 15 per cent in the early 1980s (Graph 2). Overall, around 55 per cent of younger workers were engaged in casual employment in 2017.[1]
The decrease in labour force participation and increased prevalence of part-time work for younger Australians is partly related to the increase in the share of 15–24 year olds who are studying full time. However, in recent years there has been a pronounced increase in the share of 20–24 year olds working part time who are not studying full time. This has been associated with a significant rise in the share of younger workers who are underemployed (that is, they want, and are available, to work additional hours). Furthermore, the share of 20–24 year olds that have become disengaged from either work or study has also increased over the past decade.
In the next section, we discuss some of the longer-run supply and demand factors that have been associated with these labour market outcomes for younger people in Australia. We then look at possible explanations for the rise in unemployment and underemployment for younger people over the past decade.
Graph 1
Graph 2
Labour Supply Developments
Changes to the supply of younger people to the labour force is driven by growth in their numbers as well as changes in their labour force participation rate. Two structural factors have been particularly important in explaining trends in the supply of younger workers; the increase in education attainment over recent decades and, more recently, an increased supply of younger migrants.
Increase in education attainment
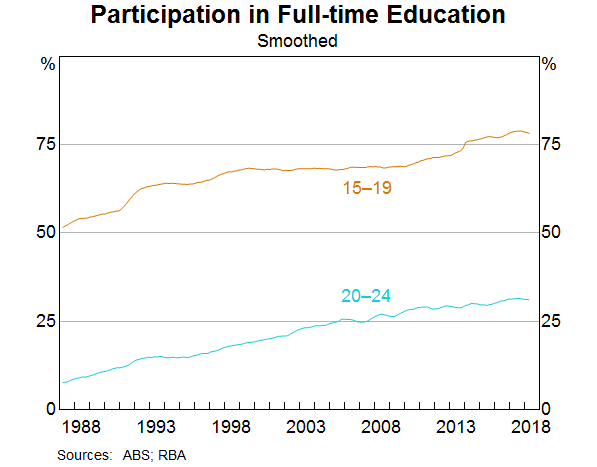
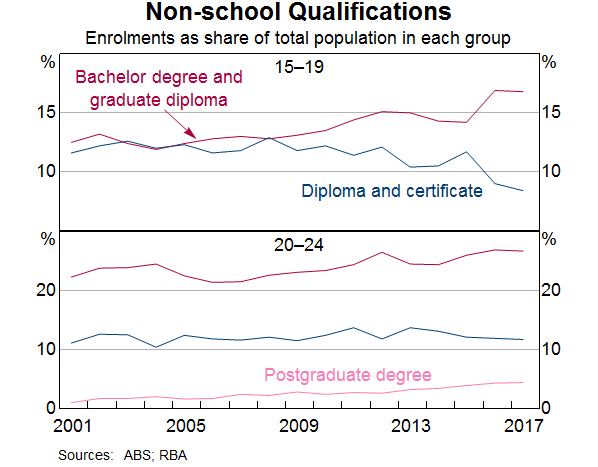
The share of 15–19 year olds enrolled in full-time education has increased from around one-half in the late 1980s to just over three-quarters. Similarly, over one-quarter of 20–24 year olds are currently enrolled in full-time education, from under 10 per cent in the late 1980s (Graph 3). The share of younger people enrolled at university has increased since the early 1980s, while the share enrolled in technical education or TAFE has declined. Currently around 30 per cent of 20-24 year olds are enrolled at university (Graph 4).
Graph 3
Graph 4
The increase in education attainment over recent decades has been a global phenomenon. This reflects the positive earnings returns from higher education for both the economy and the individual, as well as increased demand for workers with skills that complement technological change (Norton 2012; Oreopoulos and Petronijevic 2013 ). In Australia, the increase in years spent in education has been assisted by a number of government funding and policy reforms over the years. For example:[2]
‐ Various financial assistance schemes were introduced for secondary, adult secondary and tertiary students.
‐ Following the Dawkins White Paper of 1988, the higher education sector was reorganised to improve its capacity and effectiveness. The expansion was, in part, funded by the introduction of the Higher Education Contributions Scheme (HECS).
‐ In 2010, year 10 completion and full-time participation in education, training and/or employment until age 17 was made mandatory for all young people. The Australian Government also strengthened the participation requirements for recipients of the Youth Allowance.
‐ Between 2010 and 2012, the Australian Government removed the caps on undergraduate university places by introducing a demand-driven system for domestic students. The series of changes to the system led to a pick-up in university enrolments rates for younger people.
‐ Several policy reforms have been introduced in the Vocational Education and Training sector, including student loans and training models that are responsive to changes in demand for certain skills.
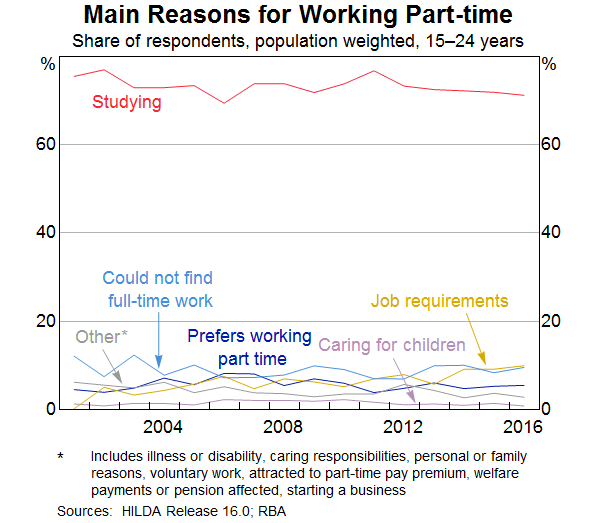
The increase in education attainment has been associated with a decrease in hours worked by younger people, including the large increase in the prevalence of part-time work. Data from the Household, Income and Labour Dynamics in Australia (HILDA) Survey suggest that over 70 per cent of the younger people who work part time do so because of a preference to combine work and study (Graph 5).
Some researchers suggest that the rise in education attainment in Australia can also be related to the decline in full-time employment opportunities for younger people (Larum and Beggs 1989; Lewis and Koshy 1998; Wooden 1998). For instance, if the probability of finding work is perceived to be relatively low, young people may be more likely to opt to continue their education. However, it is difficult to disentangle the overall impact of education policies and cyclical factors on young people’s decisions around work and study. For example, the participation rate of 15–19 year olds fell sharply between 2008 and 2014, at the same time as when the unemployment rate for younger people was generally rising. However, the decline probably also reflected the marked increase in the share of students staying in high school past Year 10 and/or going on to university following the policy changes mentioned above.
Graph 5
Graph 6
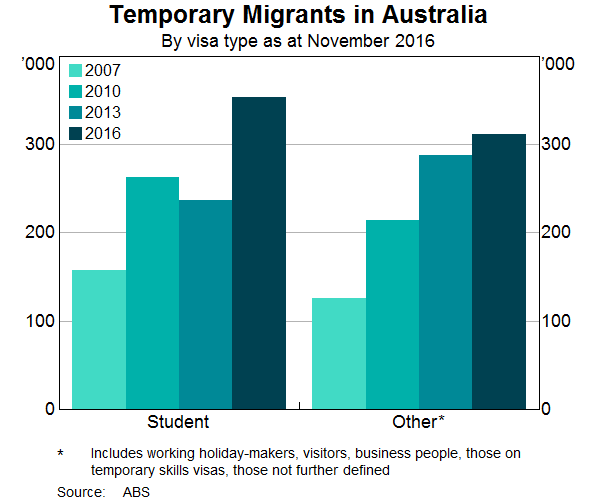
Migration
The large increase in net overseas migration over the past decade has added significantly to the supply of younger workers to the labour market. More than half of the net migrants to Australia in recent years have been people younger than 25 years old. This can be explained by the steady increase in student visa holders. There are currently around 350,000 students in Australia on temporary visas (Graph 6). There are some work restrictions around those on a temporary visa, which also includes those on working holidays. For example, foreign students are permitted to work a maximum of 40 hours per fortnight when their course is in session, and are unrestricted otherwise. Census data suggest that the participation rate of those younger people that have very recently migrated to Australia (2 years or less) is much lower than those who were either born in Australia or migrated some time ago. Furthermore, the unemployment rate of recent, younger migrants is also noticeably higher than for other young people. Taking these factors together, estimates based on the Australian Bureau of Statistics’ (ABS) Characteristics of Recent Migrants survey suggest that temporary visa holders aged 15–24 represented around 10 per cent of the total labour force for this age group in late 2016. This represents an increase of 2 percentage points from late 2010.
The question of how much the increased supply of foreign labour has affected labour market outcomes for incumbent younger workers in Australia is beyond the scope of this article. The fact that immigrants increase demand for goods and services (leading to an increase in labour demand) is an important factor in this assessment. A recent Productivity Commission paper found there was inconclusive evidence of younger incumbent workers being displaced by immigrant workers, in part because such a hypothesis is always difficult to test (Productivity Commission 2016).
Labour Demand Developments
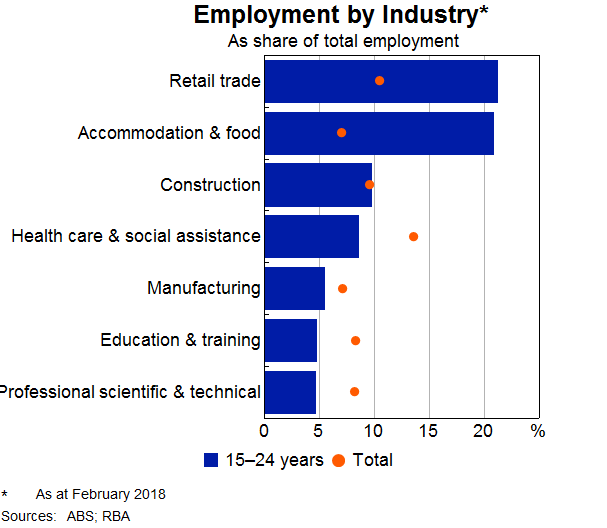
A number of longer-run labour demand factors have also contributed to changes in how younger people work; namely, the increase in, and availability of, part-time employment and the decline in full-time employment. The changing structure of the economy has contributed to the increase in the share of younger people working part time. As the economy has become more services oriented, there has been increased demand for workers in service industries such as tourism and hospitality. The nature of these jobs can involve irregular hours, which has meant that part-time work has become more common (Cassidy and Parsons 2016). These industries tend to have a larger share of younger workers (Graph 7). It may also be the case that technological change is influencing demand for younger workers. In particular, it is possible that the secular decline in demand for routine manual jobs and the automation of some entry-level or lower-skilled jobs may have limited the options for younger people to find full-time work.
Graph 7
Businesses are also increasing their reliance on part-time employment to improve business flexibility, particularly during cyclical downturns. Bishop, Gustafsson and Plumb (2016) found evidence to suggest that, since the 1990s, businesses have responded to changes in economic conditions by changing the hours worked by their employees rather than the number of employees. That is, businesses can decrease the hours worked by their employees during periods of slowing demand and this may have tempered the rise in unemployment during these periods. This is evident for the overall labour market as well as for the youth labour market, during both the 2001 slowdown and the financial crisis (Graph 8). The authors suggest this change has come about because of a range of factors, including the increased cost of hiring and training new employees and labour market reforms that have made bargaining directly with employees easier.
Graph 8
Spare Capacity in the Labour Market for Younger People
Unemployment
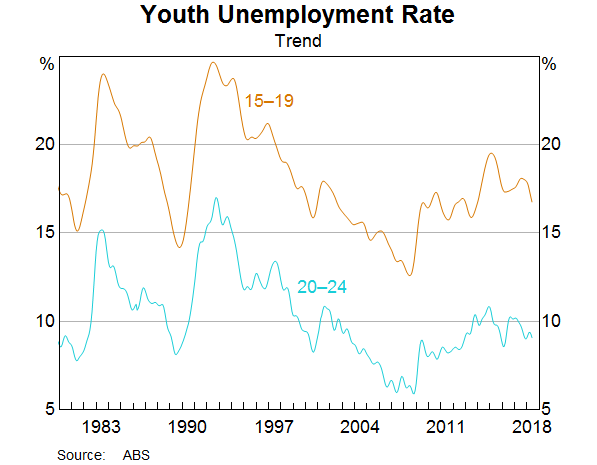
The unemployment rate for 15–24 year olds is currently around 12½ per cent. It has declined a little from its 2014 peak, but remains well above its 2008 low of around 9 per cent. In contrast, the OECD average unemployment rate for younger people has been steadily declining in recent years, albeit from a much higher rate, to below the Australian equivalent. The unemployment rate for 15–19 year olds is around 18 per cent and much higher than the 9 per cent unemployment rate for 20–24 year olds (Graph 9). However, nearly 70 per cent of unemployed 15–19 year olds are currently engaged in full-time education compared to around 25 per cent of unemployed 20–24 year olds.
The elevated level of the unemployment rate for younger workers is consistent with the fact that over the past decade there has been some spare capacity in the Australian labour market. Empirically, the unemployment rate for younger workers has a largely contemporaneous relationship with the overall unemployment rate but tends to move twice as much. The heightened sensitivity of younger workers to demand conditions may reflect a ‘last in, first out’ practice. Employers are also generally more reluctant to hire or even retain younger workers during periods of cyclical weakness because they tend to have less experience and lower skills. Furthermore, given that younger workers tend to be disproportionately concentrated in industries where the nature of work is quite cyclical, such as retail trade and food & accommodation, they will generally be more exposed to any weakness in demand for the firm’s output and consequently the firm’s demand for labour.[3]
Graph 9
Graph 10
Underemployment
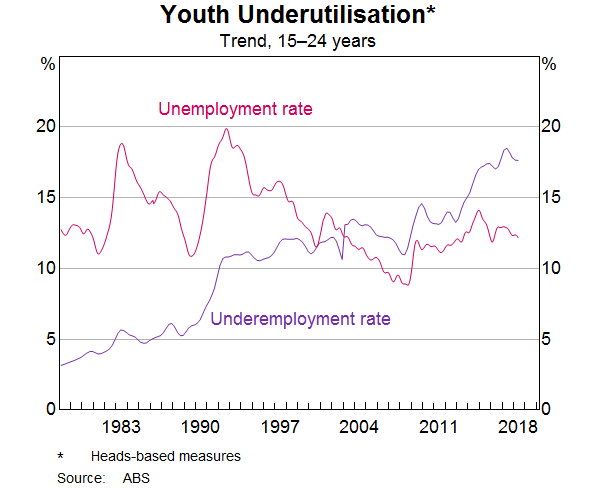
Over the past decade, there has been a rise in the share of underemployed younger workers, that is, a rise in the share of workers that are willing and able to work extra hours. This is perhaps not surprising, given a nearly 20 per cent decline in the level of full-time employment of younger workers over this period. Indeed, while the unemployment rate for younger workers has declined since its 2014 peak, the underemployment rate for this group is close to its record high (Graph 10). Furthermore, the gap between the underemployment rate for younger workers and the overall underemployment rate has widened more recently.
Underemployed younger workers, on average, have a preference to work an additional 11 hours each week. This is quite significant considering that the aggregate equivalent is only marginally higher (14 additional hours) and that many of these younger workers are also studying full time. Data from the HILDA survey suggest that the average gap between actual and preferred additional working hours by all younger workers has widened since 2010, and this increase has been more pronounced for non-students than students over recent years.
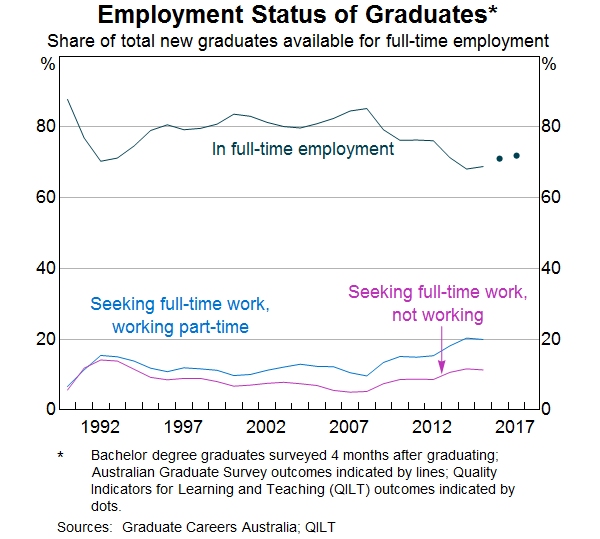
The rise in underemployment over the past decade is consistent with the increase in the share of 20–24 year olds that are working part-time but are not in full-time study (Graph 11). In part, this may reflect that the transition process from tertiary education to full-time work has slowed during this period. In the mid 1990s, around 80 per cent of all bachelor degree graduates available for full-time work entered the labour force on a full-time basis four months after graduating (Graph 12). This transition rate has been lower over the past decade; in 2017, just over 70 per cent of graduates had entered full-time employment after that same period. This is around the same level as was observed during the early 1990s recession. Related to this, 20 per cent of graduates working part-time were seeking more hours in 2017 (Quality Indicators for Learning and Teaching 2018).
Graph 11
Graph 12
It is difficult to know how much of this rise in underemployment and involuntary part-time work for younger workers over the past decade reflects cyclical or structural factors. There has tended to be ample spare capacity in the overall labour market over the past decade. However, the elevated levels of underemployment, despite the more recent strong growth in full-time jobs, suggest that some part of this trend in Australia could reflect more structural factors. Among these could be a mismatch between graduate skills and the current skills demanded, although analysis of this is beyond the scope of this article.
Disengagement with the labour market
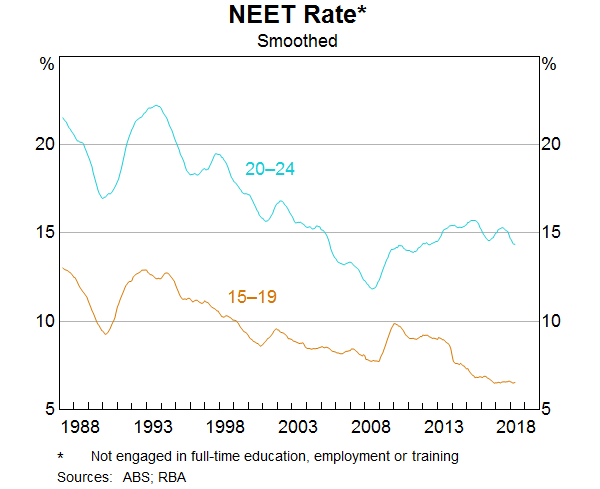
Another indication of spare capacity in the labour market for younger people is the increase in the share of young people that are neither engaged in employment nor full-time education or training (i.e. the not in education, employment or training (NEET) rate).[4] The NEET rates for both 15–19 and 20–24 year olds have declined over the past few decades as education attainment has broadened and females have increased participation in the labour force. However, consistent with other measures of labour market underutilisation, the NEET rate for 20–24 year olds has increased and is currently around its 2005 level (Graph 13). Notably, this most recent pick-up has been predominantly driven by younger males. The NEET rate for 15–19 year olds increased sharply during the global financial crisis, but has steadily declined since then as a result of increased education attainment for this group.
The OECD’s analysis of disengaged Australian young people (18–29 year olds) finds NEET rates to be higher for women, young people with disabilities, Indigenous youth and youth with lower levels of education attainment (OECD 2016). Some of the reasons for non-employment cited by those in the NEET category include a lack of jobs, lack of necessary qualifications or child caring responsibilities.[5]
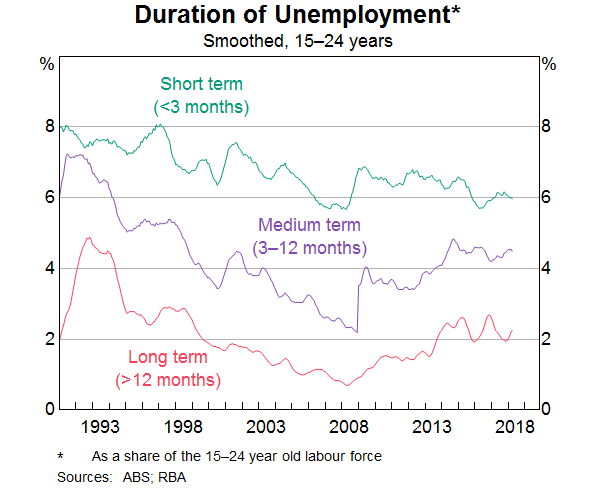
Even if the lack of jobs is cyclical and thus temporary, prolonged spells of disengagement from the labour market are known to have lasting effects. Around 4 per cent of the youth labour force has been unemployed for between 3–12 months, and a bit over 2 per cent have been unemployed for over one year. The long-term unemployment rate for younger workers has risen over the past decade, although it was around double this share in the early 1990s (Graph 14). Poor labour market outcomes early on not only affect an individual’s future employability but also have persistent negative effects on lifetime earnings. Studies in the United States find that a poor early labour market experience, particularly entry during a downturn, can reduce earnings for up to 10 years after graduation (Oreopoulos, von Wachter and Heisz 2012). Researchers also find that those who graduate in weak economic conditions are unable to fully shift into better jobs even once the economy picks up again (Kahn 2010). Watson (2018) finds a similar deterioration in labour market outcomes for those younger workers who entered the labour market in Australia after the global financial crisis compared to previous cohorts.
Overall, the elevated level of youth unemployment and the increasing share of 20–24 year olds working part time that have a preference for full-time work or are marginally attached suggest there is ample spare capacity in the labour market for younger workers.
Graph 13
Graph 14
Wages Growth for Younger Workers
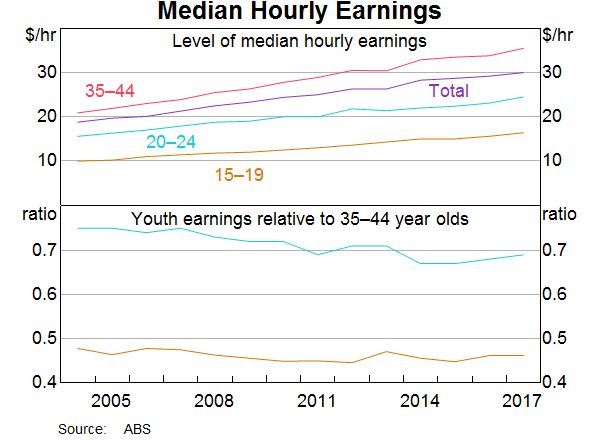
Given the average skills and work experience of younger workers, it is not surprising that the level of median hourly earnings across the economy is lowest for 15–19 year olds, followed by 20–24 year olds (Graph 15). Over one-third of younger workers have their rate of pay determined by the awards system, and they tend to work in lower-paying industries.
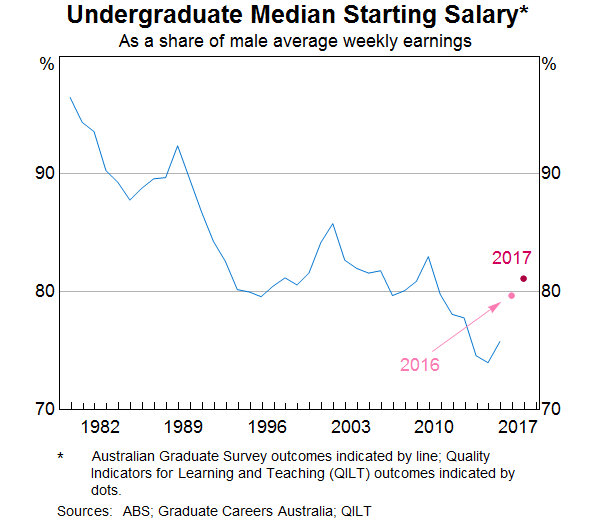
However, the gap between earnings of younger people and the highest paid age cohort(35–44 year olds) widened in the years following the global financial crisis, and has only recovered a little in recent years. The weaker earnings growth for 20–24 year olds is consistent with data that show starting salaries for university graduates declined between 2012 and 2015 and have only recently increased (Graph 16). Data from the HILDA survey also suggest that the earnings gap between those entering employment and those already working has widened in recent years.
Graph 15
Graph 16
Conclusion
The youth labour market is distinct from the overall labour market because younger workers are most likely to be new entrants transitioning into the workforce with minimal skills and experience. Accordingly, they are more exposed to cyclical swings in the economy than other parts of the labour market. They may also be more exposed to structural changes in the labour market. As such, the youth labour market can be a useful lens for understanding developments in the broader labour market. Over the past decade, there has been an increase in the share of 20–24 year olds working part time who have a preference for full-time work, which is consistent with the rising level of underemployment. Furthermore, the NEET rate for 20–24 year olds also remains around its highest level since the mid 2000s. Associated with this, the gap in earnings growth between younger workers and other workers has widened over the past decade.
David Llewellyn-Smith is Chief Strategist at the MB Fund and MB Super. David is the founding publisher and editor of MacroBusiness and was the founding publisher and global economy editor of The Diplomat, the Asia Pacific’s leading geo-politics and economics portal.
He is also a former gold trader and economic commentator at The Sydney Morning Herald, The Age, the ABC and Business Spectator. He is the co-author of The Great Crash of 2008 with Ross Garnaut and was the editor of the second Garnaut Climate Change Review.