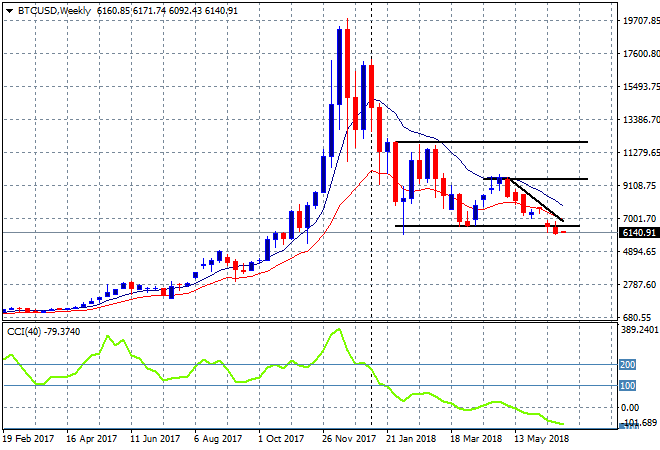
Like US gold holders, the cryptocurrency market had a bad week, with the headline darling Bitcoin breaching the $US6000 level, falling over 8% for the period with total market capitalization down over 13% according to CCN.
The weekly chart of Bitcoin resembles an absolute classic case of an asset bubble. Price performance since the start of the year is also a classic bearish descending triangle with a very clear support level at $6000, now breached:
Of course, comparisons are easy to make to other historical bubbles, with the NASDAQ apropos:
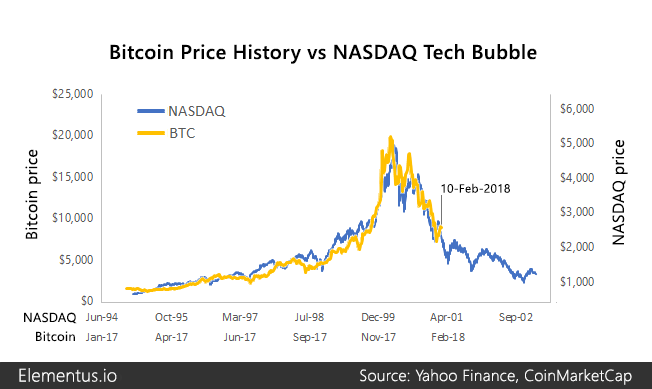
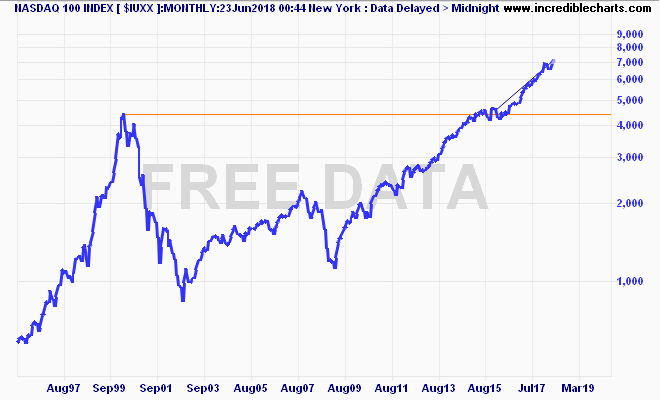
The problem with these comparison is that since the bubble burst on tech stocks, the NASDAQ took 14 years to recover its former nominal high and has now exceeded that level by another 60%:
A similar comparison was made with another asset, the volatile TOPIX, the broader Japanese stock index and close relative to the Nikkei 225: 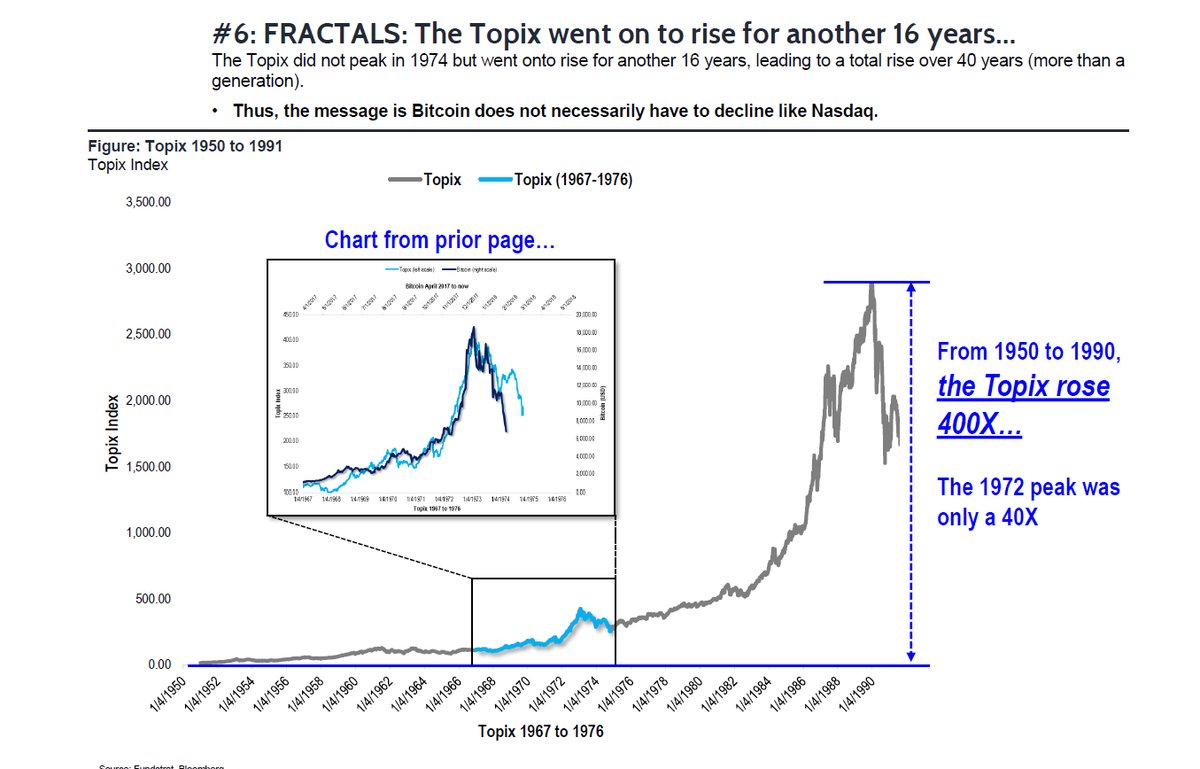
There is a fundamental difference that must be taken into consideration versus an absolute behavioural trait that speculative asset bubbles manifest. That is, while stock markets can be blown up high by a multitude of flighty issues – Pet.com comes to mind – the nature of capitalistic markets is that they clear out the failures, while the successes cling on and reorganise. Witness Google et al.
A bit harder to do with a single asset class, for example tulips or gold or a cryptocurrency. All of which have close to no intrinsic value, as opposed to an asset like stocks that actually can – but not always – create value.
I think this tweet sum’s up the current rise and fall of Bitcoin, or indeed anyone wishing for a speculative asset to “come back”:
Attn crypto traders. $BTC went from $1 to $19,000. If you’re not wealthy by now, you didn’t do it. You missed. You completely struck out on the greatest run in the last several hundred years. Stop acting like you know what you are doing and you’re a strong holder now. You suck.
— Gaston Mendez (@xpander4) June 24, 2018
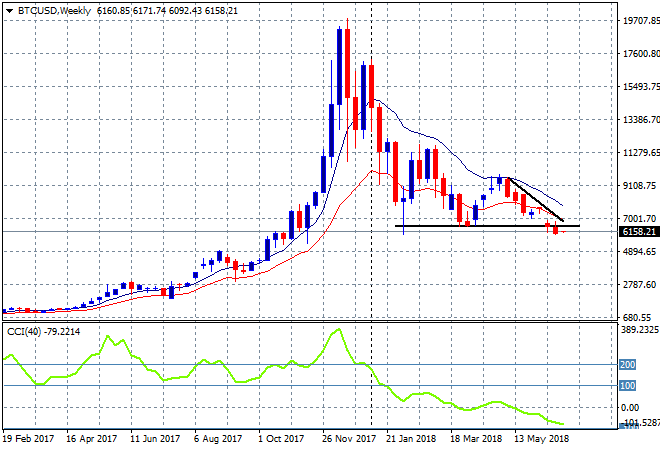
If you’re willing to speculate on the next rise on Bitcoin, picking bottoms should be left to monkeys. It may take time or not happen at all – but don’t start to get interested until price comes back to previous resistance levels at $9500 and $11500: