
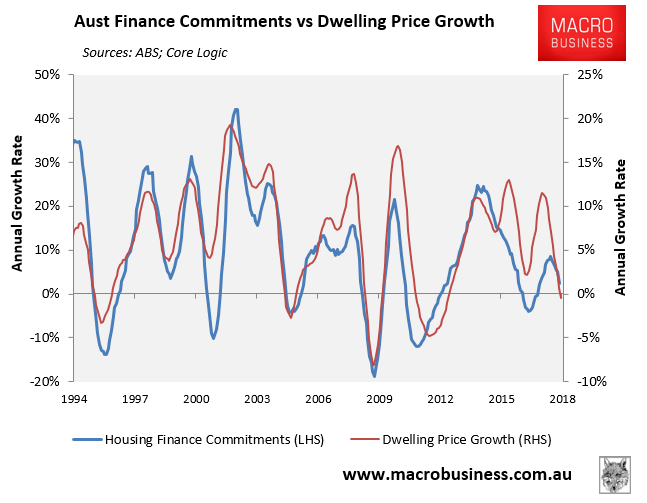
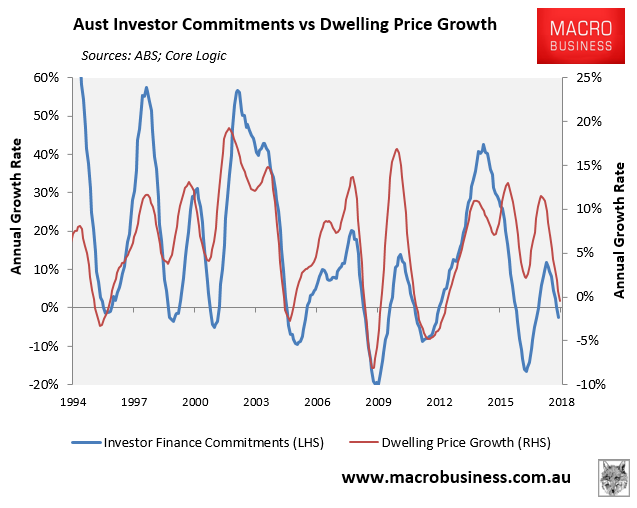
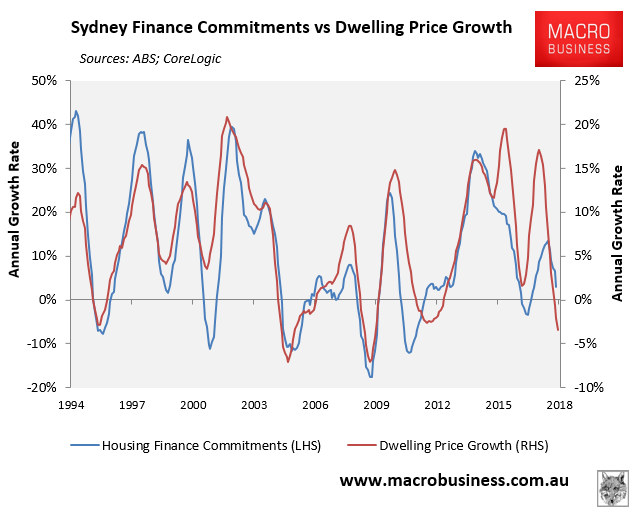
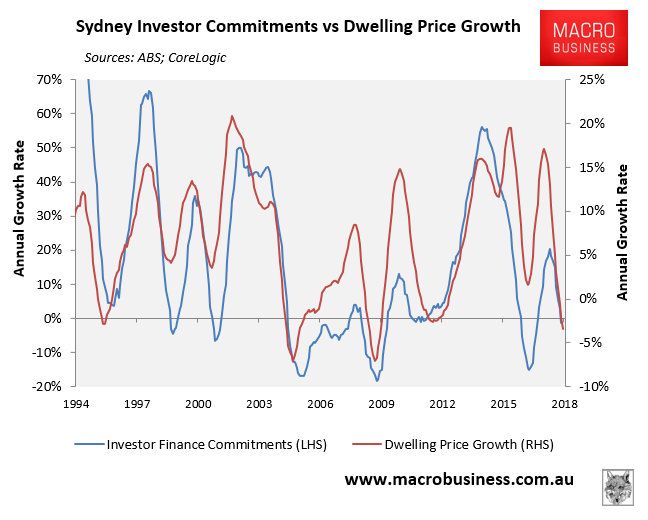
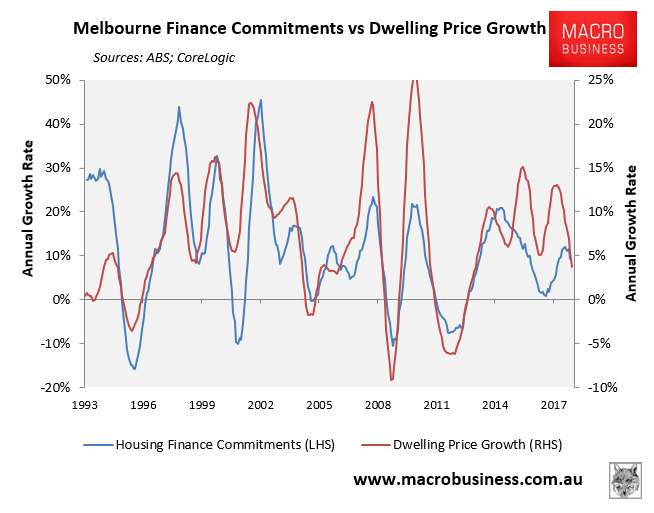
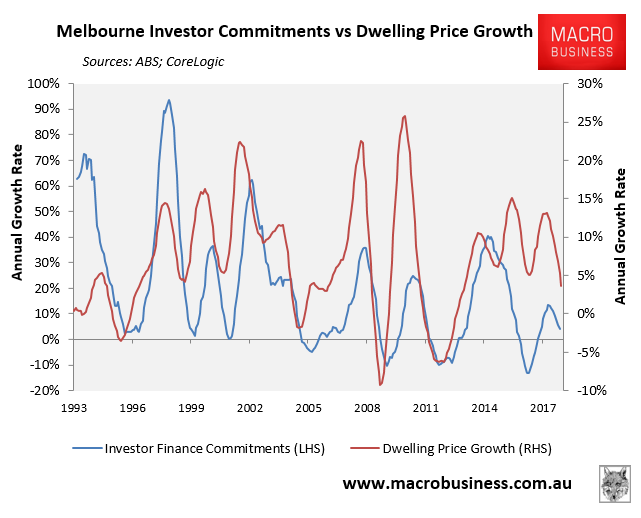
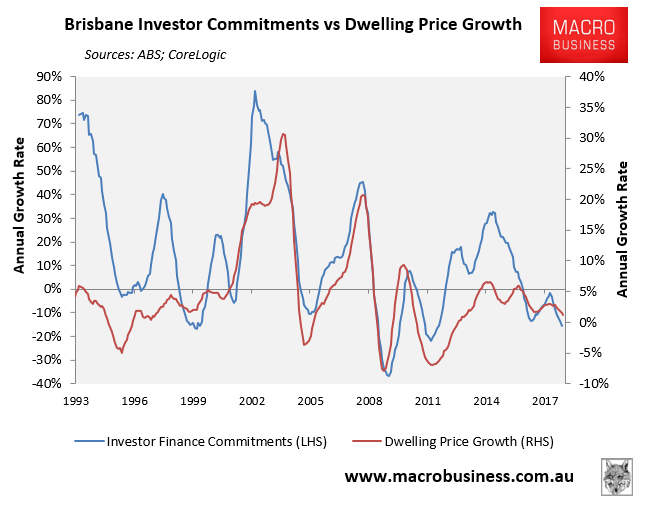
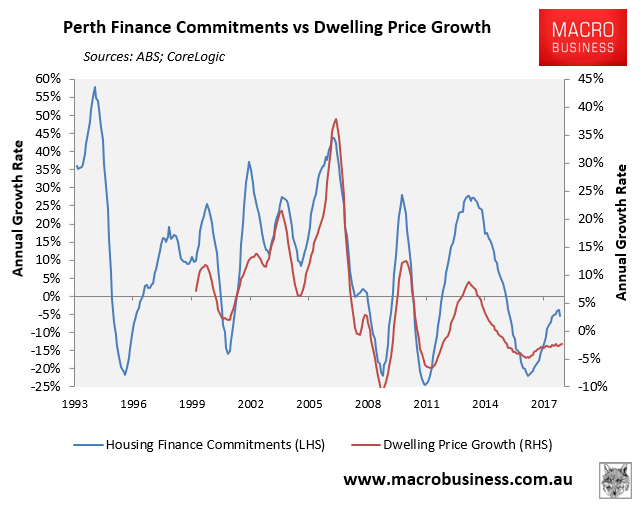
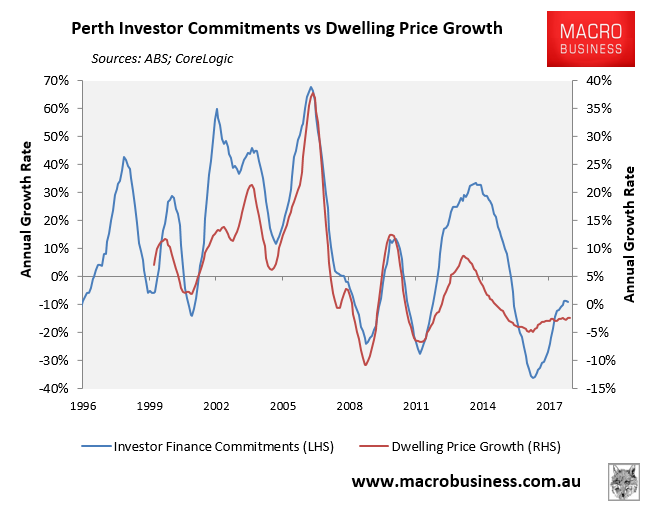
With the release yesterday of the ABS lending finance data for March, it’s an opportune time to once again chart how capital city house prices are tracking against both investor and total housing finance.
As readers no doubt already know, housing finance has historically been strongly correlated with values, therefore it remains one of the best predictors of price growth.
The below charts plot both CoreLogic’s monthly dwelling values index against the value of investor and total finance, as measured by the ABS.
First, here are the national charts:
Next, Sydney:
Next, Melbourne:
Next, Brisbane:

Next, Perth:
And finally, Adelaide:
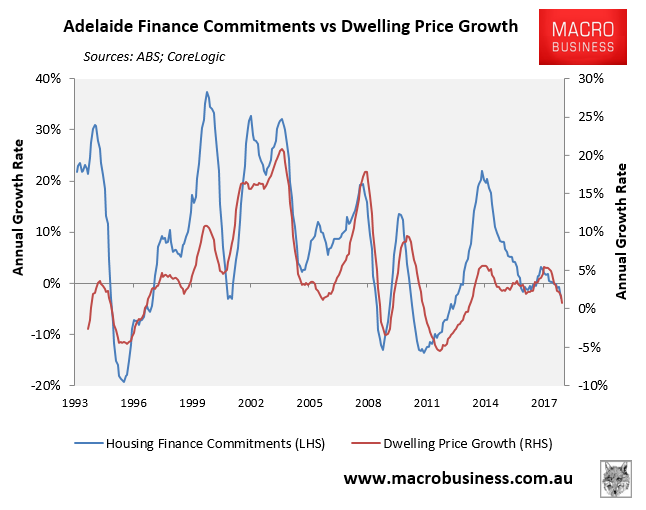
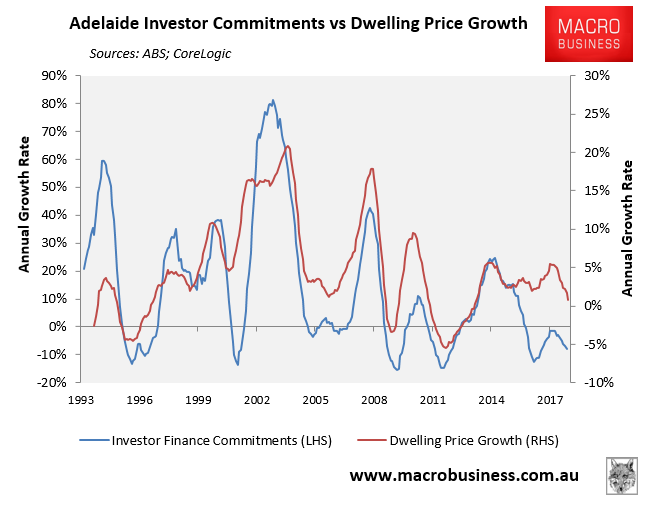
As you can see, investor and housing finance growth as well as house price growth is weakening across all major markets, except Perth.
However, the decline is particularly sharp in the investor hotspot of Sydney, where investors are the marginal price setter.
We already know that investors are likely to face stiff headwinds in the period ahead due to:
- The massive roll-over of interest-only mortgages into principle and interest (raising repayments by 35% to 50%);
- Tightening lending standards arising from the banking Royal Commission;
- Rising bank funding costs; and
- Labor’s negative gearing and capital gains tax reforms should it win the next election.
These factors combined will continue to weigh on housing values and make investing in property a particularly risky proposition, especially in Sydney and to a lesser extent Melbourne, whose markets are most over-valued and where investors are more dominant.
