By Gareth Aird, senior economist at CBA:
Key Points:
- Australian residential property prices have fallen over the past six months.
- Additional declines appear likely over the next 1½ years due to a further tightening in lending standards, a continued lift in supply, potentially higher mortgage rates and more rational price expectations from would-be buyers.
- A hard landing, however, looks unlikely and is not our central scenario.
Overview:
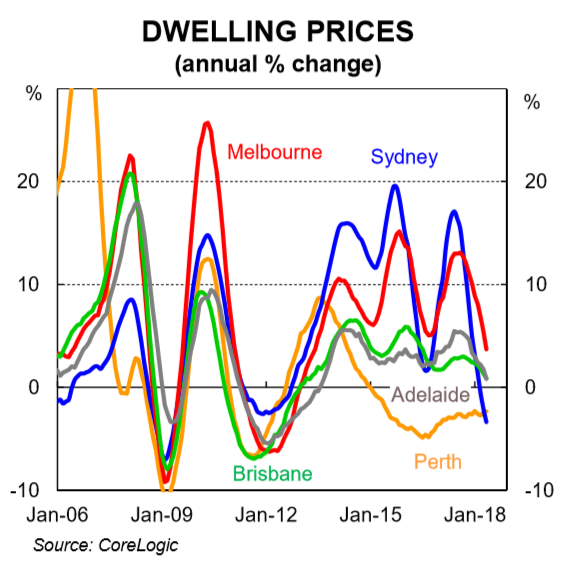
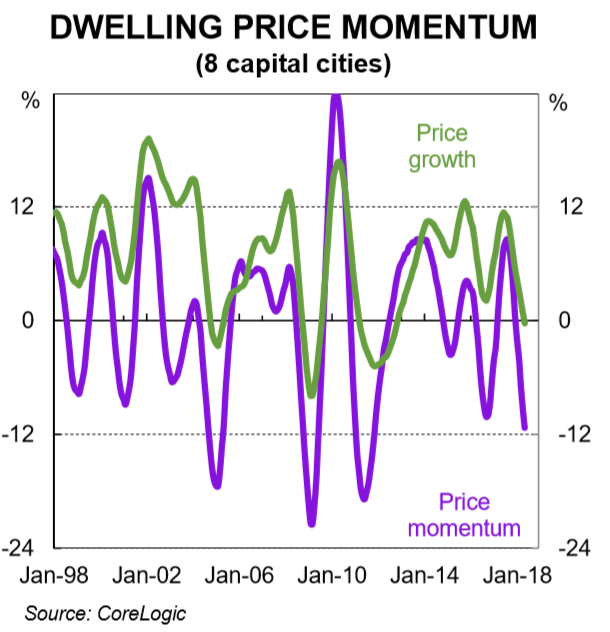
Dwelling prices go through both long-run super cycles as well as shorter-term cyclical trends. The recent evidence suggests that Australia’s latest residential property short-run cycle has come to an end (chart 1). After a little over five years of incredibly strong property price growth, driven by Sydney and Melbourne, dwelling prices have been deflating.
It is our view that prices will to continue to deflate over the next 1½ years. Credit standards are likely to be further tightened, supply will continue to lift, mortgage rates are more likely to go up than down and buyer expectations have adjusted downwards from exuberance to more rational levels. We do not expect a hard landing, however. Population growth, driven by net immigration, is expected to remain strong. And rental growth is still positive, which ensures yields look reasonable in a low interest rate world. We also expect the unemployment rate to gradually drift lower, which means that the risk of default is low.
Given that household debt sits at a record high relative to income and the RBA cash rate is at a record low, there is also a valid question as to whether we are also at the end of the property super-cycle. That is, the capacity for dwelling prices to inflate beyond growth in incomes, as has previously been the case, is far more limited in the absence of even lower interest rates. As interest rates cannot go much lower, at least not in a material sense, we are unlikely to see the sort of growth in dwelling prices over the next 30 years that we did in the previous 30.
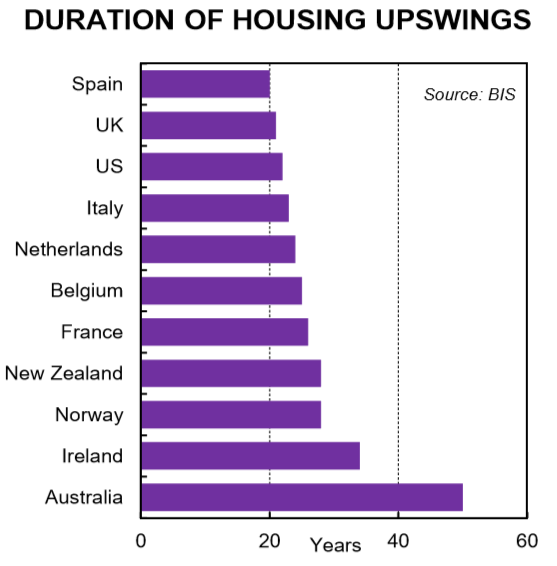
The intention of this publication is not to explore the long-run property super cycle (note that the BIS identify Australia as having the longest-running housing boom – 6,556% over the past 55 years – chart 2). Rather, we focus on what we think is likely to happen over the short-run. While predicting property prices can look foolish retrospectively, our quantitative assessment of the market overlaid with our qualitative views leads us to conclude that further falls in dwelling prices nationally of around 5% look probable, driven by Sydney and Melbourne.
Latest data
Dwelling prices in the eight capital cities combined fell by 0.3% in April. This was the sixth consecutive monthly fall. Dwelling prices are now down 0.3% over the year – the first time they have declined in annual terms since 2012. Units have generally been performing better than detached houses. Over the year, unit prices were up by 1.9% while detached houses were down 1.0%. Units are generally cheaper than houses and the bottom end of the market is holding up better than the top. That’s in part due to first home buyer assistance measures in NSW and Victoria that came into effect last year.
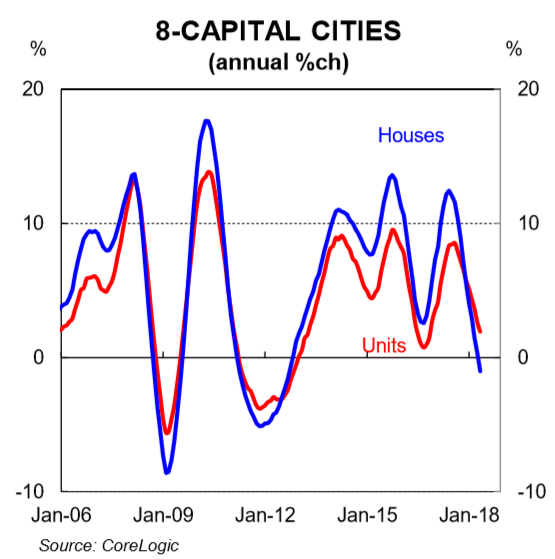
Price falls in Sydney and to a lesser extent Melbourne have been behind the national move lower (chart 3). Dwelling prices in Sydney have fallen for eight consecutive months. They are down 4.3% from their peak in mid-2017. Sydney dwelling prices rose by around 75% between early 2012 and mid-2017. So with that perspective the current deflation has so far been quite mild. Prices have fallen for five consecutive months in Melbourne.
Why are prices falling?
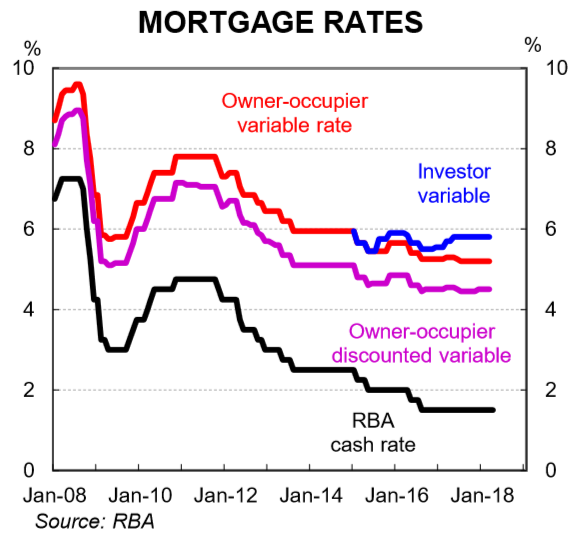
To better understand why dwelling prices have been falling it’s helpful to look at why prices rose so much in the period from early-2012 to mid-2017. We start with monetary policy because the decision to cut interest rates had the biggest impact on property price appreciation. Between November 2011 and August 2016 the RBA slashed the policy rate from 4.75% to a record low of 1.50% – 325bpts. Mortgage rates fell as a result (chart 4). Each interest rate cut essentially meant that for a given level of income a borrower could service a bigger mortgage, all else equal. And it also meant that the yield on property looked attractive relative to term deposits as the return on cash fell.
Falling interest rates stimulated demand for property from both owner-occupiers and investors. It encouraged a lift in the flow of credit and that helped push up dwelling prices, particularly in Sydney and Melbourne. However, it wasn’t just a domestic demand story. Demand for Australian property, particularly in our two largest cities, was augmented by foreign buyers. As a result, three sources of demand were putting upward pressure on prices at a time when supply was relatively constrained and struggling to keep up with population growth. Some, but not all, of those dynamics have started to shift and that has put downward pressure on prices.
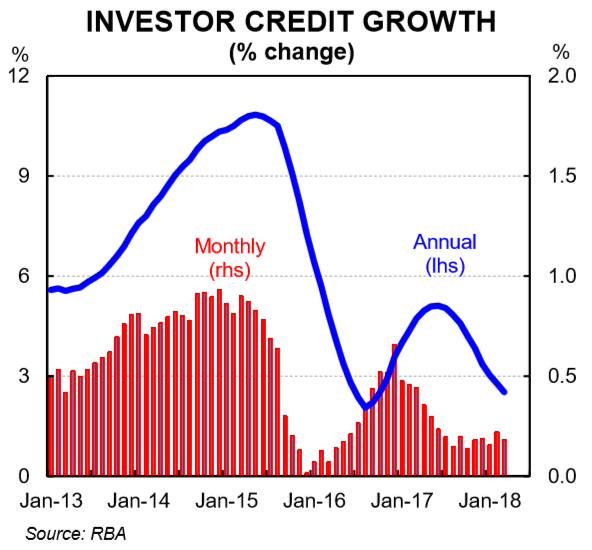
First, the RBA’s policy rate has been on hold since August 2016. But some regulatory changes introduced to slow the flow of credit to investors as well as growth in interest only lending has resulted in higher mortgage rates on some types of loans. These higher mortgage rates have dampened the appetite for credit amongst investors and that is weighing on prices, particularly in Sydney and Melbourne (chart 5).
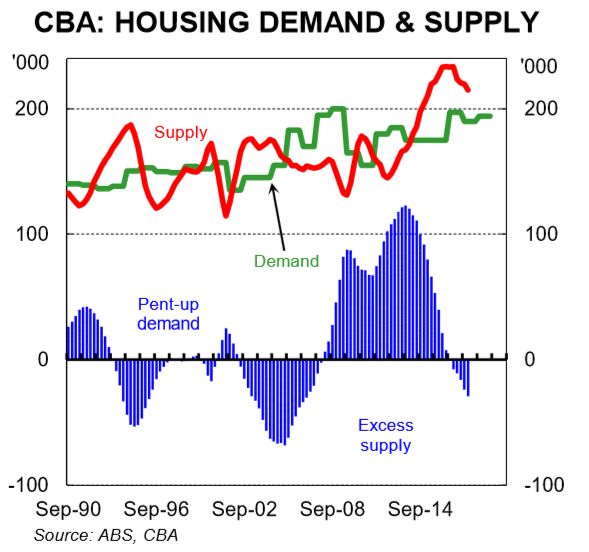
Second, supply has lifted and dwelling investment has caught up to underlying demand (chart 6).
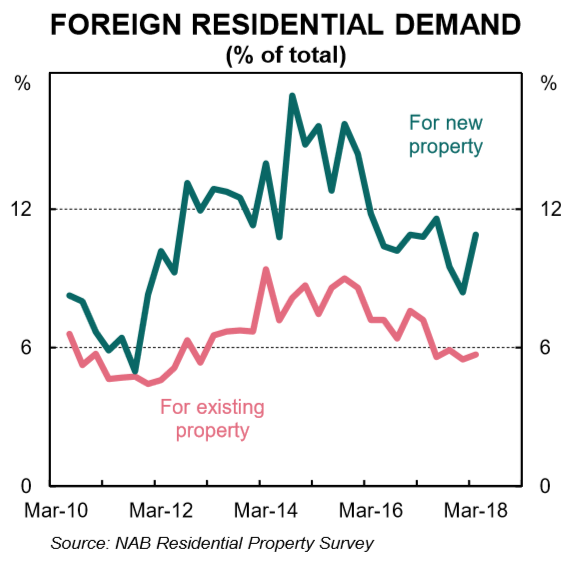
Third, foreign investment in Australian property looks to have waned a little (chart 7). State Government stamp duties levied to foreign investors rose to between 7-8% in both NSW and Victoria in the middle of last year. This has had a dampening impact on demand. Four, momentum has shifted (see below).
How far will prices fall?
Forecasting economic outcomes is an inexact science. And forecasting property prices is particularly challenging because there are so many variables that impact prices. Notwithstanding, we believe there is enough evidence to suggest that property prices are likely to head lower over the next 18 months, particularly in Sydney and Melbourne.
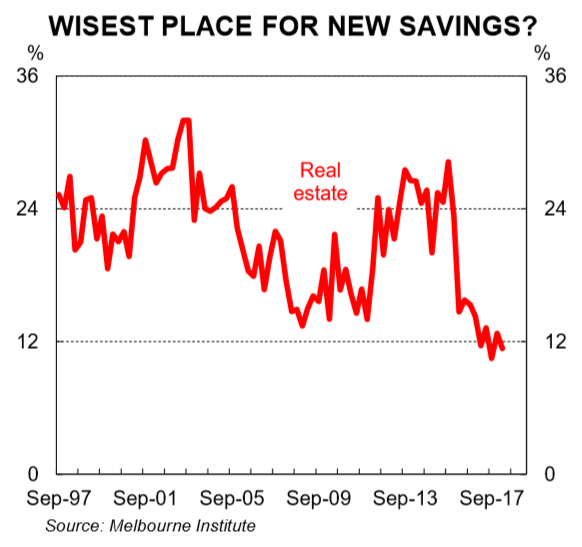
First, momentum has slowed (chart 8). Like most asset markets, momentum is a powerful force. It has clearly shifted down and the euphoria around real estate has waned over the past year. The Melbourne Institute of consumer sentiment provides a quarterly read on what households perceive to be the best place to park savings. In March 2018 (latest available) just 11.4% of households surveyed nominated real estate as the best place to put savings – that was just off its lowest level in 44 years (chart 9).
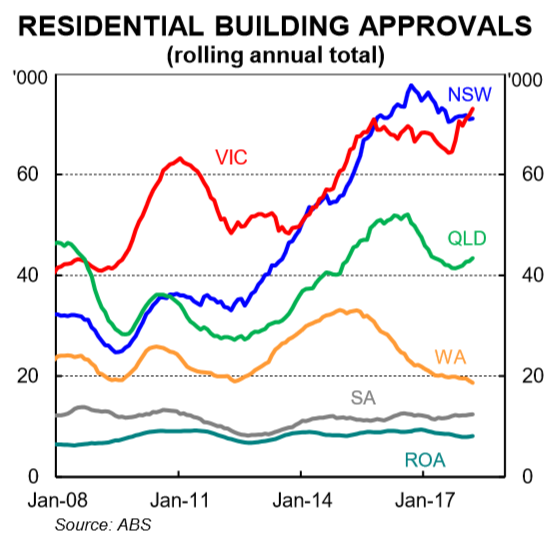
Second, credit growth will slow further if we see any additional tightening in lending standards, which at this stage looks more likely than not. From a financial stability perspective, a tightening in lending standards is not a bad thing. But timing is key. Any potential tightening at a time when momentum is already coming out of the housing market would put downward pressure on prices. Third, auction clearance rates have moved lower. In the past, auction clearance rates have provided a good near term guide to price direction and magnitude. Four, supply is rising significantly in Sydney and Melbourne. The recent trends in the building approvals data points to dwelling commencements and completions running at elevated levels over the next few years (chart 10).
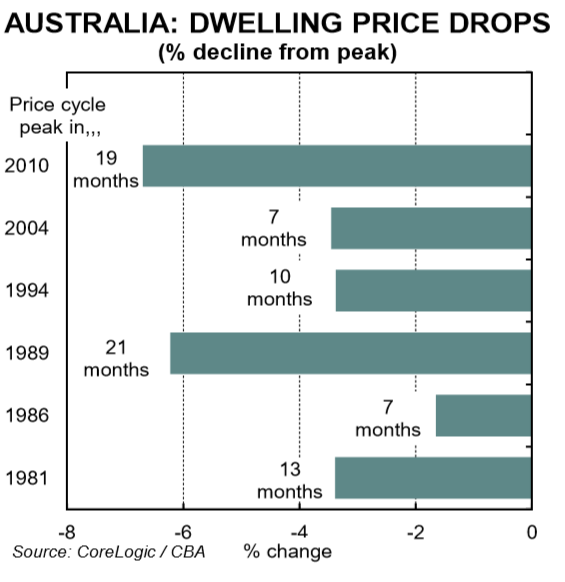
Our base case for property prices has them down by 3-6%pa in Sydney and Melbourne by end 2018. That would take the fall in Sydney prices from its July 2017 peak to around 7½%. For Melbourne, prices would be down by around 5% from their November 2017 peak. Some further dwelling price deflation looks probable in 2019 and we see the peak to trough being around 10% in Sydney and a little less in Melbourne. For Brisbane, we see prices trending sideways over the next 1½ years. Dwelling prices are likely to inch higher in Perth as vacancy rates decline and rents trough. Nationally, we think prices will end the year down by around 2½% with a similar outcome likely in 2019. That would mean the total correction in dwelling prices is not too dissimilar to the corrections of 2010 and 1989 (chart 11).
As always, context is key. A fall in prices in Sydney of 10% from peak to trough would take them back to their September 2016 level. And a fall of around 7½% in Melbourne from peak to trough would take prices back to their December 2016 level. We don’t see prices softening much in the other jurisdictions as they simply didn’t experience the same growth in prices in the prior five year period.
Why not a crash?
A crash could be broadly defined as a fall from peak to trough of around 20%. Many international observers (and a few local ones) expect this result. But that would be a significant correction and would require a lift in the unemployment rate or materially higher interest rates. We have neither outcome in our central scenario. We see the unemployment rate as more likely to drift a little lower from here while any tightening in monetary policy is likely to be very gradual.
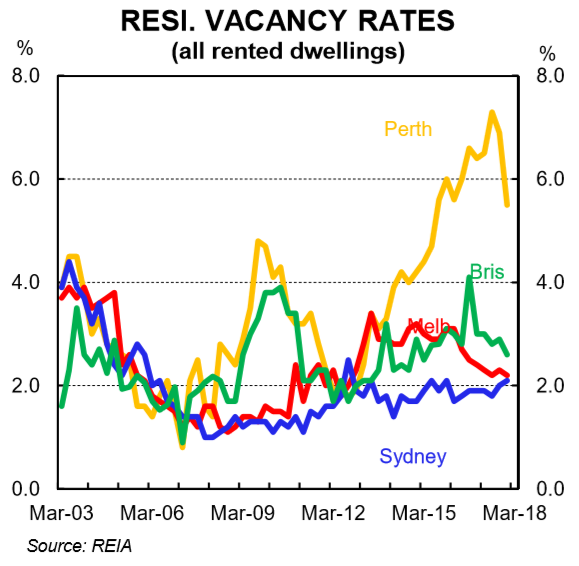
In addition, Australia’s high population growth rate, which is driven by a large intake of around 200k migrants each year, looks set to continue. Despite concerns being raised about Australia’s strong population growth, there is bipartisan support from both major political parties to run a big immigration intake each year. This props up the underlying demand for housing and has kept a lid on vacancy rates in Sydney and Melbourne despite record levels of dwelling investment (chart 12). In fact, as dwelling commencements edge lower policymakers may revert to talking about a “housing shortage” given the sheer growth in the number of people living in both Sydney and Melbourne.
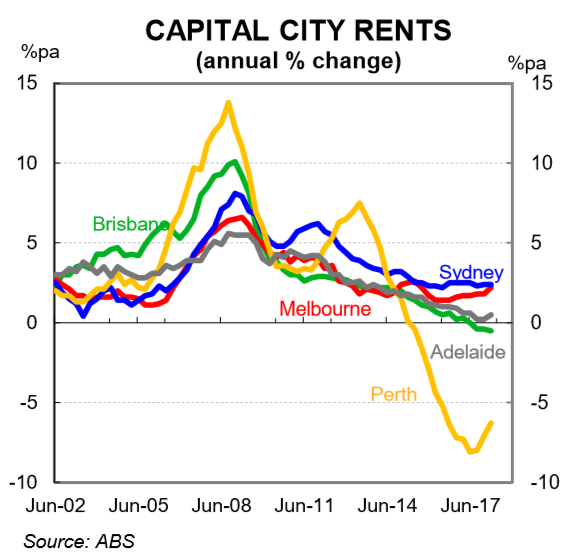
Finally, rental growth remains positive in Sydney and Melbourne (chart 13). We don’t see rents falling in Sydney or Melbourne without a lift in vacancy rates and that does not appear likely without a change in Australia’s immigration policy. As such, rental growth is expected to remain positive in Sydney and Melbourne which provides a natural floor on how far dwelling prices can correct lower.
Impact on the economy and monetary policy
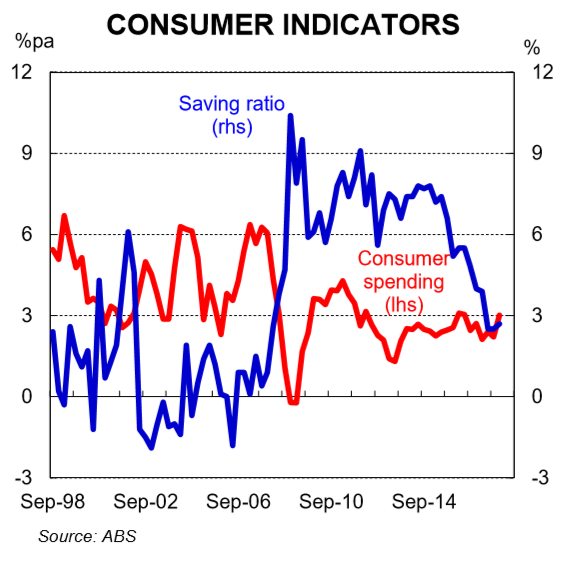
Changes in dwelling prices have an impact on the spending decisions of households via the wealth effect (the notion that changes in demand are influenced by changes in the value of assets). The theory states that when the market value of assets rise, it leads to the feeling of being wealthier which should encourage spending and reduce savings.
In Australia, the falling saving rate is evidence that a wealth effect has been in play. Now it may be the case that the saving rate declined simply so that households could maintain a modest level of consumption growth in the face of falling income growth (chart 14). But the point to note is that firmer dwelling price growth gave those households that own property greater scope to reduce savings given their balance sheets were optically strengthened. Certainly there is a high likelihood that the reverse would be true and households would rein in spending if dwelling prices were falling.