
As summarised earlier, the Australian Bureau of Statistics (ABS) today released its labour force report for April, which registered a 22,600 increase in total employment but an increase in the headline unemployment rate to 5.6% from 5.5%.
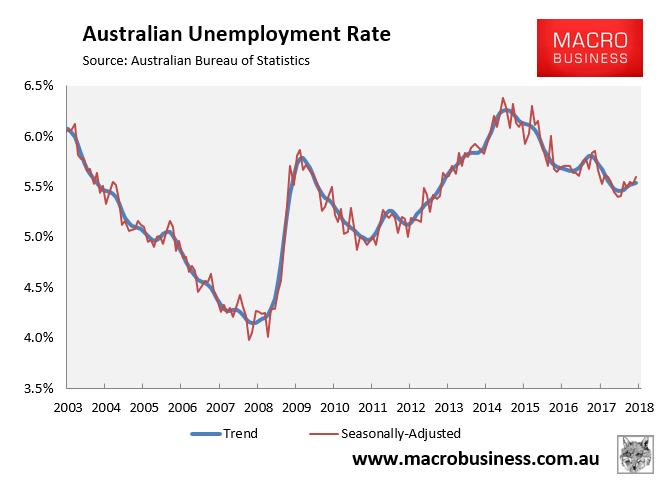
In trend terms, the unemployment rate rose marginally from 5.53% to 5.54%:
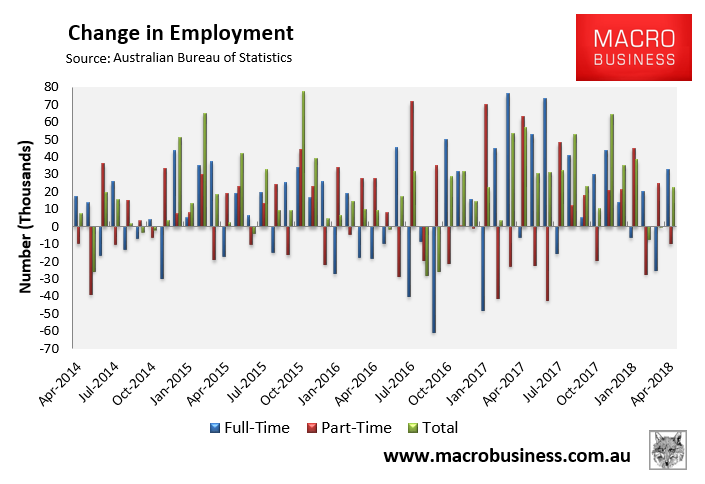
Again, total employment rose by a seasonally adjusted 22,600 to 12,501,000. Full-time jobs increased by 32,700, whereas part-time employment decreased by 10,000:
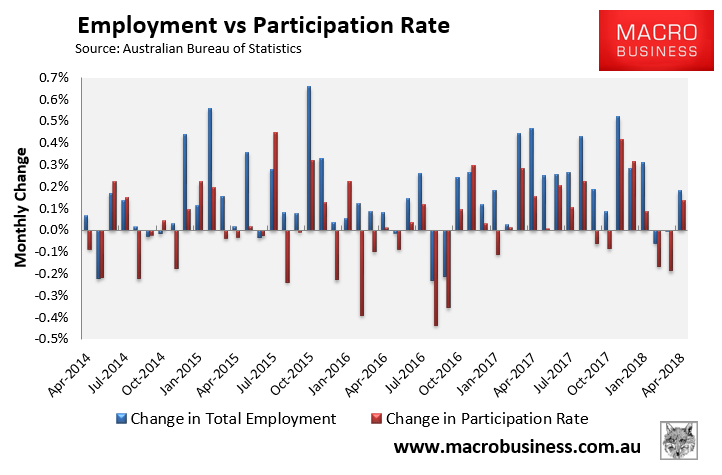
The participation rate rose 0.1% to 65.6%, which is part of the reason why the unemployment rate rose:
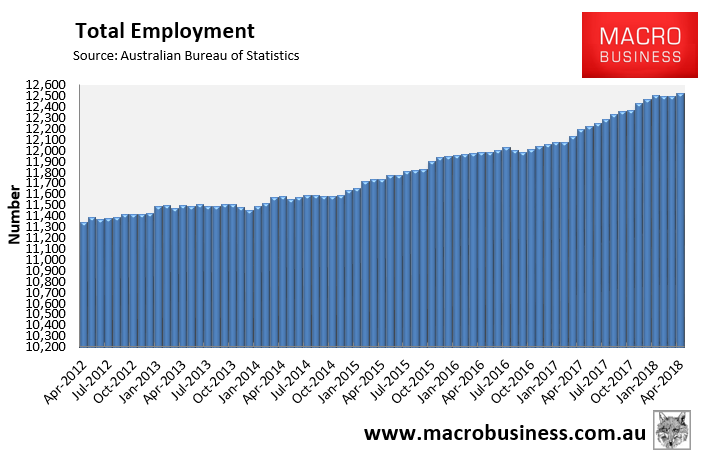
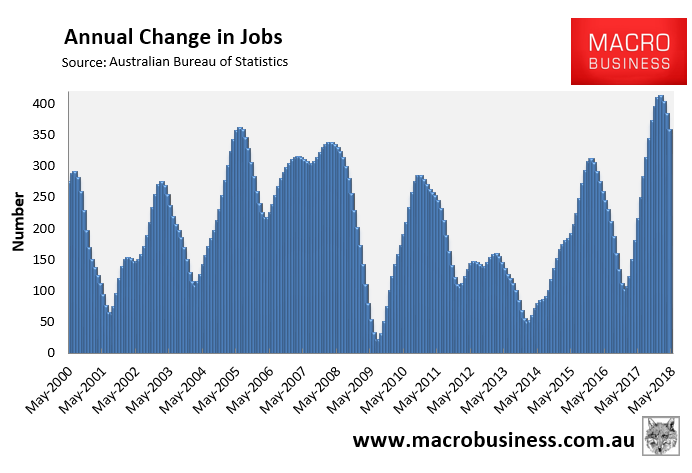
Total employment has flatlined and annual growth is falling:
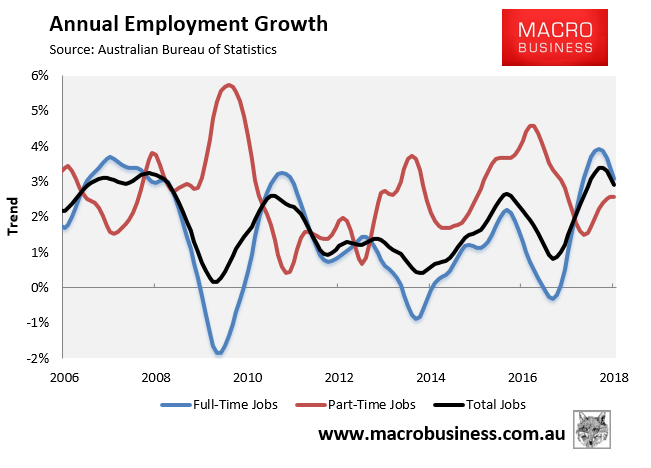
The trend annual growth rate is also fading (+2.7%) on the back of weakening full-time employment growth from strong levels (+3.1%), whereas part-time employment growth has flatlined (+2.6%):
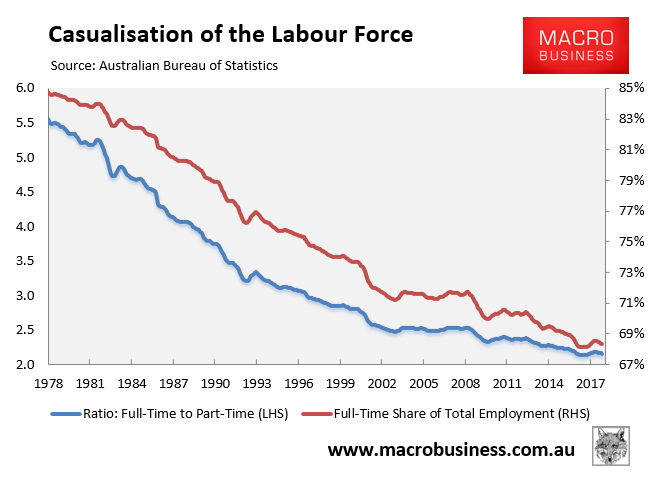
The proportion of the population in full-time work has also begun to fade again after recovering recently:
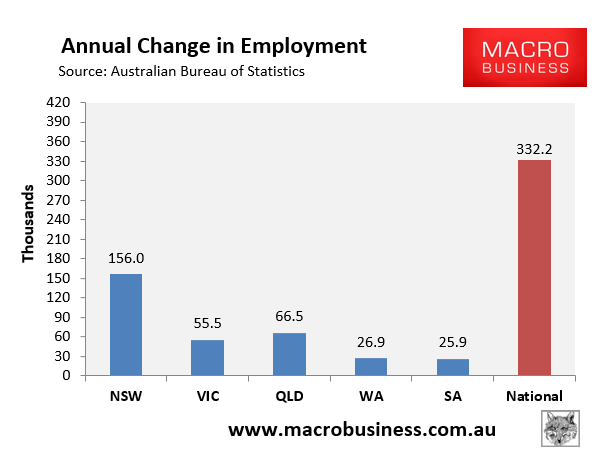
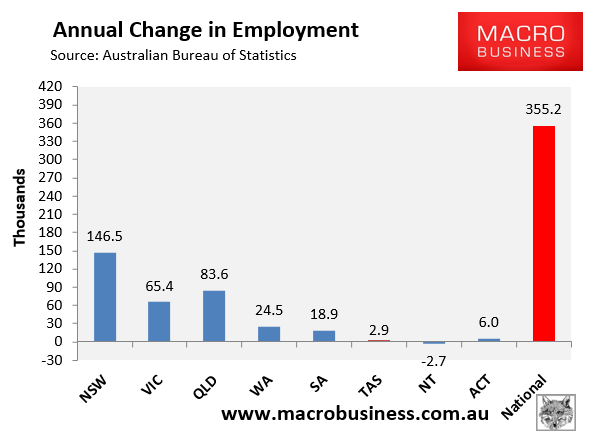
In March, NSW has easily led jobs growth over the past year in seasonally-adjusted terms:
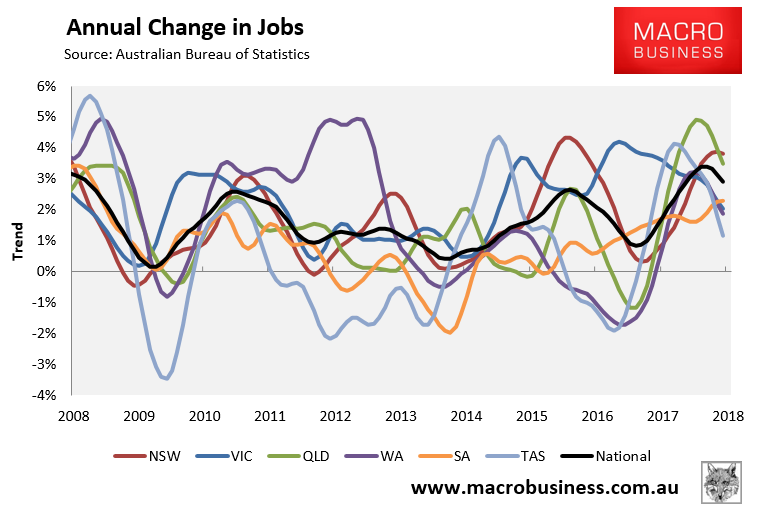
The state seasonally-adjusted figures are notoriously volatile and subject to a big margin of error. As such, the below chart tracks state jobs growth in trend terms. Here, the three major jurisdictions have driven the jobs growth:
All states are now experiencing annual jobs growth in trend terms, although growth is fading:
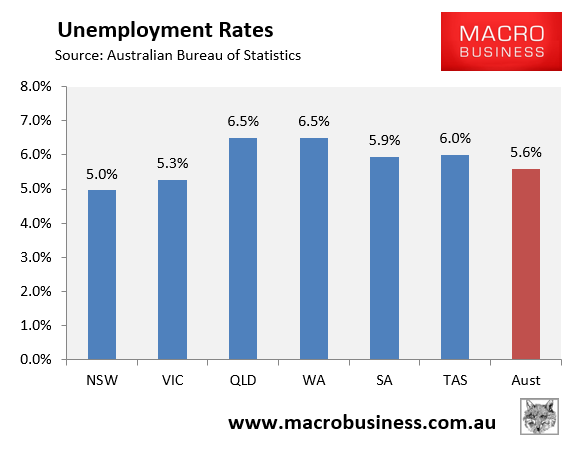
WA and QLD now have the highest seasonally adjusted unemployment and NSW and VIC by far the lowest:
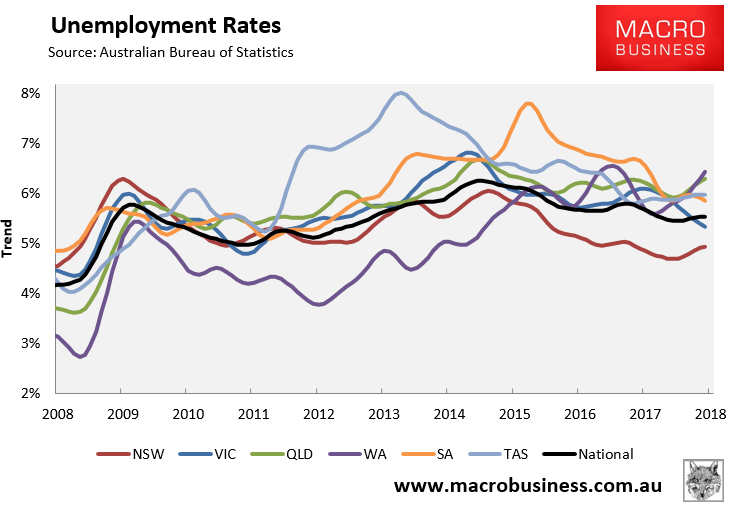
The below chart shows the ABS’ trend unemployment rates, which shows NSW with by far the lowest unemployment and WA and QLD with the highest:
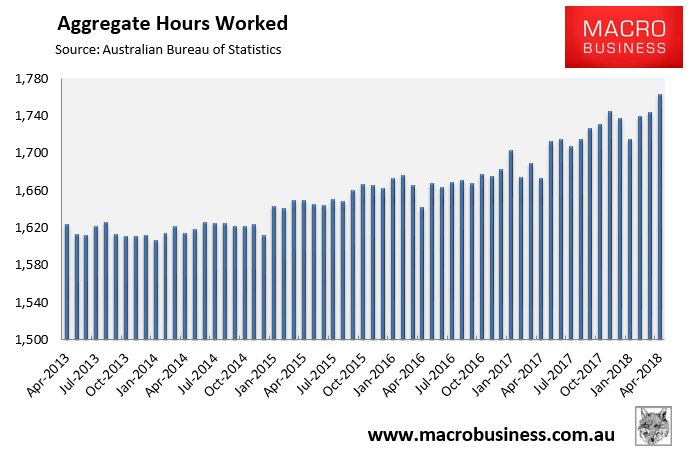
The aggregate number of hours worked jumped in April in seasonally adjusted terms. Total hours worked rose by 19.4 million hours or 1.11% in April. Hours worked have also risen by 5.4% over the past year:
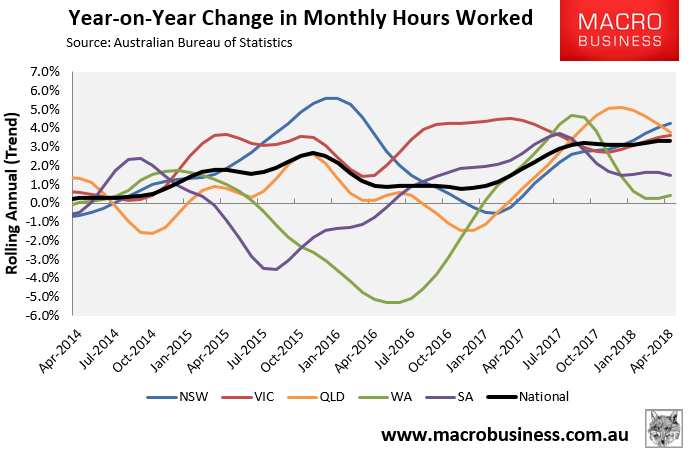
The below chart, which tracks the annual change in hours worked on a trend basis, paints a stagnating picture, with mixed growth across jurisdictions and flat 3.3% growth recorded nationally:
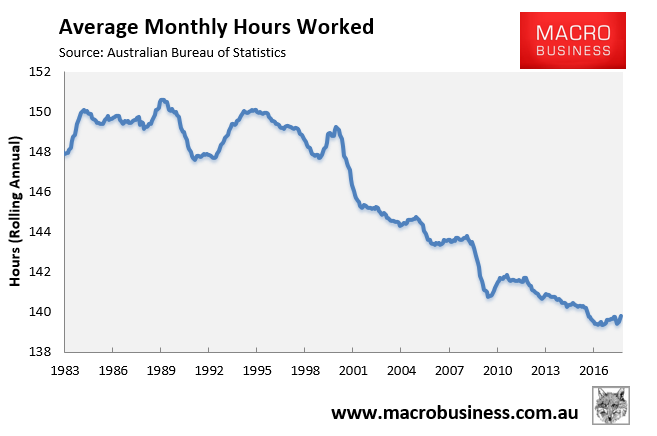
Average hours worked is also stuck near all-time lows, but has at least improved slightly:
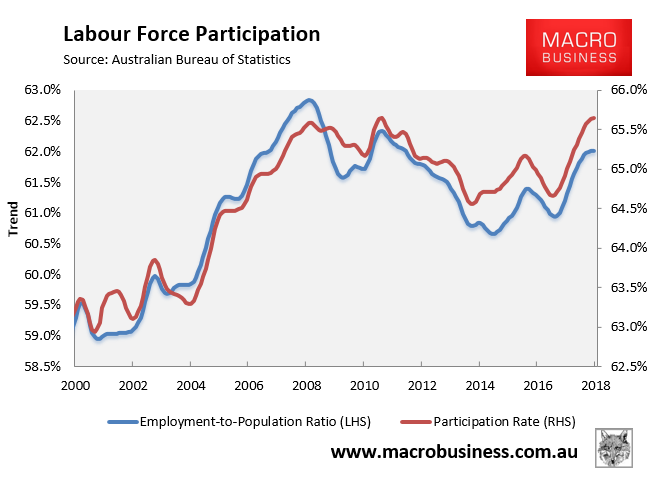
However, workforce participation continues to power in trend terms, and is travelling near all-time highs:
Finally, the next chart summarises the annual change in the key employment aggregates on a seasonally-adjusted basis, which shows a broadly recovering labour market:
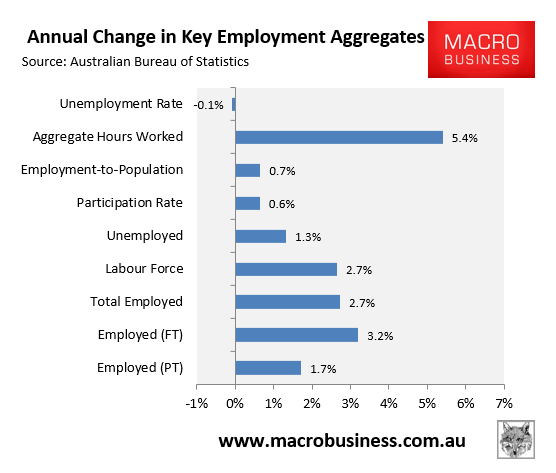
While conditions remain fairly strong overall, jobs growth is fading. Significant labour market slack also remains.
