
By Wendell Cox, cross-posted from New Geography:
Housing affordability is what largely drives the standard of living the United States. The 14th Annual Demographia International Housing Affordability Survey showed that, in 2016, there was a 0.83 correlation between the housing unaffordability, measured by the Median Multiple (median house price divided by median household income) and the composite cost of living (Note 1) for households entering the housing market in the 107 metropolitan areas with more than 500,000 residents (Note 2). This cost of living is the income required to live a “median standard of living” (Note 3).
Housing is the largest expenditure item in the household budget. Higher house prices have a disproportionate potential to reduce the standard of living by consuming funds that would otherwise be available to purchase other goods and services. Even more concerning, high house prices, and related high rents, increase relative poverty, as many lower income households may have to forego basic goods and services because of higher housing costs, and may even be forced to seek public housing subsidies.
Worsening housing affordability and its adverse impact on the declining standard of living threaten one of the greatest human advances in history – the democratization of prosperity. The abject poverty that had afflicted humanity for millennia until barely 200 years ago has been replaced by unimaginable affluence and dramatic reductions in poverty, with considerable progress made since the World War II recovery. Economists Diedre McClosky of the University of Illinois (Chicago) and Robert Gordon of Northwestern University have published works documenting this progress.
Example: San Francisco and Atlanta
The influence of housing costs on the standard of living is illustrated by comparing the San Francisco and Atlanta metropolitan areas.
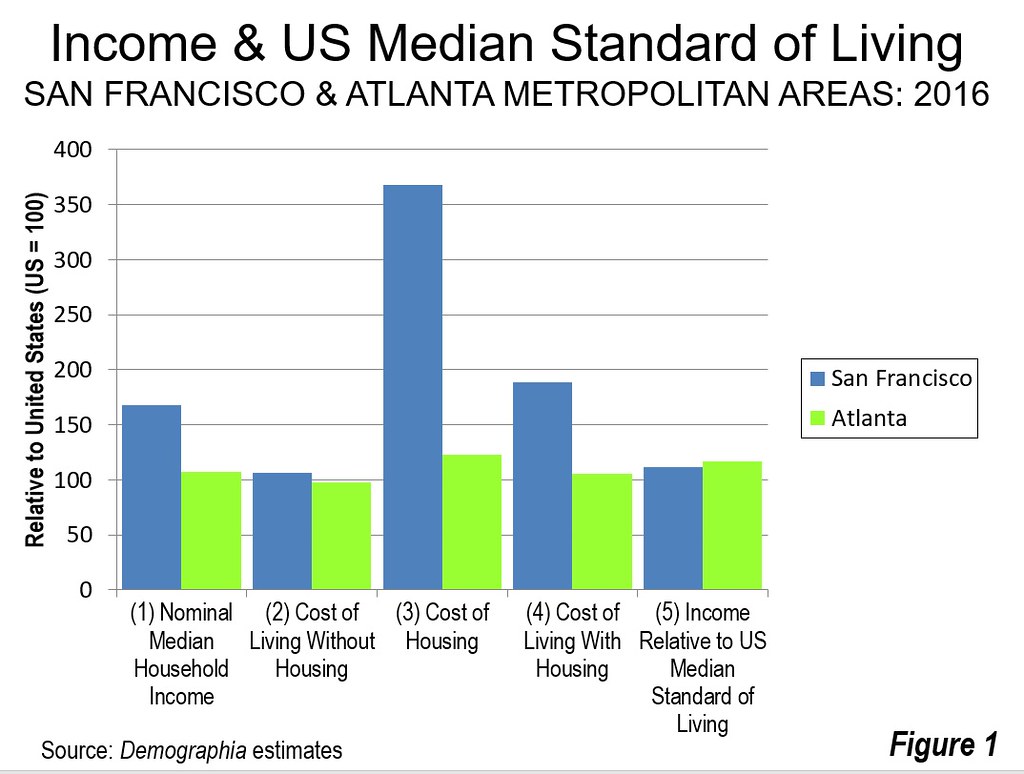
In the San Francisco metropolitan area, the median household income (not adjusted for the cost of living) is approximately 55 percent greater than in the Atlanta metropolitan area (Figure 1, column 1).
Without housing, there is little difference in the cost of living between San Francisco and Atlanta (Figure 1, Column 2). San Francisco’s cost of living for goods and services other than housing is no more than nine percent higher than in Atlanta (Figure 1, column 2).
However, San Francisco’s cost of housing is nearly three times that of Atlanta (Figure 1, Column 3). This higher cost of housing drives San Francisco’s cost of living to more than 75 percent above that of Atlanta (Figure 1, Column 4).
San Francisco’s high cost of housing clearly cancels out its income advantage over Atlanta. When adjusted for the cost of living, the San Francisco household’s income is only 12 above that required for the median standard of living (which is defined in Note 3). By comparison, the Atlanta household has an cost of living adjusted income 17 percent greater than required for the median standard of living (Figure 1, column 4).
The Atlanta advantage would likely be greater if the effect of the progressive federal income tax were included and even greater if California’s onerous state income tax were considered. This is particularly relevant under the newly enacted federal tax law. (Note 4).
Similar comparisons could be made between severely unaffordable markets, such as Los Angeles, San Diego, Portland, Seattle, New York and Denver with much more affordable markets, such as Chicago, Dallas-Fort Worth, Houston and Indianapolis.
Well-Functioning Housing Markets
The key to both housing affordability and an affordable standard of living is a competitive land market that makes it possible to produce housing at production costs, including competitive profit margins. Economists Edward Glaeser of Harvard University and Joseph Gyourko of the University of Pennsylvania, have defined this concept as the minimum profitable production cost (MPPC).
For single detached houses in the United States, their research indicates that land (with associated infrastructure) costs 20% or less of the MPPC final house and land sale price. Glaeser and Gyourko consider a housing market to be functioning well if houses are produced at no more than 25 percent above the MPPC.
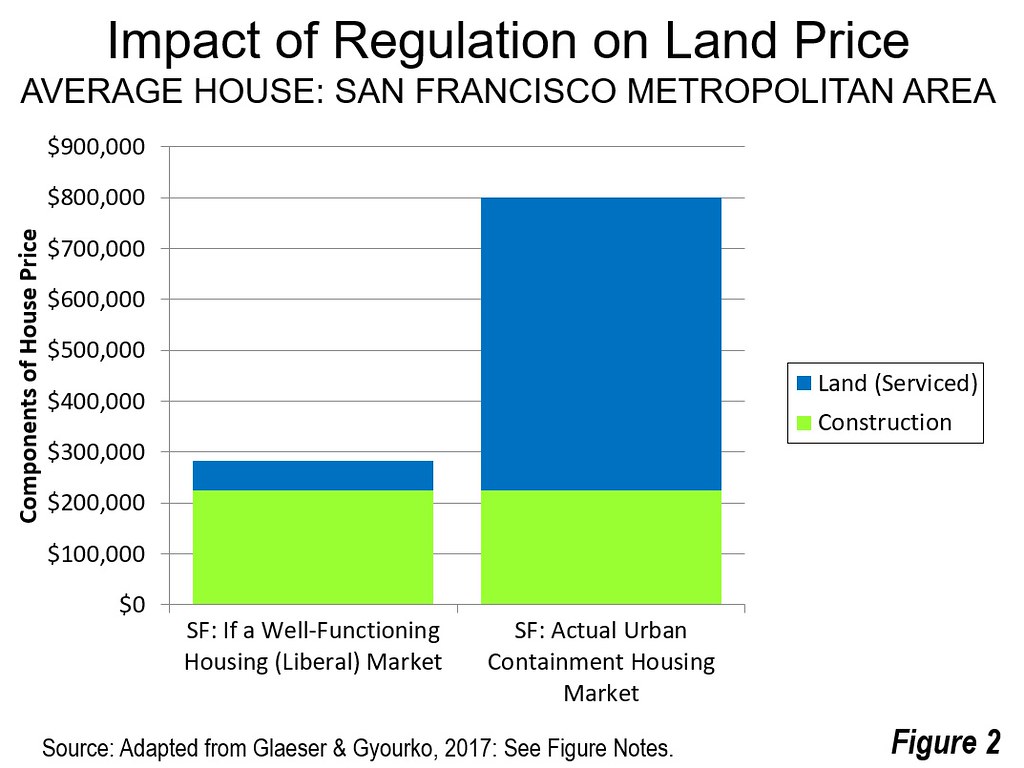
Glaeser and Gyourko find little change in construction costs over the period that unaffordable markets have developed. The key difference is that land costs have risen substantially. For example, Glaeser and Gyourko find that virtually all of the costs above minimum production costs in the San Francisco metropolitan area are in land. According to their estimates (adjusted to allocate profits based proportionally between construction and land), land in the San Francisco metropolitan area is valued at 10 times the cost that would be expected in a well functioning housing market (Figure 2). Rather than representing 20 percent of the final cost, they estimated land represents more than 70 percent of the cost. The San Francisco market, with its strong urban containment policies had been well-functioning before the imposition of restrictive land use regulation, starting about 1970, when Median Multiples were under 3.0.
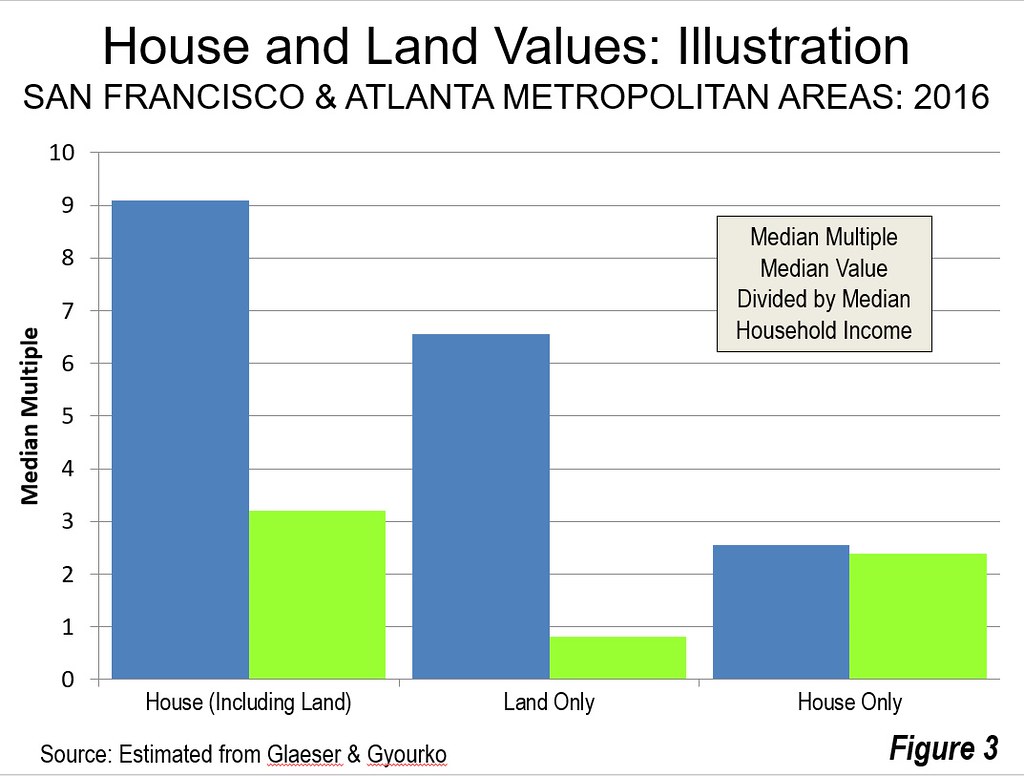
Still Unaffordable Even if the House is Free
With land costs so high in San Francisco, even if the house could be built for free, the land alone would be severely unaffordable, as is indicated in Figure 3.
Extraordinarily high house prices in places like San Francisco have significantly reduced discretionary income in the costly markets that could otherwise be used for other goods and services. If land markets were competitive, as before, households could consume or save more. This would increase the standard of living, and lead to higher levels of employment and economic growth. Further, the higher housing prices feed the demand for more low-income affordable housing, which requires public subsidies.
Note 1: This article is adapted from the 14th Annual Demographia International Housing Affordability Survey.
Note 2: Correlation is measured on a scale of from 1.00 (perfect correlation or perfect relationship) to minus 1.00 (no correlation or no relationship). This analysis compares 2016 costs of living for households moving to metropolitan areas and the corresponding Median Multiples, weighted by the national home ownership versus rental share. The calculation the home buyer purchases the median priced house at typical purchase conditions. See Center for Opportunity Urbanism (2017), COU Standard of Living Index.
Note 3: The median standard of living is defined as the cost of living for a household recently moving to the area. It is assumed that the household will either purchase a median prices house, on typical terms, or pay median rent for a housing unit. The data is weighted at the US tenure rates for home ownership and renting.
Note 4: Comparable income tax information is not readily available.
Wendell Cox is principal of Demographia, an international public policy and demographics firm. He is a Senior Fellow of the Center for Opportunity Urbanism (US), Senior Fellow for Housing Affordability and Municipal Policy for the Frontier Centre for Public Policy (Canada), and a member of the Board of Advisors of the Center for Demographics and Policy at Chapman University (California). He is co-author of the “Demographia International Housing Affordability Survey” and author of “Demographia World Urban Areas” and “War on the Dream: How Anti-Sprawl Policy Threatens the Quality of Life.” He was appointed to three terms on the Los Angeles County Transportation Commission, where he served with the leading city and county leadership as the only non-elected member. He served as a visiting professor at the Conservatoire National des Arts et Metiers, a national university in Paris.